

Key Insights
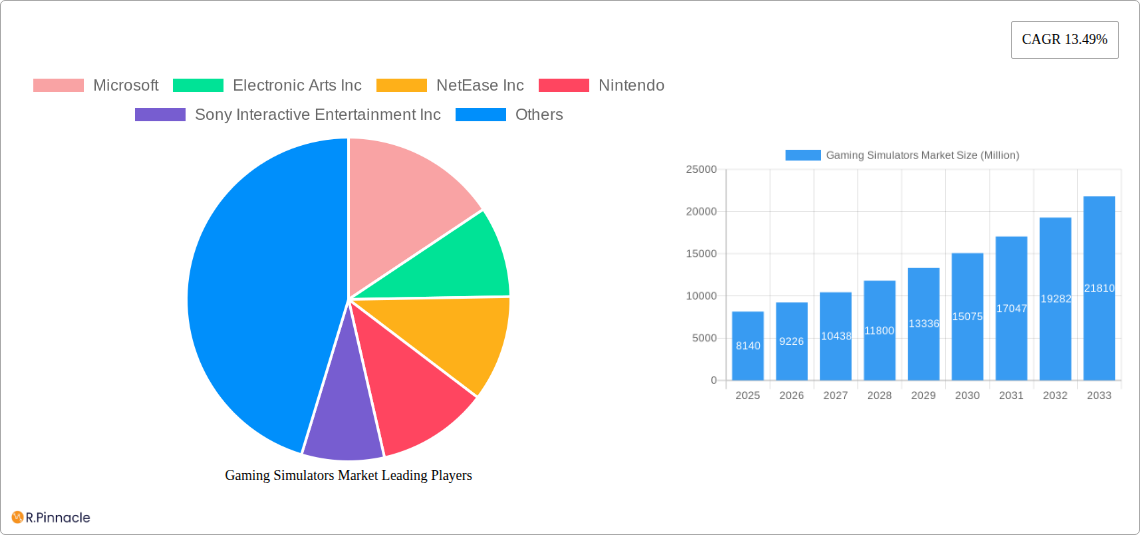
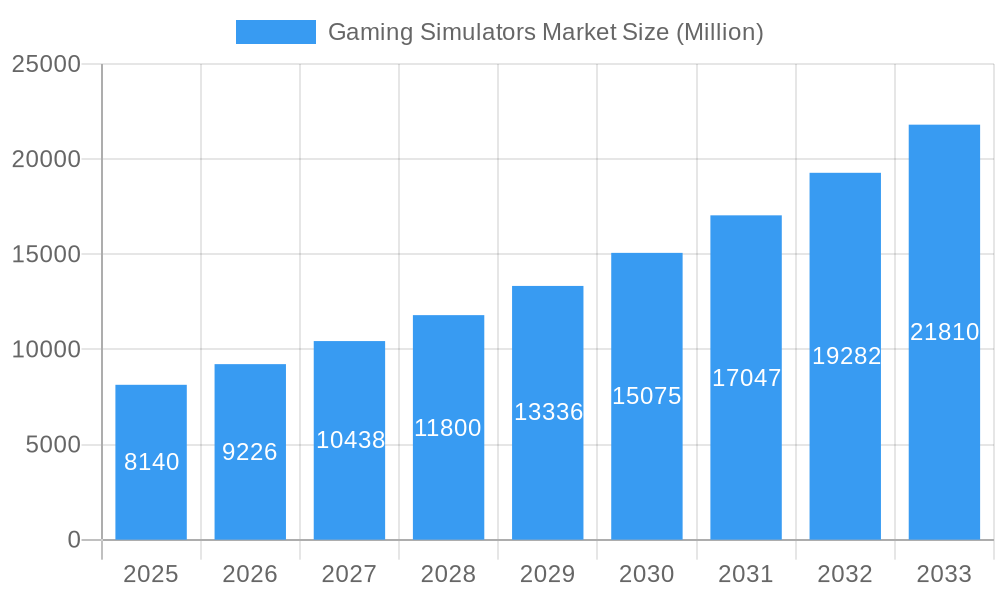
The gaming simulator market, valued at $8.14 billion in 2025, is projected to experience robust growth, driven by several key factors. The increasing popularity of esports, coupled with advancements in virtual and augmented reality (VR/AR) technologies, is significantly boosting demand for realistic and immersive gaming experiences. This is further fueled by the rising disposable incomes in emerging economies and the expanding accessibility of high-speed internet, enabling wider participation in online gaming and simulator use. The market is segmented by type into advertising-based, in-app purchase, and paid app models, each contributing to the overall market size. Major players like Microsoft, Electronic Arts, Tencent, and Sony are investing heavily in research and development, leading to innovative simulator designs and enhanced gaming features. The competitive landscape is characterized by continuous innovation and mergers & acquisitions, driving market consolidation and further expansion.
Gaming Simulators Market Market Size (In Billion)
However, the market faces certain challenges. The high initial investment costs associated with developing and maintaining sophisticated gaming simulators can pose a barrier to entry for smaller players. Furthermore, concerns regarding potential health issues related to prolonged gaming sessions and the need for constant software updates and maintenance are factors that could restrain growth to some extent. Geographical distribution shows significant potential for growth in Asia Pacific, fueled by its large and rapidly expanding gaming community. North America and Europe, while mature markets, still offer substantial opportunities due to the continued technological advancements and the increasing adoption of cloud-based gaming platforms, which enhance accessibility and affordability. The forecast period (2025-2033) is expected to witness a sustained CAGR of 13.49%, leading to significant market expansion.
Gaming Simulators Market Company Market Share
Gaming Simulators Market: A Comprehensive Report (2019-2033)
This in-depth report provides a comprehensive analysis of the Gaming Simulators Market, offering invaluable insights for industry professionals, investors, and strategic decision-makers. Covering the period from 2019 to 2033, with a focus on 2025, this report meticulously examines market dynamics, key players, and emerging trends, ultimately projecting robust growth and significant opportunities. The report utilizes a robust methodology, incorporating historical data (2019-2024), current estimates (2025), and future projections (2025-2033) to offer a holistic view of the market.
Gaming Simulators Market Market Structure & Innovation Trends
The Gaming Simulators Market exhibits a moderately concentrated structure, with key players such as Microsoft, Electronic Arts Inc, NetEase Inc, Nintendo, Sony Interactive Entertainment Inc, Activision Blizzard Inc, Tencent, Square Enix Co Ltd, Take-Two Interactive Software Inc, and Bandai Namco Entertainment Inc holding significant market share. However, the market also accommodates numerous smaller, specialized developers. Market share dynamics are influenced by factors like technological advancements, intellectual property rights, and aggressive marketing strategies. M&A activity has been significant, with deals valued at approximately xx Million in the last five years, primarily driven by the desire to acquire innovative technologies and expand market reach. Innovation is primarily fueled by advancements in AI, VR/AR technologies, and improved graphics capabilities, leading to more immersive and realistic gaming experiences. Regulatory frameworks, while evolving, generally encourage market growth, although concerns around data privacy and age restrictions remain. The market sees limited direct substitutes, with the primary competition stemming from other entertainment mediums. End-user demographics skew towards younger age groups, but the market increasingly caters to broader demographics through diverse game types and platforms.
Gaming Simulators Market Market Dynamics & Trends
The Gaming Simulators Market is projected to experience significant growth, with a Compound Annual Growth Rate (CAGR) of xx% during the forecast period (2025-2033). This growth is primarily driven by the increasing popularity of esports, the rising adoption of advanced gaming technologies (like VR/AR), and the growing accessibility of high-speed internet. Technological disruptions, particularly in AI and cloud gaming, are reshaping the competitive landscape, creating opportunities for both established and emerging players. Consumer preferences are shifting towards more realistic and immersive experiences, demanding higher-quality graphics and more intricate game mechanics. Competitive dynamics are intensifying, with major players investing heavily in research and development to enhance their game offerings and expand their market presence. Market penetration, particularly in emerging markets, remains a key driver for growth. The estimated market size in 2025 is xx Million, projected to reach xx Million by 2033.
Dominant Regions & Segments in Gaming Simulators Market
The North American market currently dominates the Gaming Simulators Market, driven by strong consumer demand, high disposable incomes, and a well-established gaming infrastructure. However, Asia-Pacific is projected to experience the fastest growth due to its expanding gaming community and rapidly improving technological infrastructure.
- Key Drivers for North America:
- High disposable income levels.
- Established gaming culture and infrastructure.
- Strong consumer demand for high-quality gaming experiences.
- Key Drivers for Asia-Pacific:
- Rapidly growing gaming community.
- Increasing internet penetration and mobile adoption.
- Favorable government policies supporting the gaming industry.
By Type:
- Paid Apps: This segment currently holds the largest market share due to the premium experience and dedicated player base willing to pay for high-quality content.
- In-App Purchases: This segment is exhibiting rapid growth, driven by the monetization strategies employed by many gaming companies, allowing for sustained engagement and revenue generation.
- Advertising: This segment is experiencing moderate growth, although it is typically less lucrative than other monetization models.
Gaming Simulators Market Product Innovations
Recent product innovations focus on enhancing realism, immersion, and accessibility. The integration of AI, as exemplified by Gran Turismo Sophy, is revolutionizing gameplay, creating more challenging and dynamic experiences. Advancements in VR/AR technologies are pushing the boundaries of immersive gaming, while cloud gaming services are expanding accessibility across various devices and platforms. These innovations cater to evolving consumer preferences for richer, more interactive, and readily available gaming experiences.
Report Scope & Segmentation Analysis
This report segments the Gaming Simulators Market by Type: Advertising, In-App Purchase, and Paid App. Each segment is analyzed in detail, including growth projections, market size estimates, and competitive dynamics. The Paid App segment is projected to maintain its dominance due to its premium offerings. The In-App Purchase segment is expected to demonstrate rapid growth due to its revenue model. The Advertising segment will experience steady but slower growth compared to the other two.
Key Drivers of Gaming Simulators Market Growth
The Gaming Simulators Market's growth is fueled by several key factors. Advancements in AI, VR/AR, and graphics processing are creating more immersive gaming experiences. The rise of esports is generating substantial interest and driving market demand. The increasing availability of high-speed internet and mobile devices expands accessibility, bringing gaming to a wider audience. Furthermore, favorable government policies in many regions are fostering market growth.
Challenges in the Gaming Simulators Market Sector
The Gaming Simulators Market faces challenges such as the high cost of development and production, intense competition among established players, and the risk of piracy and unauthorized distribution. Regulatory hurdles in some regions also pose limitations, impacting market expansion. Supply chain disruptions can affect the availability of hardware and components.
Emerging Opportunities in Gaming Simulators Market
Emerging opportunities include the expansion into new markets, particularly in developing economies. The integration of blockchain technology offers potential for new gaming models. The metaverse presents exciting prospects for immersive and interactive gaming experiences. The increasing demand for personalized and customized gaming experiences also presents a significant market opportunity.
Leading Players in the Gaming Simulators Market Market
- Microsoft
- Electronic Arts Inc
- NetEase Inc
- Nintendo
- Sony Interactive Entertainment Inc
- Activision Blizzard Inc
- Tencent
- Square Enix Co Ltd
- Take-Two Interactive Software Inc
- Bandai Namco Entertainment Inc
Key Developments in Gaming Simulators Market Industry
- February 2022: Gran Turismo SophyTM, a superhuman AI racing agent, was launched, marking a significant advancement in AI-powered gaming.
- February 2022: Nautilus Mobile secured a USD 5.4 Million investment, highlighting the growing interest in mobile gaming development, particularly in emerging markets.
Future Outlook for Gaming Simulators Market Market
The Gaming Simulators Market is poised for continued strong growth, driven by technological innovation, expanding accessibility, and the increasing popularity of gaming across diverse demographics. Strategic partnerships, acquisitions, and the development of innovative game concepts will be key to success in this dynamic market. The integration of cutting-edge technologies and the expansion into new markets will unlock significant future potential.
Gaming Simulators Market Segmentation
-
1. Type
- 1.1. Advertising
- 1.2. In-App Purchase
- 1.3. Paid App
Gaming Simulators Market Segmentation By Geography
- 1. North America
- 2. Europe
- 3. Asia
- 4. Middle East and Africa
- 5. Latin America
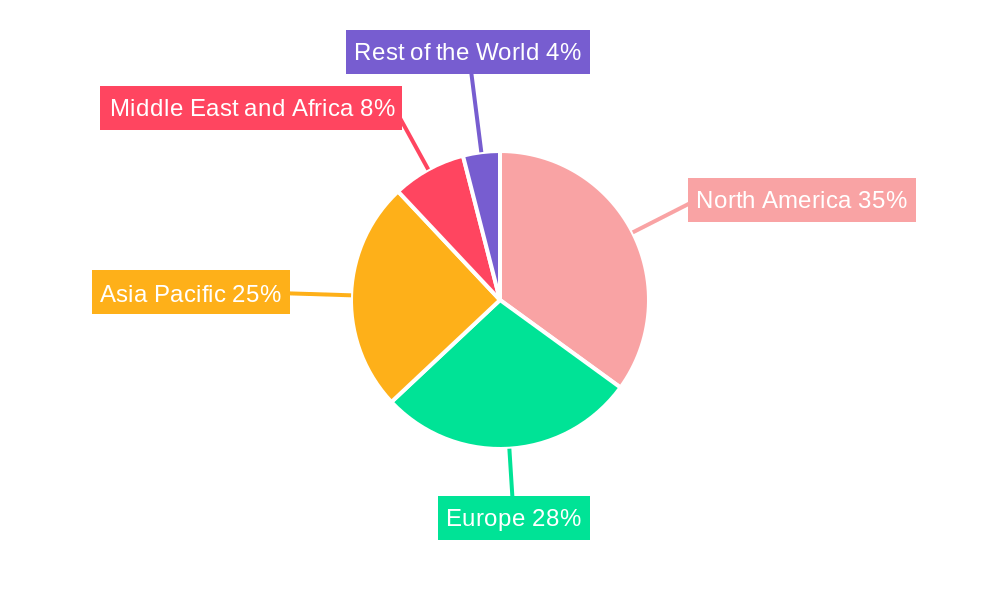
Gaming Simulators Market Regional Market Share
Geographic Coverage of Gaming Simulators Market
Gaming Simulators Market REPORT HIGHLIGHTS
| Aspects | Details |
|---|---|
| Study Period | 2020-2034 |
| Base Year | 2025 |
| Estimated Year | 2026 |
| Forecast Period | 2026-2034 |
| Historical Period | 2020-2025 |
| Growth Rate | CAGR of 13.49% from 2020-2034 |
| Segmentation |
|
Table of Contents
- 1. Introduction
- 1.1. Research Scope
- 1.2. Market Segmentation
- 1.3. Research Objective
- 1.4. Definitions and Assumptions
- 2. Executive Summary
- 2.1. Market Snapshot
- 3. Market Dynamics
- 3.1. Market Drivers
- 3.2. Market Restrains
- 3.3. Market Trends
- 3.4. Market Opportunities
- 4. Market Factor Analysis
- 4.1. Porters Five Forces
- 4.1.1. Bargaining Power of Suppliers
- 4.1.2. Bargaining Power of Buyers
- 4.1.3. Threat of New Entrants
- 4.1.4. Threat of Substitutes
- 4.1.5. Competitive Rivalry
- 4.2. PESTEL analysis
- 4.3. BCG Analysis
- 4.3.1. Stars (High Growth, High Market Share)
- 4.3.2. Cash Cows (Low Growth, High Market Share)
- 4.3.3. Question Mark (High Growth, Low Market Share)
- 4.3.4. Dogs (Low Growth, Low Market Share)
- 4.4. Ansoff Matrix Analysis
- 4.5. Supply Chain Analysis
- 4.6. Regulatory Landscape
- 4.7. Current Market Potential and Opportunity Assessment (TAM–SAM–SOM Framework)
- 4.8. PRI Analyst Note
- 4.1. Porters Five Forces
- 5. Market Analysis, Insights and Forecast 2021-2033
- 5.1. Market Analysis, Insights and Forecast - by Type
- 5.1.1. Advertising
- 5.1.2. In-App Purchase
- 5.1.3. Paid App
- 5.2. Market Analysis, Insights and Forecast - by Region
- 5.2.1. North America
- 5.2.2. Europe
- 5.2.3. Asia
- 5.2.4. Middle East and Africa
- 5.2.5. Latin America
- 5.1. Market Analysis, Insights and Forecast - by Type
- 6. Global Gaming Simulators Market Analysis, Insights and Forecast, 2021-2033
- 6.1. Market Analysis, Insights and Forecast - by Type
- 6.1.1. Advertising
- 6.1.2. In-App Purchase
- 6.1.3. Paid App
- 6.1. Market Analysis, Insights and Forecast - by Type
- 7. North America Gaming Simulators Market Analysis, Insights and Forecast, 2020-2032
- 7.1. Market Analysis, Insights and Forecast - by Type
- 7.1.1. Advertising
- 7.1.2. In-App Purchase
- 7.1.3. Paid App
- 7.1. Market Analysis, Insights and Forecast - by Type
- 8. Europe Gaming Simulators Market Analysis, Insights and Forecast, 2020-2032
- 8.1. Market Analysis, Insights and Forecast - by Type
- 8.1.1. Advertising
- 8.1.2. In-App Purchase
- 8.1.3. Paid App
- 8.1. Market Analysis, Insights and Forecast - by Type
- 9. Asia Gaming Simulators Market Analysis, Insights and Forecast, 2020-2032
- 9.1. Market Analysis, Insights and Forecast - by Type
- 9.1.1. Advertising
- 9.1.2. In-App Purchase
- 9.1.3. Paid App
- 9.1. Market Analysis, Insights and Forecast - by Type
- 10. Middle East and Africa Gaming Simulators Market Analysis, Insights and Forecast, 2020-2032
- 10.1. Market Analysis, Insights and Forecast - by Type
- 10.1.1. Advertising
- 10.1.2. In-App Purchase
- 10.1.3. Paid App
- 10.1. Market Analysis, Insights and Forecast - by Type
- 11. Latin America Gaming Simulators Market Analysis, Insights and Forecast, 2020-2032
- 11.1. Market Analysis, Insights and Forecast - by Type
- 11.1.1. Advertising
- 11.1.2. In-App Purchase
- 11.1.3. Paid App
- 11.1. Market Analysis, Insights and Forecast - by Type
- 12. Competitive Analysis
- 12.1. Company Profiles
- 12.1.1 Microsoft
- 12.1.1.1. Company Overview
- 12.1.1.2. Products
- 12.1.1.3. Company Financials
- 12.1.1.4. SWOT Analysis
- 12.1.2 Electronic Arts Inc
- 12.1.2.1. Company Overview
- 12.1.2.2. Products
- 12.1.2.3. Company Financials
- 12.1.2.4. SWOT Analysis
- 12.1.3 NetEase Inc
- 12.1.3.1. Company Overview
- 12.1.3.2. Products
- 12.1.3.3. Company Financials
- 12.1.3.4. SWOT Analysis
- 12.1.4 Nintendo
- 12.1.4.1. Company Overview
- 12.1.4.2. Products
- 12.1.4.3. Company Financials
- 12.1.4.4. SWOT Analysis
- 12.1.5 Sony Interactive Entertainment Inc
- 12.1.5.1. Company Overview
- 12.1.5.2. Products
- 12.1.5.3. Company Financials
- 12.1.5.4. SWOT Analysis
- 12.1.6 Activision Blizzard Inc
- 12.1.6.1. Company Overview
- 12.1.6.2. Products
- 12.1.6.3. Company Financials
- 12.1.6.4. SWOT Analysis
- 12.1.7 Tencent
- 12.1.7.1. Company Overview
- 12.1.7.2. Products
- 12.1.7.3. Company Financials
- 12.1.7.4. SWOT Analysis
- 12.1.8 Square Enix Co Ltd *List Not Exhaustive
- 12.1.8.1. Company Overview
- 12.1.8.2. Products
- 12.1.8.3. Company Financials
- 12.1.8.4. SWOT Analysis
- 12.1.9 Take-Two Interactive Software Inc
- 12.1.9.1. Company Overview
- 12.1.9.2. Products
- 12.1.9.3. Company Financials
- 12.1.9.4. SWOT Analysis
- 12.1.10 Bandai Namco Entertainment Inc
- 12.1.10.1. Company Overview
- 12.1.10.2. Products
- 12.1.10.3. Company Financials
- 12.1.10.4. SWOT Analysis
- 12.1.1 Microsoft
- 12.2. Market Entropy
- 12.2.1 Company's Key Areas Served
- 12.2.2 Recent Developments
- 12.3. Company Market Share Analysis 2025
- 12.3.1 Top 5 Companies Market Share Analysis
- 12.3.2 Top 3 Companies Market Share Analysis
- 12.4. List of Potential Customers
- 13. Research Methodology
List of Figures
- Figure 1: Global Gaming Simulators Market Revenue Breakdown (Million, %) by Region 2025 & 2033
- Figure 2: North America Gaming Simulators Market Revenue (Million), by Type 2025 & 2033
- Figure 3: North America Gaming Simulators Market Revenue Share (%), by Type 2025 & 2033
- Figure 4: North America Gaming Simulators Market Revenue (Million), by Country 2025 & 2033
- Figure 5: North America Gaming Simulators Market Revenue Share (%), by Country 2025 & 2033
- Figure 6: Europe Gaming Simulators Market Revenue (Million), by Type 2025 & 2033
- Figure 7: Europe Gaming Simulators Market Revenue Share (%), by Type 2025 & 2033
- Figure 8: Europe Gaming Simulators Market Revenue (Million), by Country 2025 & 2033
- Figure 9: Europe Gaming Simulators Market Revenue Share (%), by Country 2025 & 2033
- Figure 10: Asia Gaming Simulators Market Revenue (Million), by Type 2025 & 2033
- Figure 11: Asia Gaming Simulators Market Revenue Share (%), by Type 2025 & 2033
- Figure 12: Asia Gaming Simulators Market Revenue (Million), by Country 2025 & 2033
- Figure 13: Asia Gaming Simulators Market Revenue Share (%), by Country 2025 & 2033
- Figure 14: Middle East and Africa Gaming Simulators Market Revenue (Million), by Type 2025 & 2033
- Figure 15: Middle East and Africa Gaming Simulators Market Revenue Share (%), by Type 2025 & 2033
- Figure 16: Middle East and Africa Gaming Simulators Market Revenue (Million), by Country 2025 & 2033
- Figure 17: Middle East and Africa Gaming Simulators Market Revenue Share (%), by Country 2025 & 2033
- Figure 18: Latin America Gaming Simulators Market Revenue (Million), by Type 2025 & 2033
- Figure 19: Latin America Gaming Simulators Market Revenue Share (%), by Type 2025 & 2033
- Figure 20: Latin America Gaming Simulators Market Revenue (Million), by Country 2025 & 2033
- Figure 21: Latin America Gaming Simulators Market Revenue Share (%), by Country 2025 & 2033
List of Tables
- Table 1: Global Gaming Simulators Market Revenue Million Forecast, by Type 2020 & 2033
- Table 2: Global Gaming Simulators Market Revenue Million Forecast, by Region 2020 & 2033
- Table 3: Global Gaming Simulators Market Revenue Million Forecast, by Type 2020 & 2033
- Table 4: Global Gaming Simulators Market Revenue Million Forecast, by Country 2020 & 2033
- Table 5: Global Gaming Simulators Market Revenue Million Forecast, by Type 2020 & 2033
- Table 6: Global Gaming Simulators Market Revenue Million Forecast, by Country 2020 & 2033
- Table 7: Global Gaming Simulators Market Revenue Million Forecast, by Type 2020 & 2033
- Table 8: Global Gaming Simulators Market Revenue Million Forecast, by Country 2020 & 2033
- Table 9: Global Gaming Simulators Market Revenue Million Forecast, by Type 2020 & 2033
- Table 10: Global Gaming Simulators Market Revenue Million Forecast, by Country 2020 & 2033
- Table 11: Global Gaming Simulators Market Revenue Million Forecast, by Type 2020 & 2033
- Table 12: Global Gaming Simulators Market Revenue Million Forecast, by Country 2020 & 2033
Frequently Asked Questions
1. What is the projected Compound Annual Growth Rate (CAGR) of the Gaming Simulators Market?
The projected CAGR is approximately 13.49%.
2. Which companies are prominent players in the Gaming Simulators Market?
Key companies in the market include Microsoft, Electronic Arts Inc, NetEase Inc, Nintendo, Sony Interactive Entertainment Inc, Activision Blizzard Inc, Tencent, Square Enix Co Ltd *List Not Exhaustive, Take-Two Interactive Software Inc, Bandai Namco Entertainment Inc.
3. What are the main segments of the Gaming Simulators Market?
The market segments include Type.
4. Can you provide details about the market size?
The market size is estimated to be USD 8.14 Million as of 2022.
5. What are some drivers contributing to market growth?
Increased Adoption of Smartphones; Increased Utilization of Gaming Simulation for Training and Analysis Across a Variety of Fields; Growing Demand for VR Headsets.
6. What are the notable trends driving market growth?
Increased Adoption of Smartphones is Expected to Drive the Market Growth.
7. Are there any restraints impacting market growth?
Need for Expensive Graphic Cards.
8. Can you provide examples of recent developments in the market?
February 2022 - Gran Turismo SophyTM, the first superhuman AI agent to exceed the world's prominent drivers in the realistic PlayStation 4 racing simulation game Gran Turismo Sport, was announced by Polyphony Digital Inc. (PDI), and Sony Interactive Entertainment (SIE). Gamers all across the world will be able to access AI-powered gaming experiences delivered by GT Sophy.
9. What pricing options are available for accessing the report?
Pricing options include single-user, multi-user, and enterprise licenses priced at USD 4750, USD 5250, and USD 8750 respectively.
10. Is the market size provided in terms of value or volume?
The market size is provided in terms of value, measured in Million.
11. Are there any specific market keywords associated with the report?
Yes, the market keyword associated with the report is "Gaming Simulators Market," which aids in identifying and referencing the specific market segment covered.
12. How do I determine which pricing option suits my needs best?
The pricing options vary based on user requirements and access needs. Individual users may opt for single-user licenses, while businesses requiring broader access may choose multi-user or enterprise licenses for cost-effective access to the report.
13. Are there any additional resources or data provided in the Gaming Simulators Market report?
While the report offers comprehensive insights, it's advisable to review the specific contents or supplementary materials provided to ascertain if additional resources or data are available.
14. How can I stay updated on further developments or reports in the Gaming Simulators Market?
To stay informed about further developments, trends, and reports in the Gaming Simulators Market, consider subscribing to industry newsletters, following relevant companies and organizations, or regularly checking reputable industry news sources and publications.
Methodology
Step 1 - Identification of Relevant Samples Size from Population Database


Step 2 - Approaches for Defining Global Market Size (Value, Volume* & Price*)

Note*: In applicable scenarios
Step 3 - Data Sources
Primary Research
- Web Analytics
- Survey Reports
- Research Institute
- Latest Research Reports
- Opinion Leaders
Secondary Research
- Annual Reports
- White Paper
- Latest Press Release
- Industry Association
- Paid Database
- Investor Presentations

Step 4 - Data Triangulation
Involves using different sources of information in order to increase the validity of a study
These sources are likely to be stakeholders in a program - participants, other researchers, program staff, other community members, and so on.
Then we put all data in single framework & apply various statistical tools to find out the dynamic on the market.
During the analysis stage, feedback from the stakeholder groups would be compared to determine areas of agreement as well as areas of divergence