
Key Insights
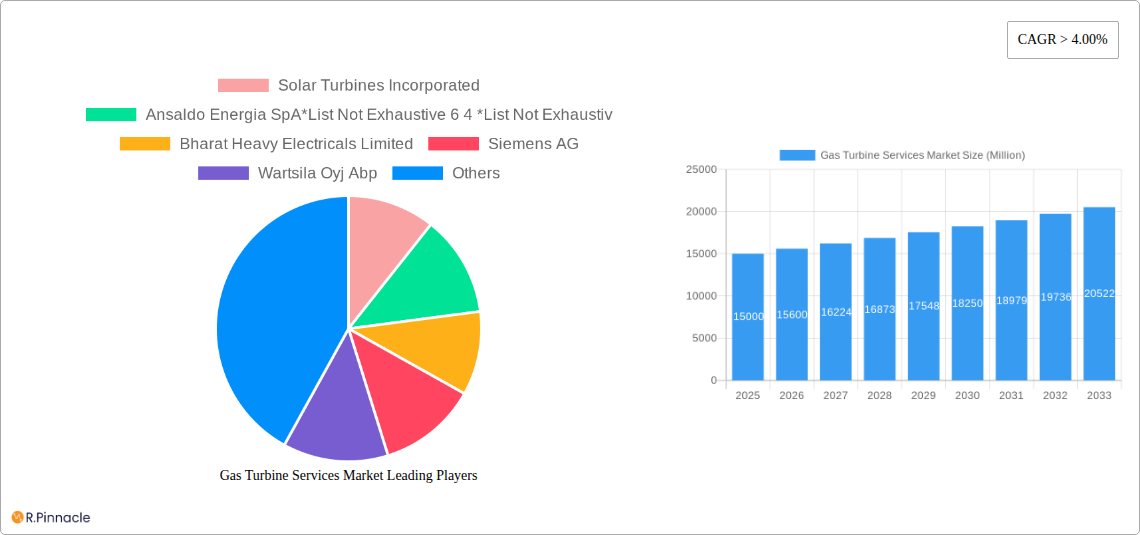
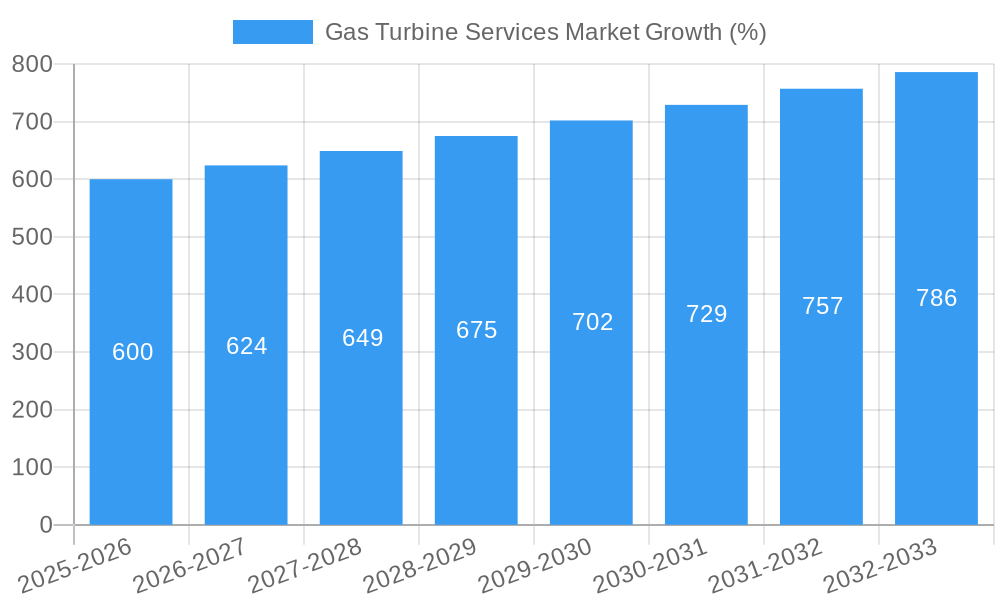
The global Gas Turbine Services market is experiencing robust growth, projected to maintain a Compound Annual Growth Rate (CAGR) exceeding 4.00% from 2025 to 2033. This expansion is fueled by several key drivers. Increasing demand for electricity, particularly in rapidly developing economies across Asia-Pacific and the Middle East, is a major catalyst. The aging global gas turbine fleet necessitates extensive maintenance, repairs, and upgrades, significantly contributing to market growth. Furthermore, stringent environmental regulations promoting cleaner energy solutions are driving the adoption of advanced gas turbine service technologies focused on efficiency and emissions reduction. The market segmentation reveals significant opportunities across various capacities (less than 30 MW, 31-120 MW, above 120 MW), types (combined cycle, open cycle), and end-user industries (power generation, oil and gas, and others). Leading players like General Electric, Siemens, and Mitsubishi Heavy Industries are leveraging their technological expertise and global reach to capture substantial market share. However, fluctuating fuel prices and potential economic downturns pose challenges to consistent market growth. The competitive landscape is characterized by intense rivalry among established players and emerging service providers, fostering innovation and driving down service costs.
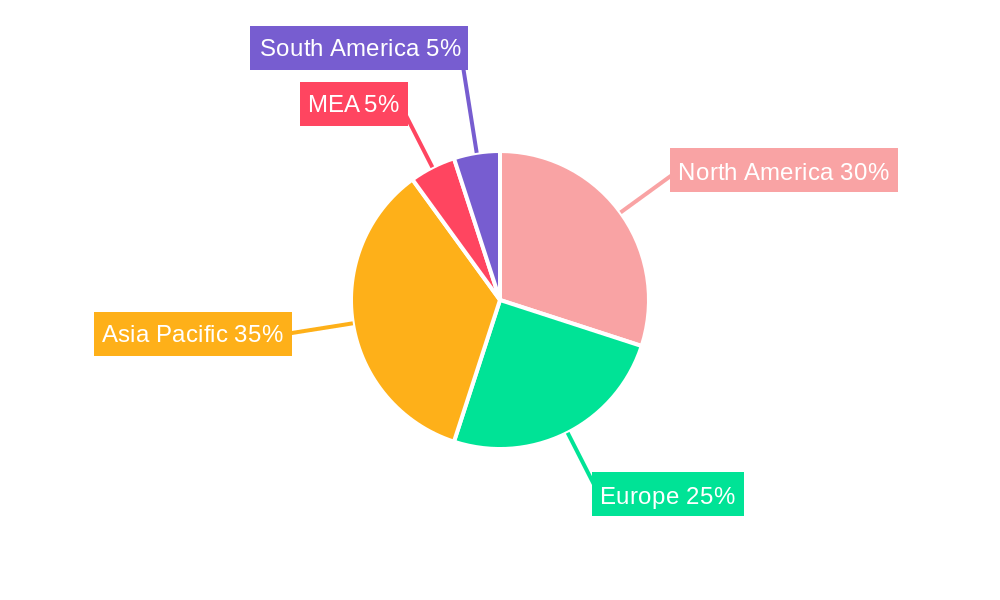
Geographical distribution shows a diverse market spread. North America, Europe, and Asia-Pacific represent the largest regional markets, with significant growth potential in emerging economies within Asia-Pacific and the Middle East and Africa (MEA) regions. The ongoing investments in renewable energy infrastructure alongside the persistent need for reliable baseload power generation further underpin the long-term growth prospects of the gas turbine services market. The market is expected to witness a gradual shift towards digitalization and predictive maintenance solutions, enhancing operational efficiency and minimizing downtime. This shift, coupled with the increasing adoption of advanced materials and manufacturing processes, will continue to shape the market's trajectory in the coming years.
Gas Turbine Services Market: A Comprehensive Report (2019-2033)
This in-depth report provides a comprehensive analysis of the Gas Turbine Services Market, offering actionable insights for industry professionals. The study covers the period 2019-2033, with 2025 as the base and estimated year, and forecasts extending to 2033. The report leverages a wealth of data to dissect market trends, segment performance, competitive dynamics, and future growth prospects. This analysis is crucial for stakeholders seeking to navigate the complexities of this evolving sector. The market is projected to reach xx Million by 2033.
Gas Turbine Services Market Structure & Innovation Trends
The Gas Turbine Services Market is characterized by a moderately consolidated structure, with key players like Solar Turbines Incorporated, Ansaldo Energia SpA, Bharat Heavy Electricals Limited, Siemens AG, Wartsila Oyj Abp, General Electric Company, Kawasaki Heavy Industries Ltd, IHI Corporation, and Mitsubishi Heavy Industries Ltd holding significant market share. However, the presence of numerous smaller players indicates a competitive landscape. Market share distribution amongst the top players is estimated to be approximately xx% in 2025, with a slight shift expected by 2033 due to M&A activities and technological advancements. Innovation is driven by the need for improved efficiency, reduced emissions, and enhanced durability. Regulatory frameworks, particularly those concerning emissions standards, significantly influence market dynamics. The market sees continuous technological innovation focused on digitalization, predictive maintenance, and the integration of renewable energy sources. The average value of M&A deals within the Gas Turbine Services Market in 2024 was approximately xx Million, indicating a robust level of consolidation. Substitutes for gas turbine services are limited, primarily involving alternative energy sources and other power generation technologies.
Gas Turbine Services Market Market Dynamics & Trends
The Gas Turbine Services Market is experiencing significant growth, driven primarily by the increasing demand for electricity globally, particularly in developing economies. This demand, coupled with the aging infrastructure of existing power plants, necessitates extensive maintenance and upgrades. Technological advancements such as digitalization and the Internet of Things (IoT) are improving efficiency and reducing downtime, furthering market expansion. The market's CAGR during the forecast period (2025-2033) is projected at xx%, indicating robust growth. Consumer preferences are shifting towards more sustainable and environmentally friendly solutions, prompting companies to develop eco-friendly services and technologies. Competitive dynamics are marked by intense rivalry among established players and the emergence of new entrants. Market penetration of advanced service offerings, such as predictive maintenance and remote diagnostics, is expected to reach xx% by 2033. The ongoing transition to cleaner energy sources is simultaneously a challenge and an opportunity, requiring adaptation and innovation within the industry.
Dominant Regions & Segments in Gas Turbine Services Market
The North American region currently dominates the Gas Turbine Services Market, driven by robust investments in infrastructure development and a large base of installed gas turbines. However, Asia-Pacific is projected to exhibit the highest growth rate during the forecast period, fueled by rapid industrialization and urbanization.
By Capacity: The 31-120 MW segment currently holds the largest market share, owing to its widespread application in power generation. However, the Above 120 MW segment is anticipated to witness significant growth in the coming years due to an increase in demand for high-capacity power plants.
By Type: The Combined Cycle segment leads the market, driven by its higher efficiency compared to Open Cycle systems. This trend is likely to continue as higher efficiency is increasingly valued.
By End-User Industry: The Power sector constitutes the largest end-user segment for gas turbine services, followed by the Oil and Gas sector. However, other end-user industries are gaining traction, presenting promising opportunities for future growth.
Key drivers in various regions include favorable government policies promoting energy infrastructure development, robust economic growth, and increasing energy demands.
Gas Turbine Services Market Product Innovations
Recent innovations in the Gas Turbine Services Market focus on digitalization, predictive maintenance, and the adoption of advanced materials to improve efficiency and reduce downtime. Remote diagnostics, AI-powered predictive analytics, and the integration of renewable energy sources are transforming the industry, resulting in more efficient and sustainable operations. These innovations offer significant competitive advantages, enabling companies to provide superior services and capture a larger market share. The incorporation of these technologies improves operational efficiency, optimizes maintenance schedules, and enhances overall cost-effectiveness.
Report Scope & Segmentation Analysis
This report provides a detailed segmentation analysis across several key parameters:
By Capacity: Less than 30 MW, 31-120 MW, Above 120 MW. The growth projections for each segment are outlined in the report, along with detailed market size estimations and competitive dynamics.
By Type: Combined Cycle and Open Cycle. The report meticulously analyzes each segment’s growth trajectories, identifying key factors contributing to their respective market shares.
By End-User Industry: Power, Oil and Gas, and Other End-user Industries. The competitive landscape is examined within each sector, highlighting the key players and their strategic initiatives.
Key Drivers of Gas Turbine Services Market Growth
The Gas Turbine Services Market's growth is primarily driven by the increasing global demand for electricity, coupled with the aging gas turbine infrastructure requiring regular maintenance and upgrades. Government regulations promoting cleaner energy and reduced emissions are also significant contributors. Technological advancements, including the adoption of digital technologies and advanced materials, enhance the efficiency and reliability of gas turbines, furthering market expansion. The significant investments in infrastructure projects across various regions worldwide contribute substantially to the growth of the gas turbine services sector.
Challenges in the Gas Turbine Services Market Sector
The Gas Turbine Services Market faces challenges such as fluctuating fuel prices, stringent environmental regulations, and increasing competition. Supply chain disruptions can impact the availability of spare parts and skilled labor, affecting service delivery and increasing costs. These issues can lead to delays in projects and increased operational expenses, negatively affecting market growth. Furthermore, the cyclical nature of the energy sector, along with price competition, adds to the overall pressure on market profitability.
Emerging Opportunities in Gas Turbine Services Market
Significant opportunities exist in the Gas Turbine Services Market through the adoption of digital technologies, predictive maintenance techniques, and the growing demand for renewable energy integration. Expansion into emerging economies offers substantial growth potential. The development of eco-friendly services and technologies, aligning with sustainable practices, creates new avenues for market penetration and growth. Focusing on innovative solutions that address the challenges of emissions reduction and enhance overall operational efficiency presents a strong pathway to success within this dynamic industry.
Leading Players in the Gas Turbine Services Market Market
- Solar Turbines Incorporated
- Ansaldo Energia SpA
- Bharat Heavy Electricals Limited
- Siemens AG
- Wartsila Oyj Abp
- General Electric Company
- Kawasaki Heavy Industries Ltd
- IHI Corporation
- Mitsubishi Heavy Industries Ltd
Key Developments in Gas Turbine Services Market Industry
- January 2023: Siemens AG launched a new digital platform for gas turbine diagnostics.
- March 2022: General Electric Company announced a strategic partnership to enhance gas turbine maintenance services.
- July 2021: Solar Turbines Incorporated introduced a new range of advanced gas turbine components. (Further key developments with dates will be added in the full report)
Future Outlook for Gas Turbine Services Market Market
The Gas Turbine Services Market is poised for continued growth driven by rising global energy demand, the need for efficient and sustainable solutions, and ongoing technological advancements. Strategic opportunities abound for companies that invest in digitalization, predictive maintenance, and environmentally conscious practices. The expansion into emerging markets and the development of innovative service offerings will play a pivotal role in shaping the future of this dynamic sector. The market is expected to witness a robust growth trajectory throughout the forecast period.
Gas Turbine Services Market Segmentation
-
1. Capacity
- 1.1. Less than 30 MW
- 1.2. 31-120 MW
- 1.3. Above 120 MW
-
2. Type
- 2.1. Combined Cycle
- 2.2. Open Cycle
-
3. End-User Industry
- 3.1. Power
- 3.2. Oil and Gas
- 3.3. Other End-user Industries
Gas Turbine Services Market Segmentation By Geography
- 1. Asia Pacific
- 2. North America
- 3. Europe
- 4. South America
- 5. Middle East and Africa
Gas Turbine Services Market REPORT HIGHLIGHTS
| Aspects | Details |
|---|---|
| Study Period | 2019-2033 |
| Base Year | 2024 |
| Estimated Year | 2025 |
| Forecast Period | 2025-2033 |
| Historical Period | 2019-2024 |
| Growth Rate | CAGR of > 4.00% from 2019-2033 |
| Segmentation |
|
Table of Contents
- 1. Introduction
- 1.1. Research Scope
- 1.2. Market Segmentation
- 1.3. Research Methodology
- 1.4. Definitions and Assumptions
- 2. Executive Summary
- 2.1. Introduction
- 3. Market Dynamics
- 3.1. Introduction
- 3.2. Market Drivers
- 3.2.1. 4.; Rising Power Demand4.; Substantial Investments And Efforts To Modernize The T&D Grid
- 3.3. Market Restrains
- 3.3.1. 4.; Rising Distributed Energy Generation
- 3.4. Market Trends
- 3.4.1. Power Sector is Expected to Dominate the Market
- 4. Market Factor Analysis
- 4.1. Porters Five Forces
- 4.2. Supply/Value Chain
- 4.3. PESTEL analysis
- 4.4. Market Entropy
- 4.5. Patent/Trademark Analysis
- 5. Global Gas Turbine Services Market Analysis, Insights and Forecast, 2019-2031
- 5.1. Market Analysis, Insights and Forecast - by Capacity
- 5.1.1. Less than 30 MW
- 5.1.2. 31-120 MW
- 5.1.3. Above 120 MW
- 5.2. Market Analysis, Insights and Forecast - by Type
- 5.2.1. Combined Cycle
- 5.2.2. Open Cycle
- 5.3. Market Analysis, Insights and Forecast - by End-User Industry
- 5.3.1. Power
- 5.3.2. Oil and Gas
- 5.3.3. Other End-user Industries
- 5.4. Market Analysis, Insights and Forecast - by Region
- 5.4.1. Asia Pacific
- 5.4.2. North America
- 5.4.3. Europe
- 5.4.4. South America
- 5.4.5. Middle East and Africa
- 5.1. Market Analysis, Insights and Forecast - by Capacity
- 6. Asia Pacific Gas Turbine Services Market Analysis, Insights and Forecast, 2019-2031
- 6.1. Market Analysis, Insights and Forecast - by Capacity
- 6.1.1. Less than 30 MW
- 6.1.2. 31-120 MW
- 6.1.3. Above 120 MW
- 6.2. Market Analysis, Insights and Forecast - by Type
- 6.2.1. Combined Cycle
- 6.2.2. Open Cycle
- 6.3. Market Analysis, Insights and Forecast - by End-User Industry
- 6.3.1. Power
- 6.3.2. Oil and Gas
- 6.3.3. Other End-user Industries
- 6.1. Market Analysis, Insights and Forecast - by Capacity
- 7. North America Gas Turbine Services Market Analysis, Insights and Forecast, 2019-2031
- 7.1. Market Analysis, Insights and Forecast - by Capacity
- 7.1.1. Less than 30 MW
- 7.1.2. 31-120 MW
- 7.1.3. Above 120 MW
- 7.2. Market Analysis, Insights and Forecast - by Type
- 7.2.1. Combined Cycle
- 7.2.2. Open Cycle
- 7.3. Market Analysis, Insights and Forecast - by End-User Industry
- 7.3.1. Power
- 7.3.2. Oil and Gas
- 7.3.3. Other End-user Industries
- 7.1. Market Analysis, Insights and Forecast - by Capacity
- 8. Europe Gas Turbine Services Market Analysis, Insights and Forecast, 2019-2031
- 8.1. Market Analysis, Insights and Forecast - by Capacity
- 8.1.1. Less than 30 MW
- 8.1.2. 31-120 MW
- 8.1.3. Above 120 MW
- 8.2. Market Analysis, Insights and Forecast - by Type
- 8.2.1. Combined Cycle
- 8.2.2. Open Cycle
- 8.3. Market Analysis, Insights and Forecast - by End-User Industry
- 8.3.1. Power
- 8.3.2. Oil and Gas
- 8.3.3. Other End-user Industries
- 8.1. Market Analysis, Insights and Forecast - by Capacity
- 9. South America Gas Turbine Services Market Analysis, Insights and Forecast, 2019-2031
- 9.1. Market Analysis, Insights and Forecast - by Capacity
- 9.1.1. Less than 30 MW
- 9.1.2. 31-120 MW
- 9.1.3. Above 120 MW
- 9.2. Market Analysis, Insights and Forecast - by Type
- 9.2.1. Combined Cycle
- 9.2.2. Open Cycle
- 9.3. Market Analysis, Insights and Forecast - by End-User Industry
- 9.3.1. Power
- 9.3.2. Oil and Gas
- 9.3.3. Other End-user Industries
- 9.1. Market Analysis, Insights and Forecast - by Capacity
- 10. Middle East and Africa Gas Turbine Services Market Analysis, Insights and Forecast, 2019-2031
- 10.1. Market Analysis, Insights and Forecast - by Capacity
- 10.1.1. Less than 30 MW
- 10.1.2. 31-120 MW
- 10.1.3. Above 120 MW
- 10.2. Market Analysis, Insights and Forecast - by Type
- 10.2.1. Combined Cycle
- 10.2.2. Open Cycle
- 10.3. Market Analysis, Insights and Forecast - by End-User Industry
- 10.3.1. Power
- 10.3.2. Oil and Gas
- 10.3.3. Other End-user Industries
- 10.1. Market Analysis, Insights and Forecast - by Capacity
- 11. North America Gas Turbine Services Market Analysis, Insights and Forecast, 2019-2031
- 11.1. Market Analysis, Insights and Forecast - By Country/Sub-region
- 11.1.1 United States
- 11.1.2 Canada
- 11.1.3 Mexico
- 12. Europe Gas Turbine Services Market Analysis, Insights and Forecast, 2019-2031
- 12.1. Market Analysis, Insights and Forecast - By Country/Sub-region
- 12.1.1 Germany
- 12.1.2 United Kingdom
- 12.1.3 France
- 12.1.4 Spain
- 12.1.5 Italy
- 12.1.6 Spain
- 12.1.7 Belgium
- 12.1.8 Netherland
- 12.1.9 Nordics
- 12.1.10 Rest of Europe
- 13. Asia Pacific Gas Turbine Services Market Analysis, Insights and Forecast, 2019-2031
- 13.1. Market Analysis, Insights and Forecast - By Country/Sub-region
- 13.1.1 China
- 13.1.2 Japan
- 13.1.3 India
- 13.1.4 South Korea
- 13.1.5 Southeast Asia
- 13.1.6 Australia
- 13.1.7 Indonesia
- 13.1.8 Phillipes
- 13.1.9 Singapore
- 13.1.10 Thailandc
- 13.1.11 Rest of Asia Pacific
- 14. South America Gas Turbine Services Market Analysis, Insights and Forecast, 2019-2031
- 14.1. Market Analysis, Insights and Forecast - By Country/Sub-region
- 14.1.1 Brazil
- 14.1.2 Argentina
- 14.1.3 Peru
- 14.1.4 Chile
- 14.1.5 Colombia
- 14.1.6 Ecuador
- 14.1.7 Venezuela
- 14.1.8 Rest of South America
- 15. North America Gas Turbine Services Market Analysis, Insights and Forecast, 2019-2031
- 15.1. Market Analysis, Insights and Forecast - By Country/Sub-region
- 15.1.1 United States
- 15.1.2 Canada
- 15.1.3 Mexico
- 16. MEA Gas Turbine Services Market Analysis, Insights and Forecast, 2019-2031
- 16.1. Market Analysis, Insights and Forecast - By Country/Sub-region
- 16.1.1 United Arab Emirates
- 16.1.2 Saudi Arabia
- 16.1.3 South Africa
- 16.1.4 Rest of Middle East and Africa
- 17. Competitive Analysis
- 17.1. Global Market Share Analysis 2024
- 17.2. Company Profiles
- 17.2.1 Solar Turbines Incorporated
- 17.2.1.1. Overview
- 17.2.1.2. Products
- 17.2.1.3. SWOT Analysis
- 17.2.1.4. Recent Developments
- 17.2.1.5. Financials (Based on Availability)
- 17.2.2 Ansaldo Energia SpA*List Not Exhaustive 6 4 *List Not Exhaustiv
- 17.2.2.1. Overview
- 17.2.2.2. Products
- 17.2.2.3. SWOT Analysis
- 17.2.2.4. Recent Developments
- 17.2.2.5. Financials (Based on Availability)
- 17.2.3 Bharat Heavy Electricals Limited
- 17.2.3.1. Overview
- 17.2.3.2. Products
- 17.2.3.3. SWOT Analysis
- 17.2.3.4. Recent Developments
- 17.2.3.5. Financials (Based on Availability)
- 17.2.4 Siemens AG
- 17.2.4.1. Overview
- 17.2.4.2. Products
- 17.2.4.3. SWOT Analysis
- 17.2.4.4. Recent Developments
- 17.2.4.5. Financials (Based on Availability)
- 17.2.5 Wartsila Oyj Abp
- 17.2.5.1. Overview
- 17.2.5.2. Products
- 17.2.5.3. SWOT Analysis
- 17.2.5.4. Recent Developments
- 17.2.5.5. Financials (Based on Availability)
- 17.2.6 General Electric Company
- 17.2.6.1. Overview
- 17.2.6.2. Products
- 17.2.6.3. SWOT Analysis
- 17.2.6.4. Recent Developments
- 17.2.6.5. Financials (Based on Availability)
- 17.2.7 Kawasaki Heavy Industries Ltd
- 17.2.7.1. Overview
- 17.2.7.2. Products
- 17.2.7.3. SWOT Analysis
- 17.2.7.4. Recent Developments
- 17.2.7.5. Financials (Based on Availability)
- 17.2.8 IHI Corporation
- 17.2.8.1. Overview
- 17.2.8.2. Products
- 17.2.8.3. SWOT Analysis
- 17.2.8.4. Recent Developments
- 17.2.8.5. Financials (Based on Availability)
- 17.2.9 Mitsubishi Heavy Industries Ltd
- 17.2.9.1. Overview
- 17.2.9.2. Products
- 17.2.9.3. SWOT Analysis
- 17.2.9.4. Recent Developments
- 17.2.9.5. Financials (Based on Availability)
- 17.2.1 Solar Turbines Incorporated
List of Figures
- Figure 1: Global Gas Turbine Services Market Revenue Breakdown (Million, %) by Region 2024 & 2032
- Figure 2: North America Gas Turbine Services Market Revenue (Million), by Country 2024 & 2032
- Figure 3: North America Gas Turbine Services Market Revenue Share (%), by Country 2024 & 2032
- Figure 4: Europe Gas Turbine Services Market Revenue (Million), by Country 2024 & 2032
- Figure 5: Europe Gas Turbine Services Market Revenue Share (%), by Country 2024 & 2032
- Figure 6: Asia Pacific Gas Turbine Services Market Revenue (Million), by Country 2024 & 2032
- Figure 7: Asia Pacific Gas Turbine Services Market Revenue Share (%), by Country 2024 & 2032
- Figure 8: South America Gas Turbine Services Market Revenue (Million), by Country 2024 & 2032
- Figure 9: South America Gas Turbine Services Market Revenue Share (%), by Country 2024 & 2032
- Figure 10: North America Gas Turbine Services Market Revenue (Million), by Country 2024 & 2032
- Figure 11: North America Gas Turbine Services Market Revenue Share (%), by Country 2024 & 2032
- Figure 12: MEA Gas Turbine Services Market Revenue (Million), by Country 2024 & 2032
- Figure 13: MEA Gas Turbine Services Market Revenue Share (%), by Country 2024 & 2032
- Figure 14: Asia Pacific Gas Turbine Services Market Revenue (Million), by Capacity 2024 & 2032
- Figure 15: Asia Pacific Gas Turbine Services Market Revenue Share (%), by Capacity 2024 & 2032
- Figure 16: Asia Pacific Gas Turbine Services Market Revenue (Million), by Type 2024 & 2032
- Figure 17: Asia Pacific Gas Turbine Services Market Revenue Share (%), by Type 2024 & 2032
- Figure 18: Asia Pacific Gas Turbine Services Market Revenue (Million), by End-User Industry 2024 & 2032
- Figure 19: Asia Pacific Gas Turbine Services Market Revenue Share (%), by End-User Industry 2024 & 2032
- Figure 20: Asia Pacific Gas Turbine Services Market Revenue (Million), by Country 2024 & 2032
- Figure 21: Asia Pacific Gas Turbine Services Market Revenue Share (%), by Country 2024 & 2032
- Figure 22: North America Gas Turbine Services Market Revenue (Million), by Capacity 2024 & 2032
- Figure 23: North America Gas Turbine Services Market Revenue Share (%), by Capacity 2024 & 2032
- Figure 24: North America Gas Turbine Services Market Revenue (Million), by Type 2024 & 2032
- Figure 25: North America Gas Turbine Services Market Revenue Share (%), by Type 2024 & 2032
- Figure 26: North America Gas Turbine Services Market Revenue (Million), by End-User Industry 2024 & 2032
- Figure 27: North America Gas Turbine Services Market Revenue Share (%), by End-User Industry 2024 & 2032
- Figure 28: North America Gas Turbine Services Market Revenue (Million), by Country 2024 & 2032
- Figure 29: North America Gas Turbine Services Market Revenue Share (%), by Country 2024 & 2032
- Figure 30: Europe Gas Turbine Services Market Revenue (Million), by Capacity 2024 & 2032
- Figure 31: Europe Gas Turbine Services Market Revenue Share (%), by Capacity 2024 & 2032
- Figure 32: Europe Gas Turbine Services Market Revenue (Million), by Type 2024 & 2032
- Figure 33: Europe Gas Turbine Services Market Revenue Share (%), by Type 2024 & 2032
- Figure 34: Europe Gas Turbine Services Market Revenue (Million), by End-User Industry 2024 & 2032
- Figure 35: Europe Gas Turbine Services Market Revenue Share (%), by End-User Industry 2024 & 2032
- Figure 36: Europe Gas Turbine Services Market Revenue (Million), by Country 2024 & 2032
- Figure 37: Europe Gas Turbine Services Market Revenue Share (%), by Country 2024 & 2032
- Figure 38: South America Gas Turbine Services Market Revenue (Million), by Capacity 2024 & 2032
- Figure 39: South America Gas Turbine Services Market Revenue Share (%), by Capacity 2024 & 2032
- Figure 40: South America Gas Turbine Services Market Revenue (Million), by Type 2024 & 2032
- Figure 41: South America Gas Turbine Services Market Revenue Share (%), by Type 2024 & 2032
- Figure 42: South America Gas Turbine Services Market Revenue (Million), by End-User Industry 2024 & 2032
- Figure 43: South America Gas Turbine Services Market Revenue Share (%), by End-User Industry 2024 & 2032
- Figure 44: South America Gas Turbine Services Market Revenue (Million), by Country 2024 & 2032
- Figure 45: South America Gas Turbine Services Market Revenue Share (%), by Country 2024 & 2032
- Figure 46: Middle East and Africa Gas Turbine Services Market Revenue (Million), by Capacity 2024 & 2032
- Figure 47: Middle East and Africa Gas Turbine Services Market Revenue Share (%), by Capacity 2024 & 2032
- Figure 48: Middle East and Africa Gas Turbine Services Market Revenue (Million), by Type 2024 & 2032
- Figure 49: Middle East and Africa Gas Turbine Services Market Revenue Share (%), by Type 2024 & 2032
- Figure 50: Middle East and Africa Gas Turbine Services Market Revenue (Million), by End-User Industry 2024 & 2032
- Figure 51: Middle East and Africa Gas Turbine Services Market Revenue Share (%), by End-User Industry 2024 & 2032
- Figure 52: Middle East and Africa Gas Turbine Services Market Revenue (Million), by Country 2024 & 2032
- Figure 53: Middle East and Africa Gas Turbine Services Market Revenue Share (%), by Country 2024 & 2032
List of Tables
- Table 1: Global Gas Turbine Services Market Revenue Million Forecast, by Region 2019 & 2032
- Table 2: Global Gas Turbine Services Market Revenue Million Forecast, by Capacity 2019 & 2032
- Table 3: Global Gas Turbine Services Market Revenue Million Forecast, by Type 2019 & 2032
- Table 4: Global Gas Turbine Services Market Revenue Million Forecast, by End-User Industry 2019 & 2032
- Table 5: Global Gas Turbine Services Market Revenue Million Forecast, by Region 2019 & 2032
- Table 6: Global Gas Turbine Services Market Revenue Million Forecast, by Country 2019 & 2032
- Table 7: United States Gas Turbine Services Market Revenue (Million) Forecast, by Application 2019 & 2032
- Table 8: Canada Gas Turbine Services Market Revenue (Million) Forecast, by Application 2019 & 2032
- Table 9: Mexico Gas Turbine Services Market Revenue (Million) Forecast, by Application 2019 & 2032
- Table 10: Global Gas Turbine Services Market Revenue Million Forecast, by Country 2019 & 2032
- Table 11: Germany Gas Turbine Services Market Revenue (Million) Forecast, by Application 2019 & 2032
- Table 12: United Kingdom Gas Turbine Services Market Revenue (Million) Forecast, by Application 2019 & 2032
- Table 13: France Gas Turbine Services Market Revenue (Million) Forecast, by Application 2019 & 2032
- Table 14: Spain Gas Turbine Services Market Revenue (Million) Forecast, by Application 2019 & 2032
- Table 15: Italy Gas Turbine Services Market Revenue (Million) Forecast, by Application 2019 & 2032
- Table 16: Spain Gas Turbine Services Market Revenue (Million) Forecast, by Application 2019 & 2032
- Table 17: Belgium Gas Turbine Services Market Revenue (Million) Forecast, by Application 2019 & 2032
- Table 18: Netherland Gas Turbine Services Market Revenue (Million) Forecast, by Application 2019 & 2032
- Table 19: Nordics Gas Turbine Services Market Revenue (Million) Forecast, by Application 2019 & 2032
- Table 20: Rest of Europe Gas Turbine Services Market Revenue (Million) Forecast, by Application 2019 & 2032
- Table 21: Global Gas Turbine Services Market Revenue Million Forecast, by Country 2019 & 2032
- Table 22: China Gas Turbine Services Market Revenue (Million) Forecast, by Application 2019 & 2032
- Table 23: Japan Gas Turbine Services Market Revenue (Million) Forecast, by Application 2019 & 2032
- Table 24: India Gas Turbine Services Market Revenue (Million) Forecast, by Application 2019 & 2032
- Table 25: South Korea Gas Turbine Services Market Revenue (Million) Forecast, by Application 2019 & 2032
- Table 26: Southeast Asia Gas Turbine Services Market Revenue (Million) Forecast, by Application 2019 & 2032
- Table 27: Australia Gas Turbine Services Market Revenue (Million) Forecast, by Application 2019 & 2032
- Table 28: Indonesia Gas Turbine Services Market Revenue (Million) Forecast, by Application 2019 & 2032
- Table 29: Phillipes Gas Turbine Services Market Revenue (Million) Forecast, by Application 2019 & 2032
- Table 30: Singapore Gas Turbine Services Market Revenue (Million) Forecast, by Application 2019 & 2032
- Table 31: Thailandc Gas Turbine Services Market Revenue (Million) Forecast, by Application 2019 & 2032
- Table 32: Rest of Asia Pacific Gas Turbine Services Market Revenue (Million) Forecast, by Application 2019 & 2032
- Table 33: Global Gas Turbine Services Market Revenue Million Forecast, by Country 2019 & 2032
- Table 34: Brazil Gas Turbine Services Market Revenue (Million) Forecast, by Application 2019 & 2032
- Table 35: Argentina Gas Turbine Services Market Revenue (Million) Forecast, by Application 2019 & 2032
- Table 36: Peru Gas Turbine Services Market Revenue (Million) Forecast, by Application 2019 & 2032
- Table 37: Chile Gas Turbine Services Market Revenue (Million) Forecast, by Application 2019 & 2032
- Table 38: Colombia Gas Turbine Services Market Revenue (Million) Forecast, by Application 2019 & 2032
- Table 39: Ecuador Gas Turbine Services Market Revenue (Million) Forecast, by Application 2019 & 2032
- Table 40: Venezuela Gas Turbine Services Market Revenue (Million) Forecast, by Application 2019 & 2032
- Table 41: Rest of South America Gas Turbine Services Market Revenue (Million) Forecast, by Application 2019 & 2032
- Table 42: Global Gas Turbine Services Market Revenue Million Forecast, by Country 2019 & 2032
- Table 43: United States Gas Turbine Services Market Revenue (Million) Forecast, by Application 2019 & 2032
- Table 44: Canada Gas Turbine Services Market Revenue (Million) Forecast, by Application 2019 & 2032
- Table 45: Mexico Gas Turbine Services Market Revenue (Million) Forecast, by Application 2019 & 2032
- Table 46: Global Gas Turbine Services Market Revenue Million Forecast, by Country 2019 & 2032
- Table 47: United Arab Emirates Gas Turbine Services Market Revenue (Million) Forecast, by Application 2019 & 2032
- Table 48: Saudi Arabia Gas Turbine Services Market Revenue (Million) Forecast, by Application 2019 & 2032
- Table 49: South Africa Gas Turbine Services Market Revenue (Million) Forecast, by Application 2019 & 2032
- Table 50: Rest of Middle East and Africa Gas Turbine Services Market Revenue (Million) Forecast, by Application 2019 & 2032
- Table 51: Global Gas Turbine Services Market Revenue Million Forecast, by Capacity 2019 & 2032
- Table 52: Global Gas Turbine Services Market Revenue Million Forecast, by Type 2019 & 2032
- Table 53: Global Gas Turbine Services Market Revenue Million Forecast, by End-User Industry 2019 & 2032
- Table 54: Global Gas Turbine Services Market Revenue Million Forecast, by Country 2019 & 2032
- Table 55: Global Gas Turbine Services Market Revenue Million Forecast, by Capacity 2019 & 2032
- Table 56: Global Gas Turbine Services Market Revenue Million Forecast, by Type 2019 & 2032
- Table 57: Global Gas Turbine Services Market Revenue Million Forecast, by End-User Industry 2019 & 2032
- Table 58: Global Gas Turbine Services Market Revenue Million Forecast, by Country 2019 & 2032
- Table 59: Global Gas Turbine Services Market Revenue Million Forecast, by Capacity 2019 & 2032
- Table 60: Global Gas Turbine Services Market Revenue Million Forecast, by Type 2019 & 2032
- Table 61: Global Gas Turbine Services Market Revenue Million Forecast, by End-User Industry 2019 & 2032
- Table 62: Global Gas Turbine Services Market Revenue Million Forecast, by Country 2019 & 2032
- Table 63: Global Gas Turbine Services Market Revenue Million Forecast, by Capacity 2019 & 2032
- Table 64: Global Gas Turbine Services Market Revenue Million Forecast, by Type 2019 & 2032
- Table 65: Global Gas Turbine Services Market Revenue Million Forecast, by End-User Industry 2019 & 2032
- Table 66: Global Gas Turbine Services Market Revenue Million Forecast, by Country 2019 & 2032
- Table 67: Global Gas Turbine Services Market Revenue Million Forecast, by Capacity 2019 & 2032
- Table 68: Global Gas Turbine Services Market Revenue Million Forecast, by Type 2019 & 2032
- Table 69: Global Gas Turbine Services Market Revenue Million Forecast, by End-User Industry 2019 & 2032
- Table 70: Global Gas Turbine Services Market Revenue Million Forecast, by Country 2019 & 2032
Frequently Asked Questions
1. What is the projected Compound Annual Growth Rate (CAGR) of the Gas Turbine Services Market?
The projected CAGR is approximately > 4.00%.
2. Which companies are prominent players in the Gas Turbine Services Market?
Key companies in the market include Solar Turbines Incorporated, Ansaldo Energia SpA*List Not Exhaustive 6 4 *List Not Exhaustiv, Bharat Heavy Electricals Limited, Siemens AG, Wartsila Oyj Abp, General Electric Company, Kawasaki Heavy Industries Ltd, IHI Corporation, Mitsubishi Heavy Industries Ltd.
3. What are the main segments of the Gas Turbine Services Market?
The market segments include Capacity, Type, End-User Industry.
4. Can you provide details about the market size?
The market size is estimated to be USD XX Million as of 2022.
5. What are some drivers contributing to market growth?
4.; Rising Power Demand4.; Substantial Investments And Efforts To Modernize The T&D Grid.
6. What are the notable trends driving market growth?
Power Sector is Expected to Dominate the Market.
7. Are there any restraints impacting market growth?
4.; Rising Distributed Energy Generation.
8. Can you provide examples of recent developments in the market?
N/A
9. What pricing options are available for accessing the report?
Pricing options include single-user, multi-user, and enterprise licenses priced at USD 4750, USD 5250, and USD 8750 respectively.
10. Is the market size provided in terms of value or volume?
The market size is provided in terms of value, measured in Million.
11. Are there any specific market keywords associated with the report?
Yes, the market keyword associated with the report is "Gas Turbine Services Market," which aids in identifying and referencing the specific market segment covered.
12. How do I determine which pricing option suits my needs best?
The pricing options vary based on user requirements and access needs. Individual users may opt for single-user licenses, while businesses requiring broader access may choose multi-user or enterprise licenses for cost-effective access to the report.
13. Are there any additional resources or data provided in the Gas Turbine Services Market report?
While the report offers comprehensive insights, it's advisable to review the specific contents or supplementary materials provided to ascertain if additional resources or data are available.
14. How can I stay updated on further developments or reports in the Gas Turbine Services Market?
To stay informed about further developments, trends, and reports in the Gas Turbine Services Market, consider subscribing to industry newsletters, following relevant companies and organizations, or regularly checking reputable industry news sources and publications.
Methodology
Step 1 - Identification of Relevant Samples Size from Population Database


Step 2 - Approaches for Defining Global Market Size (Value, Volume* & Price*)

Note*: In applicable scenarios
Step 3 - Data Sources
Primary Research
- Web Analytics
- Survey Reports
- Research Institute
- Latest Research Reports
- Opinion Leaders
Secondary Research
- Annual Reports
- White Paper
- Latest Press Release
- Industry Association
- Paid Database
- Investor Presentations

Step 4 - Data Triangulation
Involves using different sources of information in order to increase the validity of a study
These sources are likely to be stakeholders in a program - participants, other researchers, program staff, other community members, and so on.
Then we put all data in single framework & apply various statistical tools to find out the dynamic on the market.
During the analysis stage, feedback from the stakeholder groups would be compared to determine areas of agreement as well as areas of divergence


