
Key Insights
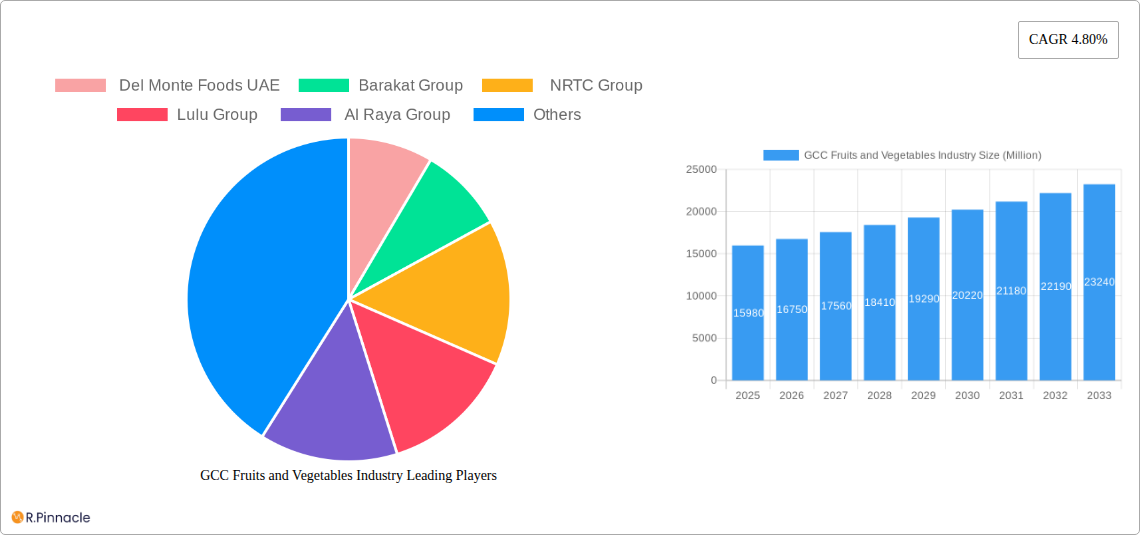
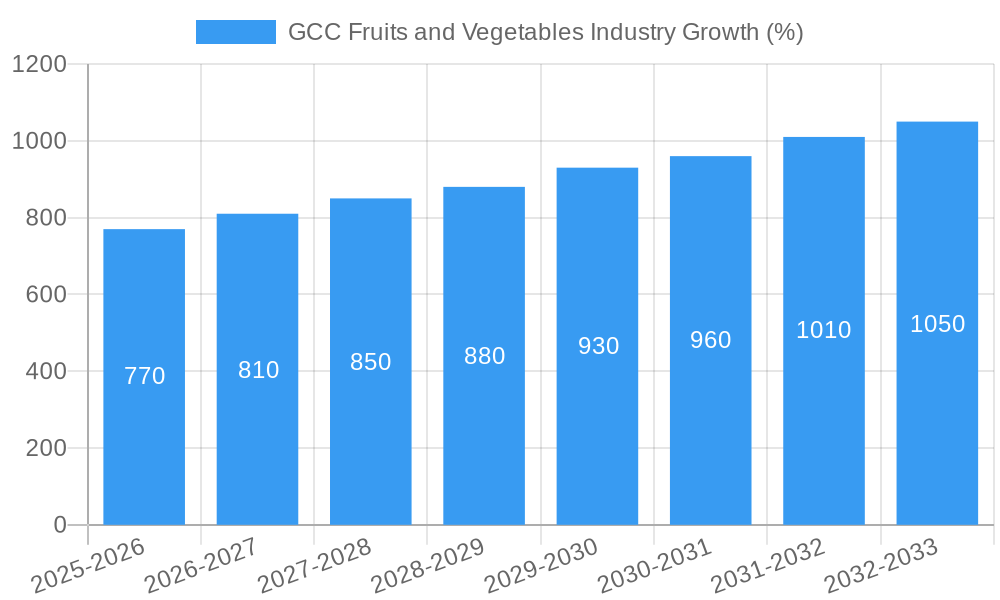
The GCC fruits and vegetables market, valued at $15.98 billion in 2025, is experiencing robust growth, projected to expand at a CAGR of 4.80% from 2025 to 2033. This growth is fueled by several key factors. Increasing health consciousness among consumers is driving demand for fresh produce, while the region's burgeoning population and rising disposable incomes further bolster market expansion. The shift towards convenient and healthier lifestyles is boosting the demand for processed fruits and vegetables, particularly within the rapidly expanding food processing and restaurant sectors. E-commerce platforms are also playing a significant role, offering consumers greater accessibility and convenience in purchasing fresh produce. Supermarkets and hypermarkets remain the dominant distribution channels, but traditional markets and wholesale channels still hold considerable market share, particularly in catering to specific consumer segments and local preferences. However, challenges remain, including fluctuating prices due to seasonal variations and global supply chain disruptions, along with the need for improved cold chain infrastructure to minimize post-harvest losses. Competition is intense, with both local players like Al-Futtaim Group and Barakat Group, and international brands like Del Monte Foods UAE and Carrefour vying for market share. The market segmentation reveals the dominance of fresh produce (fruits and vegetables), underscoring the consumer preference for natural and minimally processed foods.
Looking ahead, the GCC fruits and vegetables market is poised for continued expansion, driven by strategic investments in agricultural infrastructure, technological advancements in farming and processing techniques, and the growing popularity of healthy eating trends. The market's future trajectory will depend heavily on successfully addressing the challenges of maintaining consistent supply, improving cold chain logistics, and adapting to evolving consumer preferences. This will necessitate investments in sustainable agricultural practices, advanced food processing technologies, and efficient distribution networks. The strategic alliances between retailers and producers will also be crucial in optimizing the supply chain and ensuring access to fresh, high-quality produce for consumers across the GCC. The focus on value-added products and innovative packaging solutions are likely to be prominent strategies employed by market players to enhance product appeal and shelf life.
GCC Fruits and Vegetables Industry: A Comprehensive Market Report (2019-2033)
This in-depth report provides a comprehensive analysis of the GCC fruits and vegetables industry, offering invaluable insights for industry professionals, investors, and stakeholders. Covering the period from 2019 to 2033, with a focus on 2025, this report delves into market dynamics, segmentation, key players, and future growth projections. The report leverages extensive data and analysis to paint a clear picture of this dynamic market, highlighting both opportunities and challenges. Expect detailed breakdowns across product types, distribution channels, and end-use sectors, providing actionable intelligence for strategic decision-making.
GCC Fruits and Vegetables Industry Market Structure & Innovation Trends
This section analyzes the GCC fruits and vegetables market's structure, highlighting market concentration, innovation drivers, and regulatory frameworks. We explore the impact of product substitutes, end-user demographics, and mergers and acquisitions (M&A) activities. The analysis includes metrics such as market share and M&A deal values (in Millions).
Market Concentration: The GCC fruits and vegetables market exhibits a moderately concentrated structure, with key players such as Lulu Group, Al-Futtaim Group, and Carrefour holding significant market share. However, a considerable number of smaller regional players also contribute to the overall market dynamics. We estimate the top 5 players control approximately xx% of the market in 2025.
Innovation Drivers: Growing consumer demand for fresh, organic, and convenient produce fuels innovation. Technological advancements in food preservation, packaging, and supply chain management further drive market growth. Government initiatives promoting sustainable agriculture also play a significant role.
Regulatory Frameworks: GCC countries have implemented various regulations related to food safety, labeling, and import/export procedures. These regulations influence the operations and strategies of companies operating within the market. Understanding and complying with these regulations are crucial for success.
Product Substitutes: Processed fruits and vegetables, frozen foods, and imported products act as substitutes, influencing pricing and consumer choices. The report assesses the competitive pressure from these substitutes.
End-User Demographics: The report analyzes demographics and changing dietary preferences influencing demand within the household consumption, food processing, and restaurant/catering sectors.
M&A Activities: The report identifies and analyzes recent M&A activities in the GCC fruits and vegetables sector, estimating deal values for significant transactions.
GCC Fruits and Vegetables Industry Market Dynamics & Trends
This section examines the market's growth drivers, technological disruptions, consumer preferences, and competitive dynamics. Key metrics such as CAGR and market penetration rates are incorporated. The total market size was estimated at xx Million in 2024, with a projected CAGR of xx% from 2025 to 2033.
The GCC fruits and vegetables market is experiencing robust growth, driven by factors including rising disposable incomes, increasing population, and changing dietary habits towards healthier food options. The growing popularity of online grocery shopping is transforming distribution channels, presenting both opportunities and challenges. Technological innovations, including advanced farming techniques and improved cold chain logistics, enhance efficiency and reduce post-harvest losses. Competitive intensity remains high, with established players and new entrants vying for market share through strategies such as product diversification, brand building, and expansion into new markets. Consumer preferences are evolving, with a notable shift towards organic and locally sourced produce. This demand is driving growth in the organic fruits and vegetable segment.
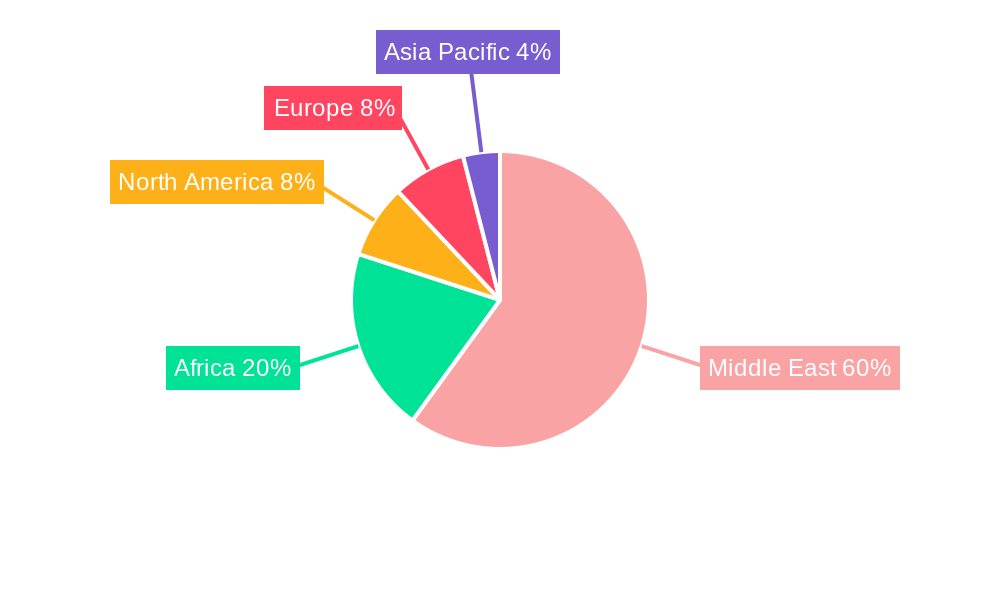
Dominant Regions & Segments in GCC Fruits and Vegetables Industry
This section identifies the leading regions, countries, and market segments across product type, distribution channel, and end-use. Key drivers are highlighted using bullet points and paragraphs offer a detailed analysis of market dominance.
Leading Region: The UAE and Saudi Arabia are the dominant markets due to their large populations, higher disposable incomes, and well-established retail infrastructure.
- Key Drivers for UAE and Saudi Arabia:
- High per capita income levels
- Strong retail infrastructure
- Growing population
- Increasing tourism
Dominant Segments:
- Product Type: Fresh fruits and vegetables represent the largest segment, followed by processed fruits and vegetables.
- Distribution Channel: Supermarkets and hypermarkets dominate the distribution channel, though traditional markets still retain significant market share. E-commerce is rapidly expanding.
- End-Use: Household consumption accounts for the majority of demand, while the food processing and restaurant sectors are also significant end-users.
GCC Fruits and Vegetables Industry Product Innovations
This section summarizes key product developments, applications, and competitive advantages. Technological trends and market fit are emphasized.
Recent innovations focus on extending shelf life, improving packaging for enhanced freshness, and developing convenient, ready-to-eat products. Technological advancements like vertical farming and hydroponics are gaining traction, promising increased yields and reduced water consumption. These innovations address consumers' demand for high-quality, convenient, and sustainably produced fruits and vegetables.
Report Scope & Segmentation Analysis
This section details the market segmentation across product type, distribution channel, and end-use, including growth projections, market sizes, and competitive dynamics.
Product Type: The report provides detailed market size and growth projections for fresh fruits, fresh vegetables, and processed fruits and vegetables, highlighting competitive dynamics within each sub-segment.
Distribution Channel: The analysis covers supermarkets and hypermarkets, traditional markets, e-commerce, and wholesale markets, providing insights into their respective growth trajectories and competitive landscapes.
End-Use: The report details market sizes and growth projections for household consumption, food processing, and restaurants and catering segments, and explores the factors driving growth in each.
Key Drivers of GCC Fruits and Vegetables Industry Growth
This section outlines the key growth drivers, focusing on technological, economic, and regulatory factors.
Several factors propel the GCC fruits and vegetables market's growth. Rising disposable incomes and urbanization increase demand for fresh produce. Government support for sustainable agriculture and food security initiatives foster market development. Technological advancements, such as improved cold chain logistics, reduce post-harvest losses and enhance product quality, while the expanding e-commerce sector opens up new distribution channels.
Challenges in the GCC Fruits and Vegetables Industry Sector
This section discusses the barriers and restraints, addressing regulatory hurdles, supply chain issues, and competitive pressures.
Challenges include maintaining product quality during transportation and storage, reliance on imports, and seasonal fluctuations in production. The increasing cost of land, labor, and water, as well as stringent food safety regulations, also pose challenges. Competitive pressure from international players and the need for effective waste management remain obstacles.
Emerging Opportunities in GCC Fruits and Vegetables Industry
This section highlights emerging trends and opportunities, focusing on new markets, technologies, and consumer preferences.
Opportunities lie in increasing consumer demand for organic and sustainably produced products, the growth of the food processing industry, and the expansion of e-commerce channels. Innovative packaging and preservation technologies present opportunities for extending shelf life and reducing food waste. Investment in local farming practices can promote food security and boost the region's agricultural sector.
Leading Players in the GCC Fruits and Vegetables Industry Market
- Del Monte Foods UAE
- Barakat Group
- NRTC Group
- Lulu Group
- Al Raya Group
- Al-Futtaim Group
- Al Bakrawe Group
- Fresh Fruits Company
- SPAR
- Carrefour
Key Developments in GCC Fruits and Vegetables Industry Industry
February 2024: Lulu Group opened its 23rd hypermarket in Doha Mall, Qatar, featuring an extensive fresh produce selection and launching the "Lulu Happiness" loyalty program. This significantly expands Lulu's reach and strengthens its market position.
February 2024: SPAR opened its 28th outlet in Al Muna Bousher, Oman, enhancing its market presence and catering to local demand for fresh fruits and vegetables.
February 2024: Carrefour launched its "Choose Better" program in Expo City, promoting healthier and sustainable choices, improving its brand image and attracting health-conscious consumers.
Future Outlook for GCC Fruits and Vegetables Industry Market
The GCC fruits and vegetables market shows strong potential for growth driven by increasing urbanization, rising disposable incomes, and evolving consumer preferences towards healthier and convenient food options. Strategic opportunities abound in developing sustainable farming practices, enhancing cold chain infrastructure, and expanding e-commerce operations. The market is poised for continued expansion, driven by both domestic consumption and the growing food processing and hospitality sectors.
GCC Fruits and Vegetables Industry Segmentation
- 1. Production Analysis
- 2. Consumption Analysis
- 3. Import Market Analysis (Value & Volume)
- 4. Export Market Analysis (Value & Volume)
- 5. Price Trend Analysis
GCC Fruits and Vegetables Industry Segmentation By Geography
-
1. United Arab Emirates
- 1.1. Fruits
- 1.2. Vegetables
-
2. Bahrain
- 2.1. Fruits
- 2.2. Vegetables
-
3. Kuwait
- 3.1. Fruits
- 3.2. Vegetables
-
4. Oman
- 4.1. Fruits
- 4.2. Vegetables
-
5. Qatar
- 5.1. Fruits
- 5.2. Vegetables
-
6. Saudi Arabia
- 6.1. Fruits
- 6.2. Vegetables
GCC Fruits and Vegetables Industry REPORT HIGHLIGHTS
| Aspects | Details |
|---|---|
| Study Period | 2019-2033 |
| Base Year | 2024 |
| Estimated Year | 2025 |
| Forecast Period | 2025-2033 |
| Historical Period | 2019-2024 |
| Growth Rate | CAGR of 4.80% from 2019-2033 |
| Segmentation |
|
Table of Contents
- 1. Introduction
- 1.1. Research Scope
- 1.2. Market Segmentation
- 1.3. Research Methodology
- 1.4. Definitions and Assumptions
- 2. Executive Summary
- 2.1. Introduction
- 3. Market Dynamics
- 3.1. Introduction
- 3.2. Market Drivers
- 3.2.1. Increasing Adoption of Technology in Horticulture; Government Initiatives for Self-reliance in Vegetable and Fruit Farming
- 3.3. Market Restrains
- 3.3.1. Limited Resource Availability and Unfavourable Climatic Condition; Increasing Reliance on Imports for Domestic Supply
- 3.4. Market Trends
- 3.4.1. Increasing Adoption of Technology in Horticulture
- 4. Market Factor Analysis
- 4.1. Porters Five Forces
- 4.2. Supply/Value Chain
- 4.3. PESTEL analysis
- 4.4. Market Entropy
- 4.5. Patent/Trademark Analysis
- 5. Global GCC Fruits and Vegetables Industry Analysis, Insights and Forecast, 2019-2031
- 5.1. Market Analysis, Insights and Forecast - by Production Analysis
- 5.2. Market Analysis, Insights and Forecast - by Consumption Analysis
- 5.3. Market Analysis, Insights and Forecast - by Import Market Analysis (Value & Volume)
- 5.4. Market Analysis, Insights and Forecast - by Export Market Analysis (Value & Volume)
- 5.5. Market Analysis, Insights and Forecast - by Price Trend Analysis
- 5.6. Market Analysis, Insights and Forecast - by Region
- 5.6.1. United Arab Emirates
- 5.6.2. Bahrain
- 5.6.3. Kuwait
- 5.6.4. Oman
- 5.6.5. Qatar
- 5.6.6. Saudi Arabia
- 5.1. Market Analysis, Insights and Forecast - by Production Analysis
- 6. United Arab Emirates GCC Fruits and Vegetables Industry Analysis, Insights and Forecast, 2019-2031
- 6.1. Market Analysis, Insights and Forecast - by Production Analysis
- 6.2. Market Analysis, Insights and Forecast - by Consumption Analysis
- 6.3. Market Analysis, Insights and Forecast - by Import Market Analysis (Value & Volume)
- 6.4. Market Analysis, Insights and Forecast - by Export Market Analysis (Value & Volume)
- 6.5. Market Analysis, Insights and Forecast - by Price Trend Analysis
- 6.1. Market Analysis, Insights and Forecast - by Production Analysis
- 7. Bahrain GCC Fruits and Vegetables Industry Analysis, Insights and Forecast, 2019-2031
- 7.1. Market Analysis, Insights and Forecast - by Production Analysis
- 7.2. Market Analysis, Insights and Forecast - by Consumption Analysis
- 7.3. Market Analysis, Insights and Forecast - by Import Market Analysis (Value & Volume)
- 7.4. Market Analysis, Insights and Forecast - by Export Market Analysis (Value & Volume)
- 7.5. Market Analysis, Insights and Forecast - by Price Trend Analysis
- 7.1. Market Analysis, Insights and Forecast - by Production Analysis
- 8. Kuwait GCC Fruits and Vegetables Industry Analysis, Insights and Forecast, 2019-2031
- 8.1. Market Analysis, Insights and Forecast - by Production Analysis
- 8.2. Market Analysis, Insights and Forecast - by Consumption Analysis
- 8.3. Market Analysis, Insights and Forecast - by Import Market Analysis (Value & Volume)
- 8.4. Market Analysis, Insights and Forecast - by Export Market Analysis (Value & Volume)
- 8.5. Market Analysis, Insights and Forecast - by Price Trend Analysis
- 8.1. Market Analysis, Insights and Forecast - by Production Analysis
- 9. Oman GCC Fruits and Vegetables Industry Analysis, Insights and Forecast, 2019-2031
- 9.1. Market Analysis, Insights and Forecast - by Production Analysis
- 9.2. Market Analysis, Insights and Forecast - by Consumption Analysis
- 9.3. Market Analysis, Insights and Forecast - by Import Market Analysis (Value & Volume)
- 9.4. Market Analysis, Insights and Forecast - by Export Market Analysis (Value & Volume)
- 9.5. Market Analysis, Insights and Forecast - by Price Trend Analysis
- 9.1. Market Analysis, Insights and Forecast - by Production Analysis
- 10. Qatar GCC Fruits and Vegetables Industry Analysis, Insights and Forecast, 2019-2031
- 10.1. Market Analysis, Insights and Forecast - by Production Analysis
- 10.2. Market Analysis, Insights and Forecast - by Consumption Analysis
- 10.3. Market Analysis, Insights and Forecast - by Import Market Analysis (Value & Volume)
- 10.4. Market Analysis, Insights and Forecast - by Export Market Analysis (Value & Volume)
- 10.5. Market Analysis, Insights and Forecast - by Price Trend Analysis
- 10.1. Market Analysis, Insights and Forecast - by Production Analysis
- 11. Saudi Arabia GCC Fruits and Vegetables Industry Analysis, Insights and Forecast, 2019-2031
- 11.1. Market Analysis, Insights and Forecast - by Production Analysis
- 11.2. Market Analysis, Insights and Forecast - by Consumption Analysis
- 11.3. Market Analysis, Insights and Forecast - by Import Market Analysis (Value & Volume)
- 11.4. Market Analysis, Insights and Forecast - by Export Market Analysis (Value & Volume)
- 11.5. Market Analysis, Insights and Forecast - by Price Trend Analysis
- 11.1. Market Analysis, Insights and Forecast - by Production Analysis
- 12. South America GCC Fruits and Vegetables Industry Analysis, Insights and Forecast, 2019-2031
- 12.1. Market Analysis, Insights and Forecast - By Country/Sub-region
- 12.1.1 Brazil
- 12.1.2 Argentina
- 12.1.3 Rest of South America
- 13. North America GCC Fruits and Vegetables Industry Analysis, Insights and Forecast, 2019-2031
- 13.1. Market Analysis, Insights and Forecast - By Country/Sub-region
- 13.1.1 United States
- 13.1.2 Canada
- 13.1.3 Mexico
- 14. Europe GCC Fruits and Vegetables Industry Analysis, Insights and Forecast, 2019-2031
- 14.1. Market Analysis, Insights and Forecast - By Country/Sub-region
- 14.1.1 Germany
- 14.1.2 France
- 14.1.3 Italy
- 14.1.4 United Kingdom
- 14.1.5 Netherlands
- 14.1.6 Rest of Europe
- 15. Asia Pacific GCC Fruits and Vegetables Industry Analysis, Insights and Forecast, 2019-2031
- 15.1. Market Analysis, Insights and Forecast - By Country/Sub-region
- 15.1.1 China
- 15.1.2 Japan
- 15.1.3 India
- 15.1.4 South Korea
- 15.1.5 Taiwan
- 15.1.6 Australia
- 15.1.7 Rest of Asia-Pacific
- 16. MEA GCC Fruits and Vegetables Industry Analysis, Insights and Forecast, 2019-2031
- 16.1. Market Analysis, Insights and Forecast - By Country/Sub-region
- 16.1.1 Middle East
- 16.1.2 Africa
- 17. Competitive Analysis
- 17.1. Global Market Share Analysis 2024
- 17.2. Company Profiles
- 17.2.1 Del Monte Foods UAE
- 17.2.1.1. Overview
- 17.2.1.2. Products
- 17.2.1.3. SWOT Analysis
- 17.2.1.4. Recent Developments
- 17.2.1.5. Financials (Based on Availability)
- 17.2.2 Barakat Group
- 17.2.2.1. Overview
- 17.2.2.2. Products
- 17.2.2.3. SWOT Analysis
- 17.2.2.4. Recent Developments
- 17.2.2.5. Financials (Based on Availability)
- 17.2.3 NRTC Group
- 17.2.3.1. Overview
- 17.2.3.2. Products
- 17.2.3.3. SWOT Analysis
- 17.2.3.4. Recent Developments
- 17.2.3.5. Financials (Based on Availability)
- 17.2.4 Lulu Group
- 17.2.4.1. Overview
- 17.2.4.2. Products
- 17.2.4.3. SWOT Analysis
- 17.2.4.4. Recent Developments
- 17.2.4.5. Financials (Based on Availability)
- 17.2.5 Al Raya Group
- 17.2.5.1. Overview
- 17.2.5.2. Products
- 17.2.5.3. SWOT Analysis
- 17.2.5.4. Recent Developments
- 17.2.5.5. Financials (Based on Availability)
- 17.2.6 Al-Futtaim Group
- 17.2.6.1. Overview
- 17.2.6.2. Products
- 17.2.6.3. SWOT Analysis
- 17.2.6.4. Recent Developments
- 17.2.6.5. Financials (Based on Availability)
- 17.2.7 Al Bakrawe Group
- 17.2.7.1. Overview
- 17.2.7.2. Products
- 17.2.7.3. SWOT Analysis
- 17.2.7.4. Recent Developments
- 17.2.7.5. Financials (Based on Availability)
- 17.2.8 Fresh Fruits Company
- 17.2.8.1. Overview
- 17.2.8.2. Products
- 17.2.8.3. SWOT Analysis
- 17.2.8.4. Recent Developments
- 17.2.8.5. Financials (Based on Availability)
- 17.2.9 SPAR
- 17.2.9.1. Overview
- 17.2.9.2. Products
- 17.2.9.3. SWOT Analysis
- 17.2.9.4. Recent Developments
- 17.2.9.5. Financials (Based on Availability)
- 17.2.10 Carrefour
- 17.2.10.1. Overview
- 17.2.10.2. Products
- 17.2.10.3. SWOT Analysis
- 17.2.10.4. Recent Developments
- 17.2.10.5. Financials (Based on Availability)
- 17.2.1 Del Monte Foods UAE
List of Figures
- Figure 1: Global GCC Fruits and Vegetables Industry Revenue Breakdown (Million, %) by Region 2024 & 2032
- Figure 2: Global GCC Fruits and Vegetables Industry Volume Breakdown (Kiloton, %) by Region 2024 & 2032
- Figure 3: South America GCC Fruits and Vegetables Industry Revenue (Million), by Country 2024 & 2032
- Figure 4: South America GCC Fruits and Vegetables Industry Volume (Kiloton), by Country 2024 & 2032
- Figure 5: South America GCC Fruits and Vegetables Industry Revenue Share (%), by Country 2024 & 2032
- Figure 6: South America GCC Fruits and Vegetables Industry Volume Share (%), by Country 2024 & 2032
- Figure 7: North America GCC Fruits and Vegetables Industry Revenue (Million), by Country 2024 & 2032
- Figure 8: North America GCC Fruits and Vegetables Industry Volume (Kiloton), by Country 2024 & 2032
- Figure 9: North America GCC Fruits and Vegetables Industry Revenue Share (%), by Country 2024 & 2032
- Figure 10: North America GCC Fruits and Vegetables Industry Volume Share (%), by Country 2024 & 2032
- Figure 11: Europe GCC Fruits and Vegetables Industry Revenue (Million), by Country 2024 & 2032
- Figure 12: Europe GCC Fruits and Vegetables Industry Volume (Kiloton), by Country 2024 & 2032
- Figure 13: Europe GCC Fruits and Vegetables Industry Revenue Share (%), by Country 2024 & 2032
- Figure 14: Europe GCC Fruits and Vegetables Industry Volume Share (%), by Country 2024 & 2032
- Figure 15: Asia Pacific GCC Fruits and Vegetables Industry Revenue (Million), by Country 2024 & 2032
- Figure 16: Asia Pacific GCC Fruits and Vegetables Industry Volume (Kiloton), by Country 2024 & 2032
- Figure 17: Asia Pacific GCC Fruits and Vegetables Industry Revenue Share (%), by Country 2024 & 2032
- Figure 18: Asia Pacific GCC Fruits and Vegetables Industry Volume Share (%), by Country 2024 & 2032
- Figure 19: MEA GCC Fruits and Vegetables Industry Revenue (Million), by Country 2024 & 2032
- Figure 20: MEA GCC Fruits and Vegetables Industry Volume (Kiloton), by Country 2024 & 2032
- Figure 21: MEA GCC Fruits and Vegetables Industry Revenue Share (%), by Country 2024 & 2032
- Figure 22: MEA GCC Fruits and Vegetables Industry Volume Share (%), by Country 2024 & 2032
- Figure 23: United Arab Emirates GCC Fruits and Vegetables Industry Revenue (Million), by Production Analysis 2024 & 2032
- Figure 24: United Arab Emirates GCC Fruits and Vegetables Industry Volume (Kiloton), by Production Analysis 2024 & 2032
- Figure 25: United Arab Emirates GCC Fruits and Vegetables Industry Revenue Share (%), by Production Analysis 2024 & 2032
- Figure 26: United Arab Emirates GCC Fruits and Vegetables Industry Volume Share (%), by Production Analysis 2024 & 2032
- Figure 27: United Arab Emirates GCC Fruits and Vegetables Industry Revenue (Million), by Consumption Analysis 2024 & 2032
- Figure 28: United Arab Emirates GCC Fruits and Vegetables Industry Volume (Kiloton), by Consumption Analysis 2024 & 2032
- Figure 29: United Arab Emirates GCC Fruits and Vegetables Industry Revenue Share (%), by Consumption Analysis 2024 & 2032
- Figure 30: United Arab Emirates GCC Fruits and Vegetables Industry Volume Share (%), by Consumption Analysis 2024 & 2032
- Figure 31: United Arab Emirates GCC Fruits and Vegetables Industry Revenue (Million), by Import Market Analysis (Value & Volume) 2024 & 2032
- Figure 32: United Arab Emirates GCC Fruits and Vegetables Industry Volume (Kiloton), by Import Market Analysis (Value & Volume) 2024 & 2032
- Figure 33: United Arab Emirates GCC Fruits and Vegetables Industry Revenue Share (%), by Import Market Analysis (Value & Volume) 2024 & 2032
- Figure 34: United Arab Emirates GCC Fruits and Vegetables Industry Volume Share (%), by Import Market Analysis (Value & Volume) 2024 & 2032
- Figure 35: United Arab Emirates GCC Fruits and Vegetables Industry Revenue (Million), by Export Market Analysis (Value & Volume) 2024 & 2032
- Figure 36: United Arab Emirates GCC Fruits and Vegetables Industry Volume (Kiloton), by Export Market Analysis (Value & Volume) 2024 & 2032
- Figure 37: United Arab Emirates GCC Fruits and Vegetables Industry Revenue Share (%), by Export Market Analysis (Value & Volume) 2024 & 2032
- Figure 38: United Arab Emirates GCC Fruits and Vegetables Industry Volume Share (%), by Export Market Analysis (Value & Volume) 2024 & 2032
- Figure 39: United Arab Emirates GCC Fruits and Vegetables Industry Revenue (Million), by Price Trend Analysis 2024 & 2032
- Figure 40: United Arab Emirates GCC Fruits and Vegetables Industry Volume (Kiloton), by Price Trend Analysis 2024 & 2032
- Figure 41: United Arab Emirates GCC Fruits and Vegetables Industry Revenue Share (%), by Price Trend Analysis 2024 & 2032
- Figure 42: United Arab Emirates GCC Fruits and Vegetables Industry Volume Share (%), by Price Trend Analysis 2024 & 2032
- Figure 43: United Arab Emirates GCC Fruits and Vegetables Industry Revenue (Million), by Country 2024 & 2032
- Figure 44: United Arab Emirates GCC Fruits and Vegetables Industry Volume (Kiloton), by Country 2024 & 2032
- Figure 45: United Arab Emirates GCC Fruits and Vegetables Industry Revenue Share (%), by Country 2024 & 2032
- Figure 46: United Arab Emirates GCC Fruits and Vegetables Industry Volume Share (%), by Country 2024 & 2032
- Figure 47: Bahrain GCC Fruits and Vegetables Industry Revenue (Million), by Production Analysis 2024 & 2032
- Figure 48: Bahrain GCC Fruits and Vegetables Industry Volume (Kiloton), by Production Analysis 2024 & 2032
- Figure 49: Bahrain GCC Fruits and Vegetables Industry Revenue Share (%), by Production Analysis 2024 & 2032
- Figure 50: Bahrain GCC Fruits and Vegetables Industry Volume Share (%), by Production Analysis 2024 & 2032
- Figure 51: Bahrain GCC Fruits and Vegetables Industry Revenue (Million), by Consumption Analysis 2024 & 2032
- Figure 52: Bahrain GCC Fruits and Vegetables Industry Volume (Kiloton), by Consumption Analysis 2024 & 2032
- Figure 53: Bahrain GCC Fruits and Vegetables Industry Revenue Share (%), by Consumption Analysis 2024 & 2032
- Figure 54: Bahrain GCC Fruits and Vegetables Industry Volume Share (%), by Consumption Analysis 2024 & 2032
- Figure 55: Bahrain GCC Fruits and Vegetables Industry Revenue (Million), by Import Market Analysis (Value & Volume) 2024 & 2032
- Figure 56: Bahrain GCC Fruits and Vegetables Industry Volume (Kiloton), by Import Market Analysis (Value & Volume) 2024 & 2032
- Figure 57: Bahrain GCC Fruits and Vegetables Industry Revenue Share (%), by Import Market Analysis (Value & Volume) 2024 & 2032
- Figure 58: Bahrain GCC Fruits and Vegetables Industry Volume Share (%), by Import Market Analysis (Value & Volume) 2024 & 2032
- Figure 59: Bahrain GCC Fruits and Vegetables Industry Revenue (Million), by Export Market Analysis (Value & Volume) 2024 & 2032
- Figure 60: Bahrain GCC Fruits and Vegetables Industry Volume (Kiloton), by Export Market Analysis (Value & Volume) 2024 & 2032
- Figure 61: Bahrain GCC Fruits and Vegetables Industry Revenue Share (%), by Export Market Analysis (Value & Volume) 2024 & 2032
- Figure 62: Bahrain GCC Fruits and Vegetables Industry Volume Share (%), by Export Market Analysis (Value & Volume) 2024 & 2032
- Figure 63: Bahrain GCC Fruits and Vegetables Industry Revenue (Million), by Price Trend Analysis 2024 & 2032
- Figure 64: Bahrain GCC Fruits and Vegetables Industry Volume (Kiloton), by Price Trend Analysis 2024 & 2032
- Figure 65: Bahrain GCC Fruits and Vegetables Industry Revenue Share (%), by Price Trend Analysis 2024 & 2032
- Figure 66: Bahrain GCC Fruits and Vegetables Industry Volume Share (%), by Price Trend Analysis 2024 & 2032
- Figure 67: Bahrain GCC Fruits and Vegetables Industry Revenue (Million), by Country 2024 & 2032
- Figure 68: Bahrain GCC Fruits and Vegetables Industry Volume (Kiloton), by Country 2024 & 2032
- Figure 69: Bahrain GCC Fruits and Vegetables Industry Revenue Share (%), by Country 2024 & 2032
- Figure 70: Bahrain GCC Fruits and Vegetables Industry Volume Share (%), by Country 2024 & 2032
- Figure 71: Kuwait GCC Fruits and Vegetables Industry Revenue (Million), by Production Analysis 2024 & 2032
- Figure 72: Kuwait GCC Fruits and Vegetables Industry Volume (Kiloton), by Production Analysis 2024 & 2032
- Figure 73: Kuwait GCC Fruits and Vegetables Industry Revenue Share (%), by Production Analysis 2024 & 2032
- Figure 74: Kuwait GCC Fruits and Vegetables Industry Volume Share (%), by Production Analysis 2024 & 2032
- Figure 75: Kuwait GCC Fruits and Vegetables Industry Revenue (Million), by Consumption Analysis 2024 & 2032
- Figure 76: Kuwait GCC Fruits and Vegetables Industry Volume (Kiloton), by Consumption Analysis 2024 & 2032
- Figure 77: Kuwait GCC Fruits and Vegetables Industry Revenue Share (%), by Consumption Analysis 2024 & 2032
- Figure 78: Kuwait GCC Fruits and Vegetables Industry Volume Share (%), by Consumption Analysis 2024 & 2032
- Figure 79: Kuwait GCC Fruits and Vegetables Industry Revenue (Million), by Import Market Analysis (Value & Volume) 2024 & 2032
- Figure 80: Kuwait GCC Fruits and Vegetables Industry Volume (Kiloton), by Import Market Analysis (Value & Volume) 2024 & 2032
- Figure 81: Kuwait GCC Fruits and Vegetables Industry Revenue Share (%), by Import Market Analysis (Value & Volume) 2024 & 2032
- Figure 82: Kuwait GCC Fruits and Vegetables Industry Volume Share (%), by Import Market Analysis (Value & Volume) 2024 & 2032
- Figure 83: Kuwait GCC Fruits and Vegetables Industry Revenue (Million), by Export Market Analysis (Value & Volume) 2024 & 2032
- Figure 84: Kuwait GCC Fruits and Vegetables Industry Volume (Kiloton), by Export Market Analysis (Value & Volume) 2024 & 2032
- Figure 85: Kuwait GCC Fruits and Vegetables Industry Revenue Share (%), by Export Market Analysis (Value & Volume) 2024 & 2032
- Figure 86: Kuwait GCC Fruits and Vegetables Industry Volume Share (%), by Export Market Analysis (Value & Volume) 2024 & 2032
- Figure 87: Kuwait GCC Fruits and Vegetables Industry Revenue (Million), by Price Trend Analysis 2024 & 2032
- Figure 88: Kuwait GCC Fruits and Vegetables Industry Volume (Kiloton), by Price Trend Analysis 2024 & 2032
- Figure 89: Kuwait GCC Fruits and Vegetables Industry Revenue Share (%), by Price Trend Analysis 2024 & 2032
- Figure 90: Kuwait GCC Fruits and Vegetables Industry Volume Share (%), by Price Trend Analysis 2024 & 2032
- Figure 91: Kuwait GCC Fruits and Vegetables Industry Revenue (Million), by Country 2024 & 2032
- Figure 92: Kuwait GCC Fruits and Vegetables Industry Volume (Kiloton), by Country 2024 & 2032
- Figure 93: Kuwait GCC Fruits and Vegetables Industry Revenue Share (%), by Country 2024 & 2032
- Figure 94: Kuwait GCC Fruits and Vegetables Industry Volume Share (%), by Country 2024 & 2032
- Figure 95: Oman GCC Fruits and Vegetables Industry Revenue (Million), by Production Analysis 2024 & 2032
- Figure 96: Oman GCC Fruits and Vegetables Industry Volume (Kiloton), by Production Analysis 2024 & 2032
- Figure 97: Oman GCC Fruits and Vegetables Industry Revenue Share (%), by Production Analysis 2024 & 2032
- Figure 98: Oman GCC Fruits and Vegetables Industry Volume Share (%), by Production Analysis 2024 & 2032
- Figure 99: Oman GCC Fruits and Vegetables Industry Revenue (Million), by Consumption Analysis 2024 & 2032
- Figure 100: Oman GCC Fruits and Vegetables Industry Volume (Kiloton), by Consumption Analysis 2024 & 2032
- Figure 101: Oman GCC Fruits and Vegetables Industry Revenue Share (%), by Consumption Analysis 2024 & 2032
- Figure 102: Oman GCC Fruits and Vegetables Industry Volume Share (%), by Consumption Analysis 2024 & 2032
- Figure 103: Oman GCC Fruits and Vegetables Industry Revenue (Million), by Import Market Analysis (Value & Volume) 2024 & 2032
- Figure 104: Oman GCC Fruits and Vegetables Industry Volume (Kiloton), by Import Market Analysis (Value & Volume) 2024 & 2032
- Figure 105: Oman GCC Fruits and Vegetables Industry Revenue Share (%), by Import Market Analysis (Value & Volume) 2024 & 2032
- Figure 106: Oman GCC Fruits and Vegetables Industry Volume Share (%), by Import Market Analysis (Value & Volume) 2024 & 2032
- Figure 107: Oman GCC Fruits and Vegetables Industry Revenue (Million), by Export Market Analysis (Value & Volume) 2024 & 2032
- Figure 108: Oman GCC Fruits and Vegetables Industry Volume (Kiloton), by Export Market Analysis (Value & Volume) 2024 & 2032
- Figure 109: Oman GCC Fruits and Vegetables Industry Revenue Share (%), by Export Market Analysis (Value & Volume) 2024 & 2032
- Figure 110: Oman GCC Fruits and Vegetables Industry Volume Share (%), by Export Market Analysis (Value & Volume) 2024 & 2032
- Figure 111: Oman GCC Fruits and Vegetables Industry Revenue (Million), by Price Trend Analysis 2024 & 2032
- Figure 112: Oman GCC Fruits and Vegetables Industry Volume (Kiloton), by Price Trend Analysis 2024 & 2032
- Figure 113: Oman GCC Fruits and Vegetables Industry Revenue Share (%), by Price Trend Analysis 2024 & 2032
- Figure 114: Oman GCC Fruits and Vegetables Industry Volume Share (%), by Price Trend Analysis 2024 & 2032
- Figure 115: Oman GCC Fruits and Vegetables Industry Revenue (Million), by Country 2024 & 2032
- Figure 116: Oman GCC Fruits and Vegetables Industry Volume (Kiloton), by Country 2024 & 2032
- Figure 117: Oman GCC Fruits and Vegetables Industry Revenue Share (%), by Country 2024 & 2032
- Figure 118: Oman GCC Fruits and Vegetables Industry Volume Share (%), by Country 2024 & 2032
- Figure 119: Qatar GCC Fruits and Vegetables Industry Revenue (Million), by Production Analysis 2024 & 2032
- Figure 120: Qatar GCC Fruits and Vegetables Industry Volume (Kiloton), by Production Analysis 2024 & 2032
- Figure 121: Qatar GCC Fruits and Vegetables Industry Revenue Share (%), by Production Analysis 2024 & 2032
- Figure 122: Qatar GCC Fruits and Vegetables Industry Volume Share (%), by Production Analysis 2024 & 2032
- Figure 123: Qatar GCC Fruits and Vegetables Industry Revenue (Million), by Consumption Analysis 2024 & 2032
- Figure 124: Qatar GCC Fruits and Vegetables Industry Volume (Kiloton), by Consumption Analysis 2024 & 2032
- Figure 125: Qatar GCC Fruits and Vegetables Industry Revenue Share (%), by Consumption Analysis 2024 & 2032
- Figure 126: Qatar GCC Fruits and Vegetables Industry Volume Share (%), by Consumption Analysis 2024 & 2032
- Figure 127: Qatar GCC Fruits and Vegetables Industry Revenue (Million), by Import Market Analysis (Value & Volume) 2024 & 2032
- Figure 128: Qatar GCC Fruits and Vegetables Industry Volume (Kiloton), by Import Market Analysis (Value & Volume) 2024 & 2032
- Figure 129: Qatar GCC Fruits and Vegetables Industry Revenue Share (%), by Import Market Analysis (Value & Volume) 2024 & 2032
- Figure 130: Qatar GCC Fruits and Vegetables Industry Volume Share (%), by Import Market Analysis (Value & Volume) 2024 & 2032
- Figure 131: Qatar GCC Fruits and Vegetables Industry Revenue (Million), by Export Market Analysis (Value & Volume) 2024 & 2032
- Figure 132: Qatar GCC Fruits and Vegetables Industry Volume (Kiloton), by Export Market Analysis (Value & Volume) 2024 & 2032
- Figure 133: Qatar GCC Fruits and Vegetables Industry Revenue Share (%), by Export Market Analysis (Value & Volume) 2024 & 2032
- Figure 134: Qatar GCC Fruits and Vegetables Industry Volume Share (%), by Export Market Analysis (Value & Volume) 2024 & 2032
- Figure 135: Qatar GCC Fruits and Vegetables Industry Revenue (Million), by Price Trend Analysis 2024 & 2032
- Figure 136: Qatar GCC Fruits and Vegetables Industry Volume (Kiloton), by Price Trend Analysis 2024 & 2032
- Figure 137: Qatar GCC Fruits and Vegetables Industry Revenue Share (%), by Price Trend Analysis 2024 & 2032
- Figure 138: Qatar GCC Fruits and Vegetables Industry Volume Share (%), by Price Trend Analysis 2024 & 2032
- Figure 139: Qatar GCC Fruits and Vegetables Industry Revenue (Million), by Country 2024 & 2032
- Figure 140: Qatar GCC Fruits and Vegetables Industry Volume (Kiloton), by Country 2024 & 2032
- Figure 141: Qatar GCC Fruits and Vegetables Industry Revenue Share (%), by Country 2024 & 2032
- Figure 142: Qatar GCC Fruits and Vegetables Industry Volume Share (%), by Country 2024 & 2032
- Figure 143: Saudi Arabia GCC Fruits and Vegetables Industry Revenue (Million), by Production Analysis 2024 & 2032
- Figure 144: Saudi Arabia GCC Fruits and Vegetables Industry Volume (Kiloton), by Production Analysis 2024 & 2032
- Figure 145: Saudi Arabia GCC Fruits and Vegetables Industry Revenue Share (%), by Production Analysis 2024 & 2032
- Figure 146: Saudi Arabia GCC Fruits and Vegetables Industry Volume Share (%), by Production Analysis 2024 & 2032
- Figure 147: Saudi Arabia GCC Fruits and Vegetables Industry Revenue (Million), by Consumption Analysis 2024 & 2032
- Figure 148: Saudi Arabia GCC Fruits and Vegetables Industry Volume (Kiloton), by Consumption Analysis 2024 & 2032
- Figure 149: Saudi Arabia GCC Fruits and Vegetables Industry Revenue Share (%), by Consumption Analysis 2024 & 2032
- Figure 150: Saudi Arabia GCC Fruits and Vegetables Industry Volume Share (%), by Consumption Analysis 2024 & 2032
- Figure 151: Saudi Arabia GCC Fruits and Vegetables Industry Revenue (Million), by Import Market Analysis (Value & Volume) 2024 & 2032
- Figure 152: Saudi Arabia GCC Fruits and Vegetables Industry Volume (Kiloton), by Import Market Analysis (Value & Volume) 2024 & 2032
- Figure 153: Saudi Arabia GCC Fruits and Vegetables Industry Revenue Share (%), by Import Market Analysis (Value & Volume) 2024 & 2032
- Figure 154: Saudi Arabia GCC Fruits and Vegetables Industry Volume Share (%), by Import Market Analysis (Value & Volume) 2024 & 2032
- Figure 155: Saudi Arabia GCC Fruits and Vegetables Industry Revenue (Million), by Export Market Analysis (Value & Volume) 2024 & 2032
- Figure 156: Saudi Arabia GCC Fruits and Vegetables Industry Volume (Kiloton), by Export Market Analysis (Value & Volume) 2024 & 2032
- Figure 157: Saudi Arabia GCC Fruits and Vegetables Industry Revenue Share (%), by Export Market Analysis (Value & Volume) 2024 & 2032
- Figure 158: Saudi Arabia GCC Fruits and Vegetables Industry Volume Share (%), by Export Market Analysis (Value & Volume) 2024 & 2032
- Figure 159: Saudi Arabia GCC Fruits and Vegetables Industry Revenue (Million), by Price Trend Analysis 2024 & 2032
- Figure 160: Saudi Arabia GCC Fruits and Vegetables Industry Volume (Kiloton), by Price Trend Analysis 2024 & 2032
- Figure 161: Saudi Arabia GCC Fruits and Vegetables Industry Revenue Share (%), by Price Trend Analysis 2024 & 2032
- Figure 162: Saudi Arabia GCC Fruits and Vegetables Industry Volume Share (%), by Price Trend Analysis 2024 & 2032
- Figure 163: Saudi Arabia GCC Fruits and Vegetables Industry Revenue (Million), by Country 2024 & 2032
- Figure 164: Saudi Arabia GCC Fruits and Vegetables Industry Volume (Kiloton), by Country 2024 & 2032
- Figure 165: Saudi Arabia GCC Fruits and Vegetables Industry Revenue Share (%), by Country 2024 & 2032
- Figure 166: Saudi Arabia GCC Fruits and Vegetables Industry Volume Share (%), by Country 2024 & 2032
List of Tables
- Table 1: Global GCC Fruits and Vegetables Industry Revenue Million Forecast, by Region 2019 & 2032
- Table 2: Global GCC Fruits and Vegetables Industry Volume Kiloton Forecast, by Region 2019 & 2032
- Table 3: Global GCC Fruits and Vegetables Industry Revenue Million Forecast, by Production Analysis 2019 & 2032
- Table 4: Global GCC Fruits and Vegetables Industry Volume Kiloton Forecast, by Production Analysis 2019 & 2032
- Table 5: Global GCC Fruits and Vegetables Industry Revenue Million Forecast, by Consumption Analysis 2019 & 2032
- Table 6: Global GCC Fruits and Vegetables Industry Volume Kiloton Forecast, by Consumption Analysis 2019 & 2032
- Table 7: Global GCC Fruits and Vegetables Industry Revenue Million Forecast, by Import Market Analysis (Value & Volume) 2019 & 2032
- Table 8: Global GCC Fruits and Vegetables Industry Volume Kiloton Forecast, by Import Market Analysis (Value & Volume) 2019 & 2032
- Table 9: Global GCC Fruits and Vegetables Industry Revenue Million Forecast, by Export Market Analysis (Value & Volume) 2019 & 2032
- Table 10: Global GCC Fruits and Vegetables Industry Volume Kiloton Forecast, by Export Market Analysis (Value & Volume) 2019 & 2032
- Table 11: Global GCC Fruits and Vegetables Industry Revenue Million Forecast, by Price Trend Analysis 2019 & 2032
- Table 12: Global GCC Fruits and Vegetables Industry Volume Kiloton Forecast, by Price Trend Analysis 2019 & 2032
- Table 13: Global GCC Fruits and Vegetables Industry Revenue Million Forecast, by Region 2019 & 2032
- Table 14: Global GCC Fruits and Vegetables Industry Volume Kiloton Forecast, by Region 2019 & 2032
- Table 15: Global GCC Fruits and Vegetables Industry Revenue Million Forecast, by Country 2019 & 2032
- Table 16: Global GCC Fruits and Vegetables Industry Volume Kiloton Forecast, by Country 2019 & 2032
- Table 17: Brazil GCC Fruits and Vegetables Industry Revenue (Million) Forecast, by Application 2019 & 2032
- Table 18: Brazil GCC Fruits and Vegetables Industry Volume (Kiloton) Forecast, by Application 2019 & 2032
- Table 19: Argentina GCC Fruits and Vegetables Industry Revenue (Million) Forecast, by Application 2019 & 2032
- Table 20: Argentina GCC Fruits and Vegetables Industry Volume (Kiloton) Forecast, by Application 2019 & 2032
- Table 21: Rest of South America GCC Fruits and Vegetables Industry Revenue (Million) Forecast, by Application 2019 & 2032
- Table 22: Rest of South America GCC Fruits and Vegetables Industry Volume (Kiloton) Forecast, by Application 2019 & 2032
- Table 23: Global GCC Fruits and Vegetables Industry Revenue Million Forecast, by Country 2019 & 2032
- Table 24: Global GCC Fruits and Vegetables Industry Volume Kiloton Forecast, by Country 2019 & 2032
- Table 25: United States GCC Fruits and Vegetables Industry Revenue (Million) Forecast, by Application 2019 & 2032
- Table 26: United States GCC Fruits and Vegetables Industry Volume (Kiloton) Forecast, by Application 2019 & 2032
- Table 27: Canada GCC Fruits and Vegetables Industry Revenue (Million) Forecast, by Application 2019 & 2032
- Table 28: Canada GCC Fruits and Vegetables Industry Volume (Kiloton) Forecast, by Application 2019 & 2032
- Table 29: Mexico GCC Fruits and Vegetables Industry Revenue (Million) Forecast, by Application 2019 & 2032
- Table 30: Mexico GCC Fruits and Vegetables Industry Volume (Kiloton) Forecast, by Application 2019 & 2032
- Table 31: Global GCC Fruits and Vegetables Industry Revenue Million Forecast, by Country 2019 & 2032
- Table 32: Global GCC Fruits and Vegetables Industry Volume Kiloton Forecast, by Country 2019 & 2032
- Table 33: Germany GCC Fruits and Vegetables Industry Revenue (Million) Forecast, by Application 2019 & 2032
- Table 34: Germany GCC Fruits and Vegetables Industry Volume (Kiloton) Forecast, by Application 2019 & 2032
- Table 35: France GCC Fruits and Vegetables Industry Revenue (Million) Forecast, by Application 2019 & 2032
- Table 36: France GCC Fruits and Vegetables Industry Volume (Kiloton) Forecast, by Application 2019 & 2032
- Table 37: Italy GCC Fruits and Vegetables Industry Revenue (Million) Forecast, by Application 2019 & 2032
- Table 38: Italy GCC Fruits and Vegetables Industry Volume (Kiloton) Forecast, by Application 2019 & 2032
- Table 39: United Kingdom GCC Fruits and Vegetables Industry Revenue (Million) Forecast, by Application 2019 & 2032
- Table 40: United Kingdom GCC Fruits and Vegetables Industry Volume (Kiloton) Forecast, by Application 2019 & 2032
- Table 41: Netherlands GCC Fruits and Vegetables Industry Revenue (Million) Forecast, by Application 2019 & 2032
- Table 42: Netherlands GCC Fruits and Vegetables Industry Volume (Kiloton) Forecast, by Application 2019 & 2032
- Table 43: Rest of Europe GCC Fruits and Vegetables Industry Revenue (Million) Forecast, by Application 2019 & 2032
- Table 44: Rest of Europe GCC Fruits and Vegetables Industry Volume (Kiloton) Forecast, by Application 2019 & 2032
- Table 45: Global GCC Fruits and Vegetables Industry Revenue Million Forecast, by Country 2019 & 2032
- Table 46: Global GCC Fruits and Vegetables Industry Volume Kiloton Forecast, by Country 2019 & 2032
- Table 47: China GCC Fruits and Vegetables Industry Revenue (Million) Forecast, by Application 2019 & 2032
- Table 48: China GCC Fruits and Vegetables Industry Volume (Kiloton) Forecast, by Application 2019 & 2032
- Table 49: Japan GCC Fruits and Vegetables Industry Revenue (Million) Forecast, by Application 2019 & 2032
- Table 50: Japan GCC Fruits and Vegetables Industry Volume (Kiloton) Forecast, by Application 2019 & 2032
- Table 51: India GCC Fruits and Vegetables Industry Revenue (Million) Forecast, by Application 2019 & 2032
- Table 52: India GCC Fruits and Vegetables Industry Volume (Kiloton) Forecast, by Application 2019 & 2032
- Table 53: South Korea GCC Fruits and Vegetables Industry Revenue (Million) Forecast, by Application 2019 & 2032
- Table 54: South Korea GCC Fruits and Vegetables Industry Volume (Kiloton) Forecast, by Application 2019 & 2032
- Table 55: Taiwan GCC Fruits and Vegetables Industry Revenue (Million) Forecast, by Application 2019 & 2032
- Table 56: Taiwan GCC Fruits and Vegetables Industry Volume (Kiloton) Forecast, by Application 2019 & 2032
- Table 57: Australia GCC Fruits and Vegetables Industry Revenue (Million) Forecast, by Application 2019 & 2032
- Table 58: Australia GCC Fruits and Vegetables Industry Volume (Kiloton) Forecast, by Application 2019 & 2032
- Table 59: Rest of Asia-Pacific GCC Fruits and Vegetables Industry Revenue (Million) Forecast, by Application 2019 & 2032
- Table 60: Rest of Asia-Pacific GCC Fruits and Vegetables Industry Volume (Kiloton) Forecast, by Application 2019 & 2032
- Table 61: Global GCC Fruits and Vegetables Industry Revenue Million Forecast, by Country 2019 & 2032
- Table 62: Global GCC Fruits and Vegetables Industry Volume Kiloton Forecast, by Country 2019 & 2032
- Table 63: Middle East GCC Fruits and Vegetables Industry Revenue (Million) Forecast, by Application 2019 & 2032
- Table 64: Middle East GCC Fruits and Vegetables Industry Volume (Kiloton) Forecast, by Application 2019 & 2032
- Table 65: Africa GCC Fruits and Vegetables Industry Revenue (Million) Forecast, by Application 2019 & 2032
- Table 66: Africa GCC Fruits and Vegetables Industry Volume (Kiloton) Forecast, by Application 2019 & 2032
- Table 67: Global GCC Fruits and Vegetables Industry Revenue Million Forecast, by Production Analysis 2019 & 2032
- Table 68: Global GCC Fruits and Vegetables Industry Volume Kiloton Forecast, by Production Analysis 2019 & 2032
- Table 69: Global GCC Fruits and Vegetables Industry Revenue Million Forecast, by Consumption Analysis 2019 & 2032
- Table 70: Global GCC Fruits and Vegetables Industry Volume Kiloton Forecast, by Consumption Analysis 2019 & 2032
- Table 71: Global GCC Fruits and Vegetables Industry Revenue Million Forecast, by Import Market Analysis (Value & Volume) 2019 & 2032
- Table 72: Global GCC Fruits and Vegetables Industry Volume Kiloton Forecast, by Import Market Analysis (Value & Volume) 2019 & 2032
- Table 73: Global GCC Fruits and Vegetables Industry Revenue Million Forecast, by Export Market Analysis (Value & Volume) 2019 & 2032
- Table 74: Global GCC Fruits and Vegetables Industry Volume Kiloton Forecast, by Export Market Analysis (Value & Volume) 2019 & 2032
- Table 75: Global GCC Fruits and Vegetables Industry Revenue Million Forecast, by Price Trend Analysis 2019 & 2032
- Table 76: Global GCC Fruits and Vegetables Industry Volume Kiloton Forecast, by Price Trend Analysis 2019 & 2032
- Table 77: Global GCC Fruits and Vegetables Industry Revenue Million Forecast, by Country 2019 & 2032
- Table 78: Global GCC Fruits and Vegetables Industry Volume Kiloton Forecast, by Country 2019 & 2032
- Table 79: Fruits GCC Fruits and Vegetables Industry Revenue (Million) Forecast, by Application 2019 & 2032
- Table 80: Fruits GCC Fruits and Vegetables Industry Volume (Kiloton) Forecast, by Application 2019 & 2032
- Table 81: Vegetables GCC Fruits and Vegetables Industry Revenue (Million) Forecast, by Application 2019 & 2032
- Table 82: Vegetables GCC Fruits and Vegetables Industry Volume (Kiloton) Forecast, by Application 2019 & 2032
- Table 83: Global GCC Fruits and Vegetables Industry Revenue Million Forecast, by Production Analysis 2019 & 2032
- Table 84: Global GCC Fruits and Vegetables Industry Volume Kiloton Forecast, by Production Analysis 2019 & 2032
- Table 85: Global GCC Fruits and Vegetables Industry Revenue Million Forecast, by Consumption Analysis 2019 & 2032
- Table 86: Global GCC Fruits and Vegetables Industry Volume Kiloton Forecast, by Consumption Analysis 2019 & 2032
- Table 87: Global GCC Fruits and Vegetables Industry Revenue Million Forecast, by Import Market Analysis (Value & Volume) 2019 & 2032
- Table 88: Global GCC Fruits and Vegetables Industry Volume Kiloton Forecast, by Import Market Analysis (Value & Volume) 2019 & 2032
- Table 89: Global GCC Fruits and Vegetables Industry Revenue Million Forecast, by Export Market Analysis (Value & Volume) 2019 & 2032
- Table 90: Global GCC Fruits and Vegetables Industry Volume Kiloton Forecast, by Export Market Analysis (Value & Volume) 2019 & 2032
- Table 91: Global GCC Fruits and Vegetables Industry Revenue Million Forecast, by Price Trend Analysis 2019 & 2032
- Table 92: Global GCC Fruits and Vegetables Industry Volume Kiloton Forecast, by Price Trend Analysis 2019 & 2032
- Table 93: Global GCC Fruits and Vegetables Industry Revenue Million Forecast, by Country 2019 & 2032
- Table 94: Global GCC Fruits and Vegetables Industry Volume Kiloton Forecast, by Country 2019 & 2032
- Table 95: Fruits GCC Fruits and Vegetables Industry Revenue (Million) Forecast, by Application 2019 & 2032
- Table 96: Fruits GCC Fruits and Vegetables Industry Volume (Kiloton) Forecast, by Application 2019 & 2032
- Table 97: Vegetables GCC Fruits and Vegetables Industry Revenue (Million) Forecast, by Application 2019 & 2032
- Table 98: Vegetables GCC Fruits and Vegetables Industry Volume (Kiloton) Forecast, by Application 2019 & 2032
- Table 99: Global GCC Fruits and Vegetables Industry Revenue Million Forecast, by Production Analysis 2019 & 2032
- Table 100: Global GCC Fruits and Vegetables Industry Volume Kiloton Forecast, by Production Analysis 2019 & 2032
- Table 101: Global GCC Fruits and Vegetables Industry Revenue Million Forecast, by Consumption Analysis 2019 & 2032
- Table 102: Global GCC Fruits and Vegetables Industry Volume Kiloton Forecast, by Consumption Analysis 2019 & 2032
- Table 103: Global GCC Fruits and Vegetables Industry Revenue Million Forecast, by Import Market Analysis (Value & Volume) 2019 & 2032
- Table 104: Global GCC Fruits and Vegetables Industry Volume Kiloton Forecast, by Import Market Analysis (Value & Volume) 2019 & 2032
- Table 105: Global GCC Fruits and Vegetables Industry Revenue Million Forecast, by Export Market Analysis (Value & Volume) 2019 & 2032
- Table 106: Global GCC Fruits and Vegetables Industry Volume Kiloton Forecast, by Export Market Analysis (Value & Volume) 2019 & 2032
- Table 107: Global GCC Fruits and Vegetables Industry Revenue Million Forecast, by Price Trend Analysis 2019 & 2032
- Table 108: Global GCC Fruits and Vegetables Industry Volume Kiloton Forecast, by Price Trend Analysis 2019 & 2032
- Table 109: Global GCC Fruits and Vegetables Industry Revenue Million Forecast, by Country 2019 & 2032
- Table 110: Global GCC Fruits and Vegetables Industry Volume Kiloton Forecast, by Country 2019 & 2032
- Table 111: Fruits GCC Fruits and Vegetables Industry Revenue (Million) Forecast, by Application 2019 & 2032
- Table 112: Fruits GCC Fruits and Vegetables Industry Volume (Kiloton) Forecast, by Application 2019 & 2032
- Table 113: Vegetables GCC Fruits and Vegetables Industry Revenue (Million) Forecast, by Application 2019 & 2032
- Table 114: Vegetables GCC Fruits and Vegetables Industry Volume (Kiloton) Forecast, by Application 2019 & 2032
- Table 115: Global GCC Fruits and Vegetables Industry Revenue Million Forecast, by Production Analysis 2019 & 2032
- Table 116: Global GCC Fruits and Vegetables Industry Volume Kiloton Forecast, by Production Analysis 2019 & 2032
- Table 117: Global GCC Fruits and Vegetables Industry Revenue Million Forecast, by Consumption Analysis 2019 & 2032
- Table 118: Global GCC Fruits and Vegetables Industry Volume Kiloton Forecast, by Consumption Analysis 2019 & 2032
- Table 119: Global GCC Fruits and Vegetables Industry Revenue Million Forecast, by Import Market Analysis (Value & Volume) 2019 & 2032
- Table 120: Global GCC Fruits and Vegetables Industry Volume Kiloton Forecast, by Import Market Analysis (Value & Volume) 2019 & 2032
- Table 121: Global GCC Fruits and Vegetables Industry Revenue Million Forecast, by Export Market Analysis (Value & Volume) 2019 & 2032
- Table 122: Global GCC Fruits and Vegetables Industry Volume Kiloton Forecast, by Export Market Analysis (Value & Volume) 2019 & 2032
- Table 123: Global GCC Fruits and Vegetables Industry Revenue Million Forecast, by Price Trend Analysis 2019 & 2032
- Table 124: Global GCC Fruits and Vegetables Industry Volume Kiloton Forecast, by Price Trend Analysis 2019 & 2032
- Table 125: Global GCC Fruits and Vegetables Industry Revenue Million Forecast, by Country 2019 & 2032
- Table 126: Global GCC Fruits and Vegetables Industry Volume Kiloton Forecast, by Country 2019 & 2032
- Table 127: Fruits GCC Fruits and Vegetables Industry Revenue (Million) Forecast, by Application 2019 & 2032
- Table 128: Fruits GCC Fruits and Vegetables Industry Volume (Kiloton) Forecast, by Application 2019 & 2032
- Table 129: Vegetables GCC Fruits and Vegetables Industry Revenue (Million) Forecast, by Application 2019 & 2032
- Table 130: Vegetables GCC Fruits and Vegetables Industry Volume (Kiloton) Forecast, by Application 2019 & 2032
- Table 131: Global GCC Fruits and Vegetables Industry Revenue Million Forecast, by Production Analysis 2019 & 2032
- Table 132: Global GCC Fruits and Vegetables Industry Volume Kiloton Forecast, by Production Analysis 2019 & 2032
- Table 133: Global GCC Fruits and Vegetables Industry Revenue Million Forecast, by Consumption Analysis 2019 & 2032
- Table 134: Global GCC Fruits and Vegetables Industry Volume Kiloton Forecast, by Consumption Analysis 2019 & 2032
- Table 135: Global GCC Fruits and Vegetables Industry Revenue Million Forecast, by Import Market Analysis (Value & Volume) 2019 & 2032
- Table 136: Global GCC Fruits and Vegetables Industry Volume Kiloton Forecast, by Import Market Analysis (Value & Volume) 2019 & 2032
- Table 137: Global GCC Fruits and Vegetables Industry Revenue Million Forecast, by Export Market Analysis (Value & Volume) 2019 & 2032
- Table 138: Global GCC Fruits and Vegetables Industry Volume Kiloton Forecast, by Export Market Analysis (Value & Volume) 2019 & 2032
- Table 139: Global GCC Fruits and Vegetables Industry Revenue Million Forecast, by Price Trend Analysis 2019 & 2032
- Table 140: Global GCC Fruits and Vegetables Industry Volume Kiloton Forecast, by Price Trend Analysis 2019 & 2032
- Table 141: Global GCC Fruits and Vegetables Industry Revenue Million Forecast, by Country 2019 & 2032
- Table 142: Global GCC Fruits and Vegetables Industry Volume Kiloton Forecast, by Country 2019 & 2032
- Table 143: Fruits GCC Fruits and Vegetables Industry Revenue (Million) Forecast, by Application 2019 & 2032
- Table 144: Fruits GCC Fruits and Vegetables Industry Volume (Kiloton) Forecast, by Application 2019 & 2032
- Table 145: Vegetables GCC Fruits and Vegetables Industry Revenue (Million) Forecast, by Application 2019 & 2032
- Table 146: Vegetables GCC Fruits and Vegetables Industry Volume (Kiloton) Forecast, by Application 2019 & 2032
- Table 147: Global GCC Fruits and Vegetables Industry Revenue Million Forecast, by Production Analysis 2019 & 2032
- Table 148: Global GCC Fruits and Vegetables Industry Volume Kiloton Forecast, by Production Analysis 2019 & 2032
- Table 149: Global GCC Fruits and Vegetables Industry Revenue Million Forecast, by Consumption Analysis 2019 & 2032
- Table 150: Global GCC Fruits and Vegetables Industry Volume Kiloton Forecast, by Consumption Analysis 2019 & 2032
- Table 151: Global GCC Fruits and Vegetables Industry Revenue Million Forecast, by Import Market Analysis (Value & Volume) 2019 & 2032
- Table 152: Global GCC Fruits and Vegetables Industry Volume Kiloton Forecast, by Import Market Analysis (Value & Volume) 2019 & 2032
- Table 153: Global GCC Fruits and Vegetables Industry Revenue Million Forecast, by Export Market Analysis (Value & Volume) 2019 & 2032
- Table 154: Global GCC Fruits and Vegetables Industry Volume Kiloton Forecast, by Export Market Analysis (Value & Volume) 2019 & 2032
- Table 155: Global GCC Fruits and Vegetables Industry Revenue Million Forecast, by Price Trend Analysis 2019 & 2032
- Table 156: Global GCC Fruits and Vegetables Industry Volume Kiloton Forecast, by Price Trend Analysis 2019 & 2032
- Table 157: Global GCC Fruits and Vegetables Industry Revenue Million Forecast, by Country 2019 & 2032
- Table 158: Global GCC Fruits and Vegetables Industry Volume Kiloton Forecast, by Country 2019 & 2032
- Table 159: Fruits GCC Fruits and Vegetables Industry Revenue (Million) Forecast, by Application 2019 & 2032
- Table 160: Fruits GCC Fruits and Vegetables Industry Volume (Kiloton) Forecast, by Application 2019 & 2032
- Table 161: Vegetables GCC Fruits and Vegetables Industry Revenue (Million) Forecast, by Application 2019 & 2032
- Table 162: Vegetables GCC Fruits and Vegetables Industry Volume (Kiloton) Forecast, by Application 2019 & 2032
Frequently Asked Questions
1. What is the projected Compound Annual Growth Rate (CAGR) of the GCC Fruits and Vegetables Industry?
The projected CAGR is approximately 4.80%.
2. Which companies are prominent players in the GCC Fruits and Vegetables Industry?
Key companies in the market include Del Monte Foods UAE , Barakat Group , NRTC Group, Lulu Group , Al Raya Group , Al-Futtaim Group , Al Bakrawe Group , Fresh Fruits Company, SPAR , Carrefour .
3. What are the main segments of the GCC Fruits and Vegetables Industry?
The market segments include Production Analysis, Consumption Analysis, Import Market Analysis (Value & Volume), Export Market Analysis (Value & Volume), Price Trend Analysis.
4. Can you provide details about the market size?
The market size is estimated to be USD 15.98 Million as of 2022.
5. What are some drivers contributing to market growth?
Increasing Adoption of Technology in Horticulture; Government Initiatives for Self-reliance in Vegetable and Fruit Farming.
6. What are the notable trends driving market growth?
Increasing Adoption of Technology in Horticulture.
7. Are there any restraints impacting market growth?
Limited Resource Availability and Unfavourable Climatic Condition; Increasing Reliance on Imports for Domestic Supply.
8. Can you provide examples of recent developments in the market?
February 2024: Lulu Group opened its 23rd hypermarket in the new Doha Mall, Qatar. The hypermarket is a two-floor space of 80,000 square feet that features a modern design aligned with the latest shopping trends. The new hypermarket introduces an extensive range of fresh produce worldwide. Also, to help shoppers save more and get loyalty rewards, Lulu launched its innovative loyalty reward program, Lulu Happiness. By joining this program, shoppers get exclusive offers, additional discounts, and redeemable points whenever they shop at any Lulu Hypermarket.
9. What pricing options are available for accessing the report?
Pricing options include single-user, multi-user, and enterprise licenses priced at USD 4750, USD 5250, and USD 8750 respectively.
10. Is the market size provided in terms of value or volume?
The market size is provided in terms of value, measured in Million and volume, measured in Kiloton.
11. Are there any specific market keywords associated with the report?
Yes, the market keyword associated with the report is "GCC Fruits and Vegetables Industry," which aids in identifying and referencing the specific market segment covered.
12. How do I determine which pricing option suits my needs best?
The pricing options vary based on user requirements and access needs. Individual users may opt for single-user licenses, while businesses requiring broader access may choose multi-user or enterprise licenses for cost-effective access to the report.
13. Are there any additional resources or data provided in the GCC Fruits and Vegetables Industry report?
While the report offers comprehensive insights, it's advisable to review the specific contents or supplementary materials provided to ascertain if additional resources or data are available.
14. How can I stay updated on further developments or reports in the GCC Fruits and Vegetables Industry?
To stay informed about further developments, trends, and reports in the GCC Fruits and Vegetables Industry, consider subscribing to industry newsletters, following relevant companies and organizations, or regularly checking reputable industry news sources and publications.
Methodology
Step 1 - Identification of Relevant Samples Size from Population Database


Step 2 - Approaches for Defining Global Market Size (Value, Volume* & Price*)

Note*: In applicable scenarios
Step 3 - Data Sources
Primary Research
- Web Analytics
- Survey Reports
- Research Institute
- Latest Research Reports
- Opinion Leaders
Secondary Research
- Annual Reports
- White Paper
- Latest Press Release
- Industry Association
- Paid Database
- Investor Presentations

Step 4 - Data Triangulation
Involves using different sources of information in order to increase the validity of a study
These sources are likely to be stakeholders in a program - participants, other researchers, program staff, other community members, and so on.
Then we put all data in single framework & apply various statistical tools to find out the dynamic on the market.
During the analysis stage, feedback from the stakeholder groups would be compared to determine areas of agreement as well as areas of divergence


