
Key Insights
The global glass bottles and glass packaging market is experiencing robust growth, driven by the increasing demand for sustainable and eco-friendly packaging solutions. The market's inherent characteristics, such as recyclability and its ability to preserve product quality, are key factors fueling this expansion. Consumer preference for natural and transparent packaging is further bolstering market demand, particularly within the food and beverage sectors. While the market faced some challenges in the past due to fluctuating raw material prices and energy costs, innovative manufacturing processes and the adoption of lightweighting techniques are mitigating these concerns. The market's segmentation reflects the diverse applications of glass packaging, with segments like food and beverage, pharmaceuticals, and cosmetics showing strong growth potential. Leading players like Owens-Illinois, Vidrala, and Ardagh Group are leveraging their established market presence and technological advancements to maintain a competitive edge. The market is also witnessing significant regional variations, with developed economies exhibiting higher per capita consumption, while emerging markets show immense growth potential driven by rising disposable incomes and changing lifestyles. This growth is expected to continue, driven by ongoing sustainability initiatives and increasing consumer awareness of environmentally conscious choices.
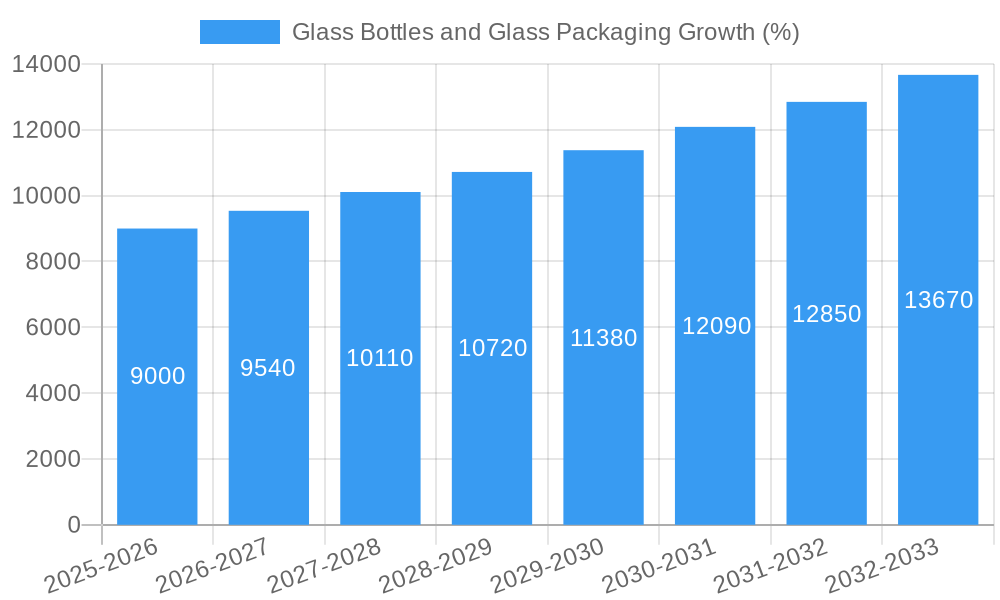
The forecast period of 2025-2033 projects continued expansion in the glass bottles and glass packaging market. Growth will be fueled by ongoing innovation in glass manufacturing, including the development of more sustainable production processes and the exploration of new glass types with enhanced functionalities. The market is adapting to evolving consumer expectations, with a focus on design aesthetics and product differentiation. Strategic partnerships and mergers and acquisitions are likely to reshape the competitive landscape, with companies seeking to expand their product portfolios and geographic reach. Government regulations promoting sustainability and circular economy principles are likely to further influence market dynamics, incentivizing the adoption of recyclable glass packaging. The focus will likely shift towards more sustainable practices including reducing carbon footprints in production and developing innovative recycling solutions to further boost the growth of the market.
Glass Bottles and Glass Packaging Market Report: 2019-2033
This comprehensive report provides an in-depth analysis of the global glass bottles and glass packaging market, offering invaluable insights for industry professionals, investors, and strategic decision-makers. Covering the period from 2019 to 2033, with a base year of 2025 and a forecast period from 2025 to 2033, this report unveils the market's structure, dynamics, leading players, and future outlook. The market is projected to reach xx million by 2033, exhibiting a significant CAGR.
Glass Bottles and Glass Packaging Market Structure & Innovation Trends
This section analyzes the competitive landscape, encompassing market concentration, innovation drivers, regulatory influences, and market dynamics. We delve into the strategic activities of key players, including mergers and acquisitions (M&A), and their impact on market share distribution.
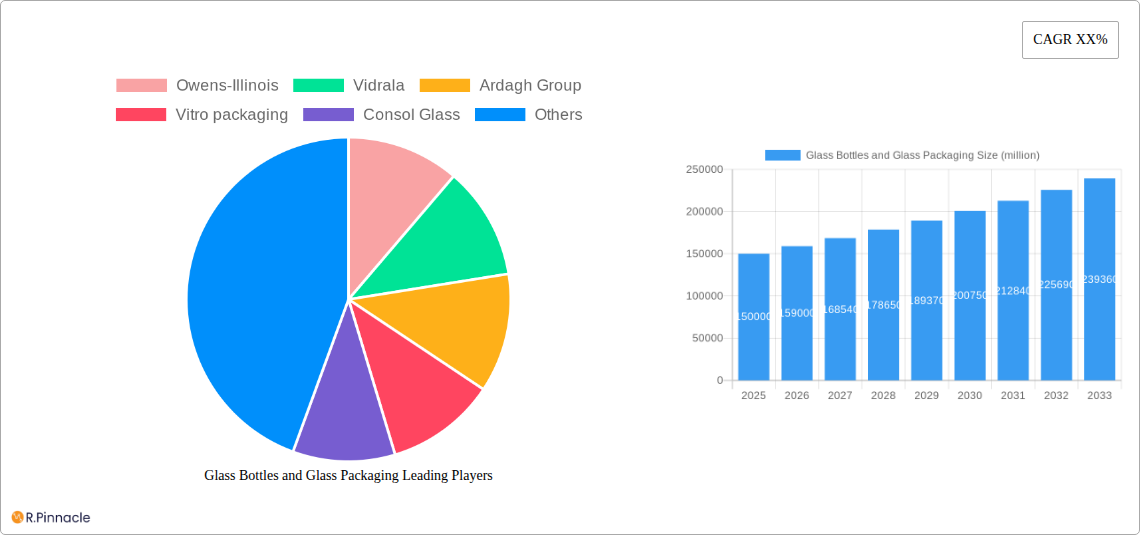
- Market Concentration: The global glass bottles and glass packaging market is moderately concentrated, with the top 10 players holding an estimated xx% market share in 2025. Owens-Illinois, Ardagh Group, and Vidrala are amongst the leading players, showcasing significant market presence.
- Innovation Drivers: Sustainability concerns, coupled with growing demand for lightweight and functional packaging solutions, are driving innovation in glass manufacturing processes and design. This includes advancements in recycled glass content and the development of new glass formulations.
- Regulatory Framework: Stringent regulations concerning material recyclability and environmental impact significantly influence the market. The evolving regulatory landscape prompts manufacturers to adopt sustainable practices.
- Product Substitutes: Competition from alternative packaging materials such as plastic, metal, and paperboard necessitates continuous innovation to maintain market share.
- M&A Activity: The past five years witnessed significant M&A activity, with deal values exceeding xx million. These strategic mergers and acquisitions have reshaped the market landscape. For example, the merger of [Company A] and [Company B] in [Year] significantly increased market share for the combined entity.
Glass Bottles and Glass Packaging Market Dynamics & Trends
This section explores the key market drivers and trends that shape the growth trajectory of the glass bottles and glass packaging market. We examine consumer preferences, technological advancements, and competitive strategies.
The market's growth is primarily fueled by the rising demand for food and beverage products, coupled with the increasing preference for sustainable and environmentally friendly packaging solutions. Technological advancements in glass manufacturing, such as improved efficiency and reduced energy consumption, also contribute to market expansion. Changing consumer preferences, notably a growing preference for premiumization and authenticity, further boost the demand for glass packaging. However, the market faces challenges from the increasing cost of raw materials and the rising competition from alternative packaging materials. The global market exhibits a CAGR of xx% during the forecast period, driven by the robust growth of the food and beverage sector and increasing consumer preference for premium packaging. Market penetration in developing economies is also expected to grow significantly.
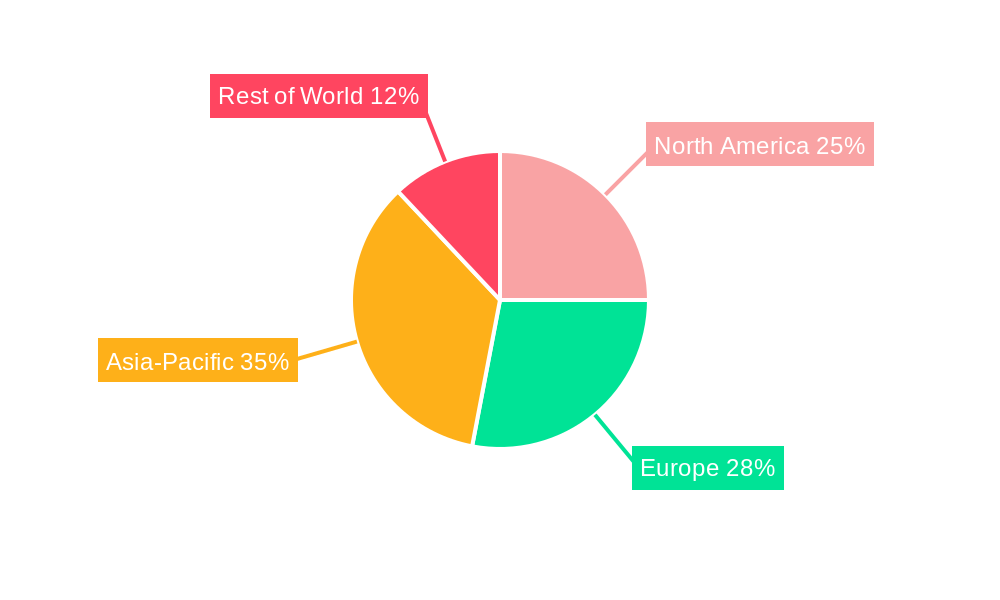
Dominant Regions & Segments in Glass Bottles and Glass Packaging
This section identifies the leading geographic regions and segments within the global glass bottles and glass packaging market.
- Leading Region: [Region Name] currently dominates the market due to strong economic growth, established infrastructure, and a significant food and beverage industry.
- Key Drivers: Robust economic growth, well-established distribution networks, and favorable government policies supporting the manufacturing sector.
- Leading Segment: [Segment Name] accounts for the largest market share due to high consumer demand and strong growth potential.
- Key Drivers: Increasing consumer preference for [specific reason], coupled with the growing popularity of [related products or industry].
[Detailed analysis of regional and segment dominance with supporting data]
Glass Bottles and Glass Packaging Product Innovations
Recent product innovations include lightweight glass bottles that reduce transportation costs and environmental impact, as well as specialized closures designed to enhance product preservation and consumer experience. These advancements address both cost-effectiveness and customer needs, improving market competitiveness and expanding product applications across various industries. Technological trends such as improved recycling capabilities and the use of recycled glass are further driving innovation in the glass packaging sector.
Report Scope & Segmentation Analysis
The report encompasses a comprehensive segmentation of the global glass bottles and glass packaging market by product type (bottles, jars, etc.), application (food & beverage, pharmaceuticals, etc.), and geography. Each segment exhibits unique growth trajectories and competitive dynamics.
[Detailed paragraph outlining each segment, growth projections and market sizes (e.g., Food and beverage packaging segment is expected to account for xx million by 2033 driven by ….)]
Key Drivers of Glass Bottles and Glass Packaging Growth
The market growth is fueled by several factors:
- Increased Demand for Sustainable Packaging: Growing consumer awareness of environmental issues is pushing demand for eco-friendly glass packaging.
- Growth in the Food and Beverage Industry: Expansion of the food and beverage sector, particularly in emerging economies, drives packaging demand.
- Technological Advancements: Improvements in glass manufacturing processes, reducing costs and increasing efficiency.
Challenges in the Glass Bottles and Glass Packaging Sector
The sector faces challenges like:
- High Raw Material Costs: Fluctuations in energy prices and raw material costs impact profitability.
- Competition from Alternative Packaging: Plastic and other alternatives pose a significant competitive threat.
- Supply Chain Disruptions: Global supply chain vulnerabilities can lead to production delays and increased costs.
Emerging Opportunities in Glass Bottles and Glass Packaging
Opportunities arise from:
- Growth in E-commerce: Increased demand for secure and visually appealing packaging for online deliveries.
- Premiumization Trend: Rising consumer preference for high-quality, premium glass packaging.
- Development of Innovative Closure Systems: Improved tamper-evident closures and functionalities enhancing consumer experience.
Leading Players in the Glass Bottles and Glass Packaging Market
- Owens-Illinois
- Vidrala
- Ardagh Group
- Vitro packaging
- Consol Glass
- Zignago Vetro Group
- Vetropack Group
- Guangdong Huaxing
- Yucai Group
- Cangzhou Xingchen Glass
- Cangzhou Four Stars Glass
- Shandong Huapeng Glass
- HEINZ-GLAS
- Piramal Glass
- SAVERGLASS Group
- Bormioli Luigi
- Stoelzle Glass Group
- Carib Glassworks Limited
- Gerresheimer
- Toyo Glass
Key Developments in Glass Bottles and Glass Packaging Industry
- [Month, Year]: [Company Name] launched a new line of lightweight glass bottles, reducing their environmental footprint.
- [Month, Year]: [Company Name] and [Company Name] announced a strategic partnership to expand their market reach.
- [Month, Year]: New regulations on recyclable materials were implemented in [Region], impacting market dynamics.
- [Month, Year]: Significant investment in recycled glass technology was announced by [Company Name].
Future Outlook for Glass Bottles and Glass Packaging Market
The future of the glass bottles and glass packaging market remains promising, driven by continued growth in the food and beverage sector, increasing consumer demand for sustainable and premium packaging, and advancements in glass manufacturing technologies. Strategic investments in research and development, coupled with a focus on sustainability, will shape the market’s future trajectory, offering significant opportunities for growth and innovation.
Glass Bottles and Glass Packaging Segmentation
-
1. Application
- 1.1. Liquor and Wine Bottles
- 1.2. Daily Packaging Glass Bottles
- 1.3. Condiment Bottles
- 1.4. Glass Jars for Canning
- 1.5. Medicine Bottles
- 1.6. Chemical Reagent Bottles
- 1.7. Others
-
2. Types
- 2.1. ≤ 10ml
- 2.2. 10-200ml
- 2.3. 200-500ml
- 2.4. 500-1000ml
- 2.5. > 1000ml
Glass Bottles and Glass Packaging Segmentation By Geography
-
1. North America
- 1.1. United States
- 1.2. Canada
- 1.3. Mexico
-
2. South America
- 2.1. Brazil
- 2.2. Argentina
- 2.3. Rest of South America
-
3. Europe
- 3.1. United Kingdom
- 3.2. Germany
- 3.3. France
- 3.4. Italy
- 3.5. Spain
- 3.6. Russia
- 3.7. Benelux
- 3.8. Nordics
- 3.9. Rest of Europe
-
4. Middle East & Africa
- 4.1. Turkey
- 4.2. Israel
- 4.3. GCC
- 4.4. North Africa
- 4.5. South Africa
- 4.6. Rest of Middle East & Africa
-
5. Asia Pacific
- 5.1. China
- 5.2. India
- 5.3. Japan
- 5.4. South Korea
- 5.5. ASEAN
- 5.6. Oceania
- 5.7. Rest of Asia Pacific
Glass Bottles and Glass Packaging REPORT HIGHLIGHTS
| Aspects | Details |
|---|---|
| Study Period | 2019-2033 |
| Base Year | 2024 |
| Estimated Year | 2025 |
| Forecast Period | 2025-2033 |
| Historical Period | 2019-2024 |
| Growth Rate | CAGR of XX% from 2019-2033 |
| Segmentation |
|
Table of Contents
- 1. Introduction
- 1.1. Research Scope
- 1.2. Market Segmentation
- 1.3. Research Methodology
- 1.4. Definitions and Assumptions
- 2. Executive Summary
- 2.1. Introduction
- 3. Market Dynamics
- 3.1. Introduction
- 3.2. Market Drivers
- 3.3. Market Restrains
- 3.4. Market Trends
- 4. Market Factor Analysis
- 4.1. Porters Five Forces
- 4.2. Supply/Value Chain
- 4.3. PESTEL analysis
- 4.4. Market Entropy
- 4.5. Patent/Trademark Analysis
- 5. Global Glass Bottles and Glass Packaging Analysis, Insights and Forecast, 2019-2031
- 5.1. Market Analysis, Insights and Forecast - by Application
- 5.1.1. Liquor and Wine Bottles
- 5.1.2. Daily Packaging Glass Bottles
- 5.1.3. Condiment Bottles
- 5.1.4. Glass Jars for Canning
- 5.1.5. Medicine Bottles
- 5.1.6. Chemical Reagent Bottles
- 5.1.7. Others
- 5.2. Market Analysis, Insights and Forecast - by Types
- 5.2.1. ≤ 10ml
- 5.2.2. 10-200ml
- 5.2.3. 200-500ml
- 5.2.4. 500-1000ml
- 5.2.5. > 1000ml
- 5.3. Market Analysis, Insights and Forecast - by Region
- 5.3.1. North America
- 5.3.2. South America
- 5.3.3. Europe
- 5.3.4. Middle East & Africa
- 5.3.5. Asia Pacific
- 5.1. Market Analysis, Insights and Forecast - by Application
- 6. North America Glass Bottles and Glass Packaging Analysis, Insights and Forecast, 2019-2031
- 6.1. Market Analysis, Insights and Forecast - by Application
- 6.1.1. Liquor and Wine Bottles
- 6.1.2. Daily Packaging Glass Bottles
- 6.1.3. Condiment Bottles
- 6.1.4. Glass Jars for Canning
- 6.1.5. Medicine Bottles
- 6.1.6. Chemical Reagent Bottles
- 6.1.7. Others
- 6.2. Market Analysis, Insights and Forecast - by Types
- 6.2.1. ≤ 10ml
- 6.2.2. 10-200ml
- 6.2.3. 200-500ml
- 6.2.4. 500-1000ml
- 6.2.5. > 1000ml
- 6.1. Market Analysis, Insights and Forecast - by Application
- 7. South America Glass Bottles and Glass Packaging Analysis, Insights and Forecast, 2019-2031
- 7.1. Market Analysis, Insights and Forecast - by Application
- 7.1.1. Liquor and Wine Bottles
- 7.1.2. Daily Packaging Glass Bottles
- 7.1.3. Condiment Bottles
- 7.1.4. Glass Jars for Canning
- 7.1.5. Medicine Bottles
- 7.1.6. Chemical Reagent Bottles
- 7.1.7. Others
- 7.2. Market Analysis, Insights and Forecast - by Types
- 7.2.1. ≤ 10ml
- 7.2.2. 10-200ml
- 7.2.3. 200-500ml
- 7.2.4. 500-1000ml
- 7.2.5. > 1000ml
- 7.1. Market Analysis, Insights and Forecast - by Application
- 8. Europe Glass Bottles and Glass Packaging Analysis, Insights and Forecast, 2019-2031
- 8.1. Market Analysis, Insights and Forecast - by Application
- 8.1.1. Liquor and Wine Bottles
- 8.1.2. Daily Packaging Glass Bottles
- 8.1.3. Condiment Bottles
- 8.1.4. Glass Jars for Canning
- 8.1.5. Medicine Bottles
- 8.1.6. Chemical Reagent Bottles
- 8.1.7. Others
- 8.2. Market Analysis, Insights and Forecast - by Types
- 8.2.1. ≤ 10ml
- 8.2.2. 10-200ml
- 8.2.3. 200-500ml
- 8.2.4. 500-1000ml
- 8.2.5. > 1000ml
- 8.1. Market Analysis, Insights and Forecast - by Application
- 9. Middle East & Africa Glass Bottles and Glass Packaging Analysis, Insights and Forecast, 2019-2031
- 9.1. Market Analysis, Insights and Forecast - by Application
- 9.1.1. Liquor and Wine Bottles
- 9.1.2. Daily Packaging Glass Bottles
- 9.1.3. Condiment Bottles
- 9.1.4. Glass Jars for Canning
- 9.1.5. Medicine Bottles
- 9.1.6. Chemical Reagent Bottles
- 9.1.7. Others
- 9.2. Market Analysis, Insights and Forecast - by Types
- 9.2.1. ≤ 10ml
- 9.2.2. 10-200ml
- 9.2.3. 200-500ml
- 9.2.4. 500-1000ml
- 9.2.5. > 1000ml
- 9.1. Market Analysis, Insights and Forecast - by Application
- 10. Asia Pacific Glass Bottles and Glass Packaging Analysis, Insights and Forecast, 2019-2031
- 10.1. Market Analysis, Insights and Forecast - by Application
- 10.1.1. Liquor and Wine Bottles
- 10.1.2. Daily Packaging Glass Bottles
- 10.1.3. Condiment Bottles
- 10.1.4. Glass Jars for Canning
- 10.1.5. Medicine Bottles
- 10.1.6. Chemical Reagent Bottles
- 10.1.7. Others
- 10.2. Market Analysis, Insights and Forecast - by Types
- 10.2.1. ≤ 10ml
- 10.2.2. 10-200ml
- 10.2.3. 200-500ml
- 10.2.4. 500-1000ml
- 10.2.5. > 1000ml
- 10.1. Market Analysis, Insights and Forecast - by Application
- 11. Competitive Analysis
- 11.1. Global Market Share Analysis 2024
- 11.2. Company Profiles
- 11.2.1 Owens-Illinois
- 11.2.1.1. Overview
- 11.2.1.2. Products
- 11.2.1.3. SWOT Analysis
- 11.2.1.4. Recent Developments
- 11.2.1.5. Financials (Based on Availability)
- 11.2.2 Vidrala
- 11.2.2.1. Overview
- 11.2.2.2. Products
- 11.2.2.3. SWOT Analysis
- 11.2.2.4. Recent Developments
- 11.2.2.5. Financials (Based on Availability)
- 11.2.3 Ardagh Group
- 11.2.3.1. Overview
- 11.2.3.2. Products
- 11.2.3.3. SWOT Analysis
- 11.2.3.4. Recent Developments
- 11.2.3.5. Financials (Based on Availability)
- 11.2.4 Vitro packaging
- 11.2.4.1. Overview
- 11.2.4.2. Products
- 11.2.4.3. SWOT Analysis
- 11.2.4.4. Recent Developments
- 11.2.4.5. Financials (Based on Availability)
- 11.2.5 Consol Glass
- 11.2.5.1. Overview
- 11.2.5.2. Products
- 11.2.5.3. SWOT Analysis
- 11.2.5.4. Recent Developments
- 11.2.5.5. Financials (Based on Availability)
- 11.2.6 Zignago Vetro Group
- 11.2.6.1. Overview
- 11.2.6.2. Products
- 11.2.6.3. SWOT Analysis
- 11.2.6.4. Recent Developments
- 11.2.6.5. Financials (Based on Availability)
- 11.2.7 Vetropack Group
- 11.2.7.1. Overview
- 11.2.7.2. Products
- 11.2.7.3. SWOT Analysis
- 11.2.7.4. Recent Developments
- 11.2.7.5. Financials (Based on Availability)
- 11.2.8 Guangdong Huaxing
- 11.2.8.1. Overview
- 11.2.8.2. Products
- 11.2.8.3. SWOT Analysis
- 11.2.8.4. Recent Developments
- 11.2.8.5. Financials (Based on Availability)
- 11.2.9 Yucai Group
- 11.2.9.1. Overview
- 11.2.9.2. Products
- 11.2.9.3. SWOT Analysis
- 11.2.9.4. Recent Developments
- 11.2.9.5. Financials (Based on Availability)
- 11.2.10 Cangzhou Xingchen Glass
- 11.2.10.1. Overview
- 11.2.10.2. Products
- 11.2.10.3. SWOT Analysis
- 11.2.10.4. Recent Developments
- 11.2.10.5. Financials (Based on Availability)
- 11.2.11 Cangzhou Four Stars Glass
- 11.2.11.1. Overview
- 11.2.11.2. Products
- 11.2.11.3. SWOT Analysis
- 11.2.11.4. Recent Developments
- 11.2.11.5. Financials (Based on Availability)
- 11.2.12 Shandong Huapeng Glass
- 11.2.12.1. Overview
- 11.2.12.2. Products
- 11.2.12.3. SWOT Analysis
- 11.2.12.4. Recent Developments
- 11.2.12.5. Financials (Based on Availability)
- 11.2.13 HEINZ-GLAS
- 11.2.13.1. Overview
- 11.2.13.2. Products
- 11.2.13.3. SWOT Analysis
- 11.2.13.4. Recent Developments
- 11.2.13.5. Financials (Based on Availability)
- 11.2.14 Piramal Glass
- 11.2.14.1. Overview
- 11.2.14.2. Products
- 11.2.14.3. SWOT Analysis
- 11.2.14.4. Recent Developments
- 11.2.14.5. Financials (Based on Availability)
- 11.2.15 SAVERGLASS Group
- 11.2.15.1. Overview
- 11.2.15.2. Products
- 11.2.15.3. SWOT Analysis
- 11.2.15.4. Recent Developments
- 11.2.15.5. Financials (Based on Availability)
- 11.2.16 Bormioli Luigi
- 11.2.16.1. Overview
- 11.2.16.2. Products
- 11.2.16.3. SWOT Analysis
- 11.2.16.4. Recent Developments
- 11.2.16.5. Financials (Based on Availability)
- 11.2.17 Stoelzle Glass Group
- 11.2.17.1. Overview
- 11.2.17.2. Products
- 11.2.17.3. SWOT Analysis
- 11.2.17.4. Recent Developments
- 11.2.17.5. Financials (Based on Availability)
- 11.2.18 Carib Glassworks Limited
- 11.2.18.1. Overview
- 11.2.18.2. Products
- 11.2.18.3. SWOT Analysis
- 11.2.18.4. Recent Developments
- 11.2.18.5. Financials (Based on Availability)
- 11.2.19 Gerresheimer
- 11.2.19.1. Overview
- 11.2.19.2. Products
- 11.2.19.3. SWOT Analysis
- 11.2.19.4. Recent Developments
- 11.2.19.5. Financials (Based on Availability)
- 11.2.20 Toyo Glass
- 11.2.20.1. Overview
- 11.2.20.2. Products
- 11.2.20.3. SWOT Analysis
- 11.2.20.4. Recent Developments
- 11.2.20.5. Financials (Based on Availability)
- 11.2.1 Owens-Illinois
List of Figures
- Figure 1: Global Glass Bottles and Glass Packaging Revenue Breakdown (million, %) by Region 2024 & 2032
- Figure 2: North America Glass Bottles and Glass Packaging Revenue (million), by Application 2024 & 2032
- Figure 3: North America Glass Bottles and Glass Packaging Revenue Share (%), by Application 2024 & 2032
- Figure 4: North America Glass Bottles and Glass Packaging Revenue (million), by Types 2024 & 2032
- Figure 5: North America Glass Bottles and Glass Packaging Revenue Share (%), by Types 2024 & 2032
- Figure 6: North America Glass Bottles and Glass Packaging Revenue (million), by Country 2024 & 2032
- Figure 7: North America Glass Bottles and Glass Packaging Revenue Share (%), by Country 2024 & 2032
- Figure 8: South America Glass Bottles and Glass Packaging Revenue (million), by Application 2024 & 2032
- Figure 9: South America Glass Bottles and Glass Packaging Revenue Share (%), by Application 2024 & 2032
- Figure 10: South America Glass Bottles and Glass Packaging Revenue (million), by Types 2024 & 2032
- Figure 11: South America Glass Bottles and Glass Packaging Revenue Share (%), by Types 2024 & 2032
- Figure 12: South America Glass Bottles and Glass Packaging Revenue (million), by Country 2024 & 2032
- Figure 13: South America Glass Bottles and Glass Packaging Revenue Share (%), by Country 2024 & 2032
- Figure 14: Europe Glass Bottles and Glass Packaging Revenue (million), by Application 2024 & 2032
- Figure 15: Europe Glass Bottles and Glass Packaging Revenue Share (%), by Application 2024 & 2032
- Figure 16: Europe Glass Bottles and Glass Packaging Revenue (million), by Types 2024 & 2032
- Figure 17: Europe Glass Bottles and Glass Packaging Revenue Share (%), by Types 2024 & 2032
- Figure 18: Europe Glass Bottles and Glass Packaging Revenue (million), by Country 2024 & 2032
- Figure 19: Europe Glass Bottles and Glass Packaging Revenue Share (%), by Country 2024 & 2032
- Figure 20: Middle East & Africa Glass Bottles and Glass Packaging Revenue (million), by Application 2024 & 2032
- Figure 21: Middle East & Africa Glass Bottles and Glass Packaging Revenue Share (%), by Application 2024 & 2032
- Figure 22: Middle East & Africa Glass Bottles and Glass Packaging Revenue (million), by Types 2024 & 2032
- Figure 23: Middle East & Africa Glass Bottles and Glass Packaging Revenue Share (%), by Types 2024 & 2032
- Figure 24: Middle East & Africa Glass Bottles and Glass Packaging Revenue (million), by Country 2024 & 2032
- Figure 25: Middle East & Africa Glass Bottles and Glass Packaging Revenue Share (%), by Country 2024 & 2032
- Figure 26: Asia Pacific Glass Bottles and Glass Packaging Revenue (million), by Application 2024 & 2032
- Figure 27: Asia Pacific Glass Bottles and Glass Packaging Revenue Share (%), by Application 2024 & 2032
- Figure 28: Asia Pacific Glass Bottles and Glass Packaging Revenue (million), by Types 2024 & 2032
- Figure 29: Asia Pacific Glass Bottles and Glass Packaging Revenue Share (%), by Types 2024 & 2032
- Figure 30: Asia Pacific Glass Bottles and Glass Packaging Revenue (million), by Country 2024 & 2032
- Figure 31: Asia Pacific Glass Bottles and Glass Packaging Revenue Share (%), by Country 2024 & 2032
List of Tables
- Table 1: Global Glass Bottles and Glass Packaging Revenue million Forecast, by Region 2019 & 2032
- Table 2: Global Glass Bottles and Glass Packaging Revenue million Forecast, by Application 2019 & 2032
- Table 3: Global Glass Bottles and Glass Packaging Revenue million Forecast, by Types 2019 & 2032
- Table 4: Global Glass Bottles and Glass Packaging Revenue million Forecast, by Region 2019 & 2032
- Table 5: Global Glass Bottles and Glass Packaging Revenue million Forecast, by Application 2019 & 2032
- Table 6: Global Glass Bottles and Glass Packaging Revenue million Forecast, by Types 2019 & 2032
- Table 7: Global Glass Bottles and Glass Packaging Revenue million Forecast, by Country 2019 & 2032
- Table 8: United States Glass Bottles and Glass Packaging Revenue (million) Forecast, by Application 2019 & 2032
- Table 9: Canada Glass Bottles and Glass Packaging Revenue (million) Forecast, by Application 2019 & 2032
- Table 10: Mexico Glass Bottles and Glass Packaging Revenue (million) Forecast, by Application 2019 & 2032
- Table 11: Global Glass Bottles and Glass Packaging Revenue million Forecast, by Application 2019 & 2032
- Table 12: Global Glass Bottles and Glass Packaging Revenue million Forecast, by Types 2019 & 2032
- Table 13: Global Glass Bottles and Glass Packaging Revenue million Forecast, by Country 2019 & 2032
- Table 14: Brazil Glass Bottles and Glass Packaging Revenue (million) Forecast, by Application 2019 & 2032
- Table 15: Argentina Glass Bottles and Glass Packaging Revenue (million) Forecast, by Application 2019 & 2032
- Table 16: Rest of South America Glass Bottles and Glass Packaging Revenue (million) Forecast, by Application 2019 & 2032
- Table 17: Global Glass Bottles and Glass Packaging Revenue million Forecast, by Application 2019 & 2032
- Table 18: Global Glass Bottles and Glass Packaging Revenue million Forecast, by Types 2019 & 2032
- Table 19: Global Glass Bottles and Glass Packaging Revenue million Forecast, by Country 2019 & 2032
- Table 20: United Kingdom Glass Bottles and Glass Packaging Revenue (million) Forecast, by Application 2019 & 2032
- Table 21: Germany Glass Bottles and Glass Packaging Revenue (million) Forecast, by Application 2019 & 2032
- Table 22: France Glass Bottles and Glass Packaging Revenue (million) Forecast, by Application 2019 & 2032
- Table 23: Italy Glass Bottles and Glass Packaging Revenue (million) Forecast, by Application 2019 & 2032
- Table 24: Spain Glass Bottles and Glass Packaging Revenue (million) Forecast, by Application 2019 & 2032
- Table 25: Russia Glass Bottles and Glass Packaging Revenue (million) Forecast, by Application 2019 & 2032
- Table 26: Benelux Glass Bottles and Glass Packaging Revenue (million) Forecast, by Application 2019 & 2032
- Table 27: Nordics Glass Bottles and Glass Packaging Revenue (million) Forecast, by Application 2019 & 2032
- Table 28: Rest of Europe Glass Bottles and Glass Packaging Revenue (million) Forecast, by Application 2019 & 2032
- Table 29: Global Glass Bottles and Glass Packaging Revenue million Forecast, by Application 2019 & 2032
- Table 30: Global Glass Bottles and Glass Packaging Revenue million Forecast, by Types 2019 & 2032
- Table 31: Global Glass Bottles and Glass Packaging Revenue million Forecast, by Country 2019 & 2032
- Table 32: Turkey Glass Bottles and Glass Packaging Revenue (million) Forecast, by Application 2019 & 2032
- Table 33: Israel Glass Bottles and Glass Packaging Revenue (million) Forecast, by Application 2019 & 2032
- Table 34: GCC Glass Bottles and Glass Packaging Revenue (million) Forecast, by Application 2019 & 2032
- Table 35: North Africa Glass Bottles and Glass Packaging Revenue (million) Forecast, by Application 2019 & 2032
- Table 36: South Africa Glass Bottles and Glass Packaging Revenue (million) Forecast, by Application 2019 & 2032
- Table 37: Rest of Middle East & Africa Glass Bottles and Glass Packaging Revenue (million) Forecast, by Application 2019 & 2032
- Table 38: Global Glass Bottles and Glass Packaging Revenue million Forecast, by Application 2019 & 2032
- Table 39: Global Glass Bottles and Glass Packaging Revenue million Forecast, by Types 2019 & 2032
- Table 40: Global Glass Bottles and Glass Packaging Revenue million Forecast, by Country 2019 & 2032
- Table 41: China Glass Bottles and Glass Packaging Revenue (million) Forecast, by Application 2019 & 2032
- Table 42: India Glass Bottles and Glass Packaging Revenue (million) Forecast, by Application 2019 & 2032
- Table 43: Japan Glass Bottles and Glass Packaging Revenue (million) Forecast, by Application 2019 & 2032
- Table 44: South Korea Glass Bottles and Glass Packaging Revenue (million) Forecast, by Application 2019 & 2032
- Table 45: ASEAN Glass Bottles and Glass Packaging Revenue (million) Forecast, by Application 2019 & 2032
- Table 46: Oceania Glass Bottles and Glass Packaging Revenue (million) Forecast, by Application 2019 & 2032
- Table 47: Rest of Asia Pacific Glass Bottles and Glass Packaging Revenue (million) Forecast, by Application 2019 & 2032
Frequently Asked Questions
1. What is the projected Compound Annual Growth Rate (CAGR) of the Glass Bottles and Glass Packaging?
The projected CAGR is approximately XX%.
2. Which companies are prominent players in the Glass Bottles and Glass Packaging?
Key companies in the market include Owens-Illinois, Vidrala, Ardagh Group, Vitro packaging, Consol Glass, Zignago Vetro Group, Vetropack Group, Guangdong Huaxing, Yucai Group, Cangzhou Xingchen Glass, Cangzhou Four Stars Glass, Shandong Huapeng Glass, HEINZ-GLAS, Piramal Glass, SAVERGLASS Group, Bormioli Luigi, Stoelzle Glass Group, Carib Glassworks Limited, Gerresheimer, Toyo Glass.
3. What are the main segments of the Glass Bottles and Glass Packaging?
The market segments include Application, Types.
4. Can you provide details about the market size?
The market size is estimated to be USD XXX million as of 2022.
5. What are some drivers contributing to market growth?
N/A
6. What are the notable trends driving market growth?
N/A
7. Are there any restraints impacting market growth?
N/A
8. Can you provide examples of recent developments in the market?
N/A
9. What pricing options are available for accessing the report?
Pricing options include single-user, multi-user, and enterprise licenses priced at USD 5600.00, USD 8400.00, and USD 11200.00 respectively.
10. Is the market size provided in terms of value or volume?
The market size is provided in terms of value, measured in million.
11. Are there any specific market keywords associated with the report?
Yes, the market keyword associated with the report is "Glass Bottles and Glass Packaging," which aids in identifying and referencing the specific market segment covered.
12. How do I determine which pricing option suits my needs best?
The pricing options vary based on user requirements and access needs. Individual users may opt for single-user licenses, while businesses requiring broader access may choose multi-user or enterprise licenses for cost-effective access to the report.
13. Are there any additional resources or data provided in the Glass Bottles and Glass Packaging report?
While the report offers comprehensive insights, it's advisable to review the specific contents or supplementary materials provided to ascertain if additional resources or data are available.
14. How can I stay updated on further developments or reports in the Glass Bottles and Glass Packaging?
To stay informed about further developments, trends, and reports in the Glass Bottles and Glass Packaging, consider subscribing to industry newsletters, following relevant companies and organizations, or regularly checking reputable industry news sources and publications.
Methodology
Step 1 - Identification of Relevant Samples Size from Population Database


Step 2 - Approaches for Defining Global Market Size (Value, Volume* & Price*)

Note*: In applicable scenarios
Step 3 - Data Sources
Primary Research
- Web Analytics
- Survey Reports
- Research Institute
- Latest Research Reports
- Opinion Leaders
Secondary Research
- Annual Reports
- White Paper
- Latest Press Release
- Industry Association
- Paid Database
- Investor Presentations

Step 4 - Data Triangulation
Involves using different sources of information in order to increase the validity of a study
These sources are likely to be stakeholders in a program - participants, other researchers, program staff, other community members, and so on.
Then we put all data in single framework & apply various statistical tools to find out the dynamic on the market.
During the analysis stage, feedback from the stakeholder groups would be compared to determine areas of agreement as well as areas of divergence


