
Key Insights
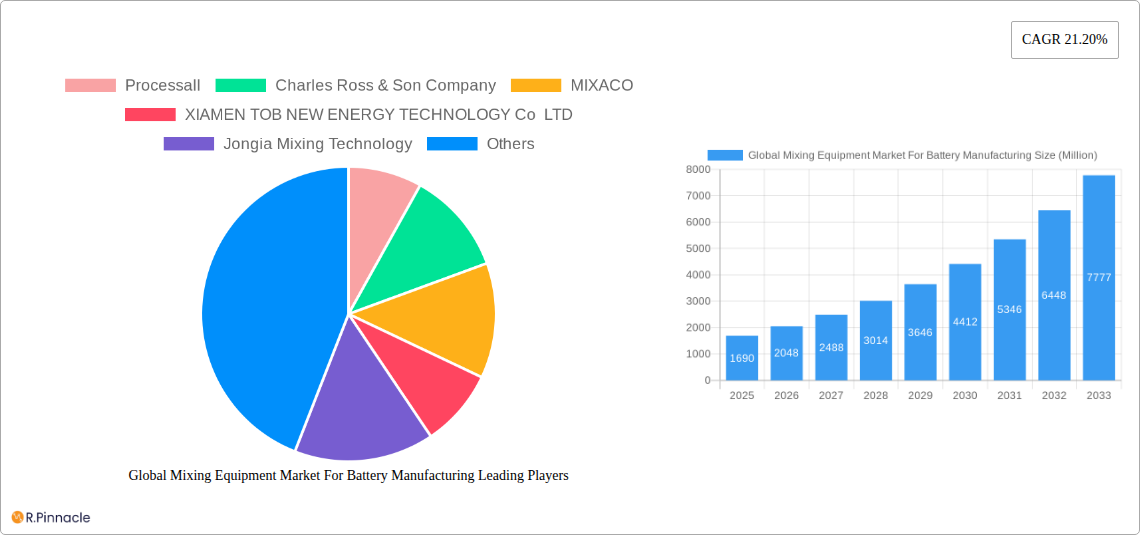
The global market for mixing equipment in battery manufacturing is experiencing robust growth, projected to reach \$1.69 billion in 2025 and expand at a Compound Annual Growth Rate (CAGR) of 21.20% from 2025 to 2033. This surge is primarily driven by the booming electric vehicle (EV) industry and the increasing demand for energy storage solutions. Technological advancements leading to higher efficiency and precision in mixing processes, coupled with the rising adoption of automation in battery production lines, are further fueling market expansion. The market is segmented by mixer type, with wet mixers and dry mixers holding significant shares, reflecting the diverse needs of various battery chemistries and manufacturing processes. Key players such as Processall, Charles Ross & Son Company, and MIXACO are leveraging technological innovations and strategic partnerships to consolidate their market positions. Geographic expansion is also a prominent trend, with regions like Asia Pacific (particularly China and South Korea) experiencing rapid growth due to the concentration of battery manufacturing hubs and government initiatives promoting EV adoption. However, challenges remain, including the fluctuating prices of raw materials and the complexities associated with integrating advanced mixing technologies into existing manufacturing infrastructure.
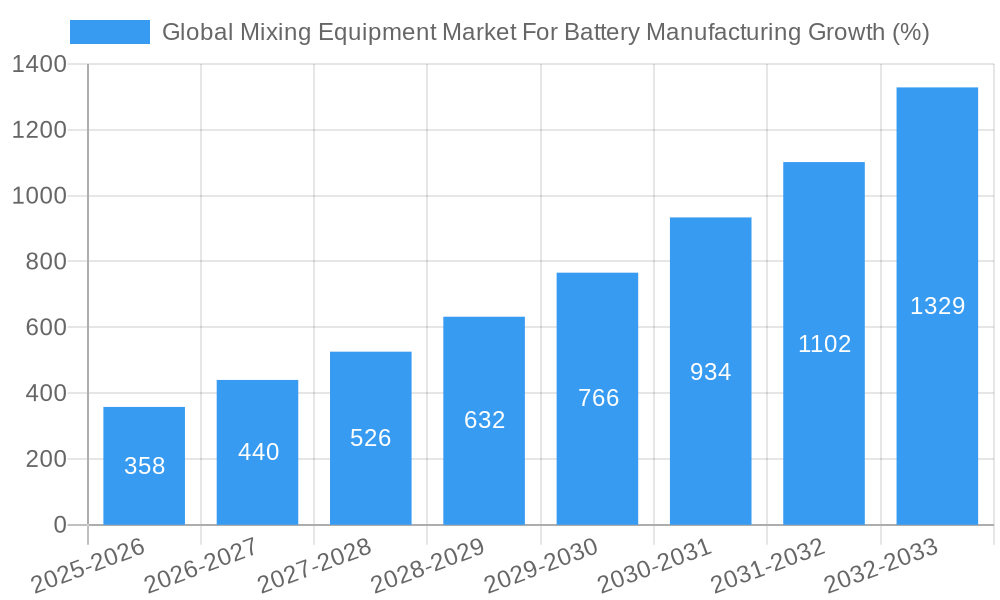
The forecast period (2025-2033) anticipates continued high growth, driven by the projected exponential increase in global EV sales and the development of next-generation battery technologies. The ongoing transition towards sustainable energy sources necessitates efficient and scalable battery production, positioning mixing equipment as a crucial component in this rapidly evolving landscape. Competition among manufacturers will likely intensify, focusing on innovation, cost optimization, and the provision of comprehensive solutions tailored to specific battery chemistries and production scales. The market's regional landscape will likely remain diverse, with growth concentrated in key manufacturing regions while other regions steadily adopt advanced battery technologies. Strategic alliances, mergers, and acquisitions are anticipated as companies strive to enhance their technological capabilities and expand their global footprint.
Global Mixing Equipment Market for Battery Manufacturing: A Comprehensive Report (2019-2033)
This in-depth report provides a comprehensive analysis of the global mixing equipment market for battery manufacturing, offering invaluable insights for industry professionals, investors, and strategic decision-makers. With a study period spanning 2019-2033, a base year of 2025, and a forecast period of 2025-2033, this report delivers actionable intelligence on market size, segmentation, key players, and future trends. The market is segmented by Type: Wet Mixers and Dry Mixers. The report projects a xx Million market value by 2033, presenting a detailed outlook across various regions and segments.
Global Mixing Equipment Market For Battery Manufacturing Market Structure & Innovation Trends
The global mixing equipment market for battery manufacturing exhibits a moderately consolidated structure, with several key players holding significant market share. Processall, Charles Ross & Son Company, MIXACO, and others command a substantial portion of the market, while numerous smaller players cater to niche segments. The market share distribution is dynamic, influenced by technological advancements and strategic acquisitions. Market concentration is expected to remain relatively stable through 2033, although strategic M&A activities could lead to shifts in market dominance. Innovation is a key driver, focusing on improving mixing efficiency, reducing energy consumption, and enhancing the quality and consistency of battery materials. Stringent regulatory frameworks regarding battery safety and environmental standards significantly impact market dynamics. The increasing demand for high-performance batteries fuels the adoption of advanced mixing technologies. Substitutes for current mixing equipment are limited due to the specific requirements of battery material processing. End-users are primarily battery manufacturers spanning diverse automotive, energy storage, and portable electronics sectors. Significant M&A deals have been observed, with estimated values in the xx Million range over the past five years.
- Market Concentration: Moderately consolidated, with top players commanding xx% market share (2025).
- Innovation Drivers: Enhanced mixing efficiency, reduced energy consumption, improved material quality.
- Regulatory Frameworks: Stringent safety and environmental regulations impacting technology adoption.
- Product Substitutes: Limited viable alternatives due to specialized requirements.
- End-User Demographics: Primarily large-scale battery manufacturers.
- M&A Activity: Significant activity observed, with deal values exceeding xx Million in recent years.
Global Mixing Equipment Market For Battery Manufacturing Market Dynamics & Trends
The global mixing equipment market for battery manufacturing is experiencing robust growth, driven by the exponential rise in demand for electric vehicles (EVs) and energy storage systems (ESS). The market is characterized by a healthy CAGR of xx% during the forecast period (2025-2033), reflecting strong growth in the battery industry. Technological disruptions, particularly in automation and process optimization, are significantly influencing market dynamics. Consumer preferences for high-performance, longer-lasting batteries further enhance market growth. Competitive dynamics are intense, with established players continually innovating and new entrants seeking market share. Market penetration of advanced mixing technologies is steadily increasing, with xx% of the market adopting these technologies by 2033. Several factors, such as the increasing adoption of lithium-ion batteries, government incentives for EVs, and improvements in battery energy density are contributing to the expansion of the market.
Dominant Regions & Segments in Global Mixing Equipment Market For Battery Manufacturing
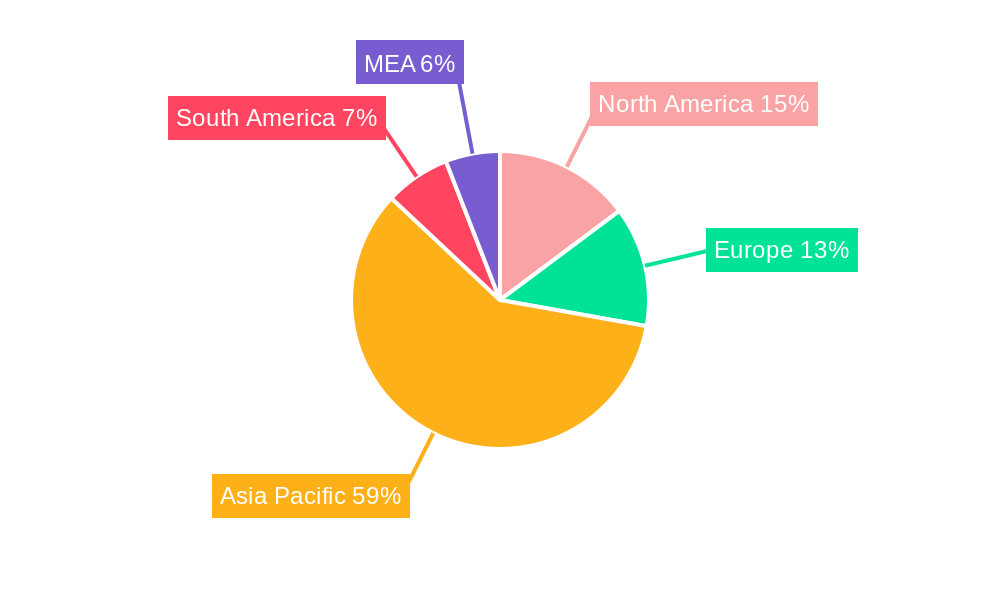
Asia-Pacific currently dominates the global mixing equipment market for battery manufacturing, driven by the region's significant presence in battery manufacturing hubs and robust growth in the EV sector. China, in particular, stands out as a major driver.
- Key Drivers in Asia-Pacific:
- Rapid growth of the EV industry.
- Government support for battery manufacturing and renewable energy.
- Presence of major battery manufacturers.
- Significant investments in battery research and development.
Within the product type segment, Wet Mixers hold a larger market share compared to Dry Mixers due to the prevalent usage of wet processes in battery production. The dominance is attributed to the suitability of wet mixing for the production of high-quality electrode slurries and other essential components.
Global Mixing Equipment Market For Battery Manufacturing Product Innovations
Recent innovations focus on high-shear mixers, vacuum mixers, and automated systems designed for improved slurry homogeneity and precision. These advancements enhance the quality and consistency of battery materials while increasing production efficiency. This improves energy density, battery life, and overall performance. Competitive advantages lie in superior mixing technology, automation capabilities, and tailored solutions for specific battery chemistries.
Report Scope & Segmentation Analysis
Wet Mixers: This segment is projected to witness significant growth, driven by the increasing demand for high-performance batteries. The market size is estimated at xx Million in 2025, expected to reach xx Million by 2033. Competitive dynamics are characterized by intense rivalry among established players and emerging companies.
Dry Mixers: This segment is anticipated to show moderate growth, driven by increasing adoption in certain battery chemistries and processes. The market size in 2025 is estimated at xx Million and is forecasted to reach xx Million by 2033. Competitive landscape in this segment is relatively less concentrated than the Wet Mixers segment.
Key Drivers of Global Mixing Equipment Market For Battery Manufacturing Growth
The growth of the global mixing equipment market is propelled by several key factors: the booming electric vehicle (EV) industry, escalating demand for energy storage solutions, government incentives promoting renewable energy, and continuous advancements in battery technology. These factors collectively contribute to increased production volumes, leading to higher demand for specialized mixing equipment.
Challenges in the Global Mixing Equipment Market For Battery Manufacturing Sector
The market faces challenges such as fluctuating raw material prices, supply chain disruptions impacting component availability, and intense competition among established and emerging players. Stringent safety and environmental regulations increase manufacturing complexities and costs. Furthermore, the high capital investment required for advanced equipment might hinder small-scale manufacturers from entering the market.
Emerging Opportunities in Global Mixing Equipment Market For Battery Manufacturing
The market offers significant opportunities in developing countries with growing EV adoption. The integration of Industry 4.0 technologies, such as AI and IoT, presents avenues for enhanced automation and process optimization. Research and development focusing on next-generation battery chemistries will also fuel innovation and demand for specialized mixing equipment.
Leading Players in the Global Mixing Equipment Market For Battery Manufacturing Market
- Processall
- Charles Ross & Son Company
- MIXACO
- XIAMEN TOB NEW ENERGY TECHNOLOGY Co LTD
- Jongia Mixing Technology
- ONGOAL
- IKA India Private Limited
- SIEHE GROUP
- SCM GROUP LIMITED HK
- Xiamen Tmax Battery Equipments Limited
Key Developments in Global Mixing Equipment Market For Battery Manufacturing Industry
September 2023: Fraunhofer Research Institution for Battery Cell Production utilized a 30-millimeter extruder at its new R&D site in Münster, Germany, showcasing advancements in electrode processing technologies. Fraunhofer-Gesellschaft is also building a high-throughput test facility, signaling potential for future market expansion.
May 2023: ONGOAL TECH showcased its cutting-edge battery slurry mixing and material production line models at The Battery Show Europe 2023, highlighting the increasing sophistication of available mixing solutions.
Future Outlook for Global Mixing Equipment Market For Battery Manufacturing Market
The global mixing equipment market for battery manufacturing is poised for continued strong growth, driven by the ongoing expansion of the EV sector and increasing demand for energy storage solutions. Strategic partnerships, technological innovation, and expansion into new geographical markets will present key opportunities for market players. The market is expected to witness further consolidation as leading players strive for global dominance.
Global Mixing Equipment Market For Battery Manufacturing Segmentation
-
1. Type
- 1.1. Wet Mixers
- 1.2. Dry Mixers
Global Mixing Equipment Market For Battery Manufacturing Segmentation By Geography
-
1. North America
- 1.1. United States
- 1.2. Canada
- 1.3. Rest of North America
-
2. Europe
- 2.1. Germany
- 2.2. France
- 2.3. United Kingdom
- 2.4. Italy
- 2.5. Spain
- 2.6. NORDIC
- 2.7. Turkey
- 2.8. Russia
- 2.9. Rest of Europe
-
3. Asia Pacific
- 3.1. China
- 3.2. India
- 3.3. Australia
- 3.4. Japan
- 3.5. Malaysia
- 3.6. Thailand
- 3.7. Indonesia
- 3.8. Vietnam
- 3.9. Rest of Asia Pacific
-
4. Middle East and Africa
- 4.1. Saudi Arabia
- 4.2. United Arab Emirates
- 4.3. Qatar
- 4.4. Egypt
- 4.5. Nigeria
- 4.6. South Africa
- 4.7. Rest of Middle East and Africa
-
5. South America
- 5.1. Brazil
- 5.2. Argentina
- 5.3. Columbia
- 5.4. Rest of South America
Global Mixing Equipment Market For Battery Manufacturing REPORT HIGHLIGHTS
| Aspects | Details |
|---|---|
| Study Period | 2019-2033 |
| Base Year | 2024 |
| Estimated Year | 2025 |
| Forecast Period | 2025-2033 |
| Historical Period | 2019-2024 |
| Growth Rate | CAGR of 21.20% from 2019-2033 |
| Segmentation |
|
Table of Contents
- 1. Introduction
- 1.1. Research Scope
- 1.2. Market Segmentation
- 1.3. Research Methodology
- 1.4. Definitions and Assumptions
- 2. Executive Summary
- 2.1. Introduction
- 3. Market Dynamics
- 3.1. Introduction
- 3.2. Market Drivers
- 3.2.1. 4.; The Increase in Investments to Enhance the Battery Production Capacity4.; Rising Adoption of Electric Vehicles
- 3.3. Market Restrains
- 3.3.1. 4.; The High Logistic Cost
- 3.4. Market Trends
- 3.4.1. Investments To Enhance the Battery Production Capacity is expected to Drive the Market Growth
- 4. Market Factor Analysis
- 4.1. Porters Five Forces
- 4.2. Supply/Value Chain
- 4.3. PESTEL analysis
- 4.4. Market Entropy
- 4.5. Patent/Trademark Analysis
- 5. Global Mixing Equipment Market For Battery Manufacturing Analysis, Insights and Forecast, 2019-2031
- 5.1. Market Analysis, Insights and Forecast - by Type
- 5.1.1. Wet Mixers
- 5.1.2. Dry Mixers
- 5.2. Market Analysis, Insights and Forecast - by Region
- 5.2.1. North America
- 5.2.2. Europe
- 5.2.3. Asia Pacific
- 5.2.4. Middle East and Africa
- 5.2.5. South America
- 5.1. Market Analysis, Insights and Forecast - by Type
- 6. North America Global Mixing Equipment Market For Battery Manufacturing Analysis, Insights and Forecast, 2019-2031
- 6.1. Market Analysis, Insights and Forecast - by Type
- 6.1.1. Wet Mixers
- 6.1.2. Dry Mixers
- 6.1. Market Analysis, Insights and Forecast - by Type
- 7. Europe Global Mixing Equipment Market For Battery Manufacturing Analysis, Insights and Forecast, 2019-2031
- 7.1. Market Analysis, Insights and Forecast - by Type
- 7.1.1. Wet Mixers
- 7.1.2. Dry Mixers
- 7.1. Market Analysis, Insights and Forecast - by Type
- 8. Asia Pacific Global Mixing Equipment Market For Battery Manufacturing Analysis, Insights and Forecast, 2019-2031
- 8.1. Market Analysis, Insights and Forecast - by Type
- 8.1.1. Wet Mixers
- 8.1.2. Dry Mixers
- 8.1. Market Analysis, Insights and Forecast - by Type
- 9. Middle East and Africa Global Mixing Equipment Market For Battery Manufacturing Analysis, Insights and Forecast, 2019-2031
- 9.1. Market Analysis, Insights and Forecast - by Type
- 9.1.1. Wet Mixers
- 9.1.2. Dry Mixers
- 9.1. Market Analysis, Insights and Forecast - by Type
- 10. South America Global Mixing Equipment Market For Battery Manufacturing Analysis, Insights and Forecast, 2019-2031
- 10.1. Market Analysis, Insights and Forecast - by Type
- 10.1.1. Wet Mixers
- 10.1.2. Dry Mixers
- 10.1. Market Analysis, Insights and Forecast - by Type
- 11. North America Global Mixing Equipment Market For Battery Manufacturing Analysis, Insights and Forecast, 2019-2031
- 11.1. Market Analysis, Insights and Forecast - By Country/Sub-region
- 11.1.1 United States
- 11.1.2 Canada
- 11.1.3 Mexico
- 12. Europe Global Mixing Equipment Market For Battery Manufacturing Analysis, Insights and Forecast, 2019-2031
- 12.1. Market Analysis, Insights and Forecast - By Country/Sub-region
- 12.1.1 Germany
- 12.1.2 United Kingdom
- 12.1.3 France
- 12.1.4 Spain
- 12.1.5 Italy
- 12.1.6 Spain
- 12.1.7 Belgium
- 12.1.8 Netherland
- 12.1.9 Nordics
- 12.1.10 Rest of Europe
- 13. Asia Pacific Global Mixing Equipment Market For Battery Manufacturing Analysis, Insights and Forecast, 2019-2031
- 13.1. Market Analysis, Insights and Forecast - By Country/Sub-region
- 13.1.1 China
- 13.1.2 Japan
- 13.1.3 India
- 13.1.4 South Korea
- 13.1.5 Southeast Asia
- 13.1.6 Australia
- 13.1.7 Indonesia
- 13.1.8 Phillipes
- 13.1.9 Singapore
- 13.1.10 Thailandc
- 13.1.11 Rest of Asia Pacific
- 14. South America Global Mixing Equipment Market For Battery Manufacturing Analysis, Insights and Forecast, 2019-2031
- 14.1. Market Analysis, Insights and Forecast - By Country/Sub-region
- 14.1.1 Brazil
- 14.1.2 Argentina
- 14.1.3 Peru
- 14.1.4 Chile
- 14.1.5 Colombia
- 14.1.6 Ecuador
- 14.1.7 Venezuela
- 14.1.8 Rest of South America
- 15. MEA Global Mixing Equipment Market For Battery Manufacturing Analysis, Insights and Forecast, 2019-2031
- 15.1. Market Analysis, Insights and Forecast - By Country/Sub-region
- 15.1.1 United Arab Emirates
- 15.1.2 Saudi Arabia
- 15.1.3 South Africa
- 15.1.4 Rest of Middle East and Africa
- 16. Competitive Analysis
- 16.1. Market Share Analysis 2024
- 16.2. Company Profiles
- 16.2.1 Processall
- 16.2.1.1. Overview
- 16.2.1.2. Products
- 16.2.1.3. SWOT Analysis
- 16.2.1.4. Recent Developments
- 16.2.1.5. Financials (Based on Availability)
- 16.2.2 Charles Ross & Son Company
- 16.2.2.1. Overview
- 16.2.2.2. Products
- 16.2.2.3. SWOT Analysis
- 16.2.2.4. Recent Developments
- 16.2.2.5. Financials (Based on Availability)
- 16.2.3 MIXACO
- 16.2.3.1. Overview
- 16.2.3.2. Products
- 16.2.3.3. SWOT Analysis
- 16.2.3.4. Recent Developments
- 16.2.3.5. Financials (Based on Availability)
- 16.2.4 XIAMEN TOB NEW ENERGY TECHNOLOGY Co LTD
- 16.2.4.1. Overview
- 16.2.4.2. Products
- 16.2.4.3. SWOT Analysis
- 16.2.4.4. Recent Developments
- 16.2.4.5. Financials (Based on Availability)
- 16.2.5 Jongia Mixing Technology
- 16.2.5.1. Overview
- 16.2.5.2. Products
- 16.2.5.3. SWOT Analysis
- 16.2.5.4. Recent Developments
- 16.2.5.5. Financials (Based on Availability)
- 16.2.6 ONGOAL
- 16.2.6.1. Overview
- 16.2.6.2. Products
- 16.2.6.3. SWOT Analysis
- 16.2.6.4. Recent Developments
- 16.2.6.5. Financials (Based on Availability)
- 16.2.7 IKA India Private Limited
- 16.2.7.1. Overview
- 16.2.7.2. Products
- 16.2.7.3. SWOT Analysis
- 16.2.7.4. Recent Developments
- 16.2.7.5. Financials (Based on Availability)
- 16.2.8 SIEHE GROUP
- 16.2.8.1. Overview
- 16.2.8.2. Products
- 16.2.8.3. SWOT Analysis
- 16.2.8.4. Recent Developments
- 16.2.8.5. Financials (Based on Availability)
- 16.2.9 SCM GROUP LIMITED HK
- 16.2.9.1. Overview
- 16.2.9.2. Products
- 16.2.9.3. SWOT Analysis
- 16.2.9.4. Recent Developments
- 16.2.9.5. Financials (Based on Availability)
- 16.2.10 Xiamen Tmax Battery Equipments Limited
- 16.2.10.1. Overview
- 16.2.10.2. Products
- 16.2.10.3. SWOT Analysis
- 16.2.10.4. Recent Developments
- 16.2.10.5. Financials (Based on Availability)
- 16.2.1 Processall
List of Figures
- Figure 1: Global Global Mixing Equipment Market For Battery Manufacturing Revenue Breakdown (Million, %) by Region 2024 & 2032
- Figure 2: Global Global Mixing Equipment Market For Battery Manufacturing Volume Breakdown (K Unit, %) by Region 2024 & 2032
- Figure 3: North America Global Mixing Equipment Market For Battery Manufacturing Revenue (Million), by Country 2024 & 2032
- Figure 4: North America Global Mixing Equipment Market For Battery Manufacturing Volume (K Unit), by Country 2024 & 2032
- Figure 5: North America Global Mixing Equipment Market For Battery Manufacturing Revenue Share (%), by Country 2024 & 2032
- Figure 6: North America Global Mixing Equipment Market For Battery Manufacturing Volume Share (%), by Country 2024 & 2032
- Figure 7: Europe Global Mixing Equipment Market For Battery Manufacturing Revenue (Million), by Country 2024 & 2032
- Figure 8: Europe Global Mixing Equipment Market For Battery Manufacturing Volume (K Unit), by Country 2024 & 2032
- Figure 9: Europe Global Mixing Equipment Market For Battery Manufacturing Revenue Share (%), by Country 2024 & 2032
- Figure 10: Europe Global Mixing Equipment Market For Battery Manufacturing Volume Share (%), by Country 2024 & 2032
- Figure 11: Asia Pacific Global Mixing Equipment Market For Battery Manufacturing Revenue (Million), by Country 2024 & 2032
- Figure 12: Asia Pacific Global Mixing Equipment Market For Battery Manufacturing Volume (K Unit), by Country 2024 & 2032
- Figure 13: Asia Pacific Global Mixing Equipment Market For Battery Manufacturing Revenue Share (%), by Country 2024 & 2032
- Figure 14: Asia Pacific Global Mixing Equipment Market For Battery Manufacturing Volume Share (%), by Country 2024 & 2032
- Figure 15: South America Global Mixing Equipment Market For Battery Manufacturing Revenue (Million), by Country 2024 & 2032
- Figure 16: South America Global Mixing Equipment Market For Battery Manufacturing Volume (K Unit), by Country 2024 & 2032
- Figure 17: South America Global Mixing Equipment Market For Battery Manufacturing Revenue Share (%), by Country 2024 & 2032
- Figure 18: South America Global Mixing Equipment Market For Battery Manufacturing Volume Share (%), by Country 2024 & 2032
- Figure 19: MEA Global Mixing Equipment Market For Battery Manufacturing Revenue (Million), by Country 2024 & 2032
- Figure 20: MEA Global Mixing Equipment Market For Battery Manufacturing Volume (K Unit), by Country 2024 & 2032
- Figure 21: MEA Global Mixing Equipment Market For Battery Manufacturing Revenue Share (%), by Country 2024 & 2032
- Figure 22: MEA Global Mixing Equipment Market For Battery Manufacturing Volume Share (%), by Country 2024 & 2032
- Figure 23: North America Global Mixing Equipment Market For Battery Manufacturing Revenue (Million), by Type 2024 & 2032
- Figure 24: North America Global Mixing Equipment Market For Battery Manufacturing Volume (K Unit), by Type 2024 & 2032
- Figure 25: North America Global Mixing Equipment Market For Battery Manufacturing Revenue Share (%), by Type 2024 & 2032
- Figure 26: North America Global Mixing Equipment Market For Battery Manufacturing Volume Share (%), by Type 2024 & 2032
- Figure 27: North America Global Mixing Equipment Market For Battery Manufacturing Revenue (Million), by Country 2024 & 2032
- Figure 28: North America Global Mixing Equipment Market For Battery Manufacturing Volume (K Unit), by Country 2024 & 2032
- Figure 29: North America Global Mixing Equipment Market For Battery Manufacturing Revenue Share (%), by Country 2024 & 2032
- Figure 30: North America Global Mixing Equipment Market For Battery Manufacturing Volume Share (%), by Country 2024 & 2032
- Figure 31: Europe Global Mixing Equipment Market For Battery Manufacturing Revenue (Million), by Type 2024 & 2032
- Figure 32: Europe Global Mixing Equipment Market For Battery Manufacturing Volume (K Unit), by Type 2024 & 2032
- Figure 33: Europe Global Mixing Equipment Market For Battery Manufacturing Revenue Share (%), by Type 2024 & 2032
- Figure 34: Europe Global Mixing Equipment Market For Battery Manufacturing Volume Share (%), by Type 2024 & 2032
- Figure 35: Europe Global Mixing Equipment Market For Battery Manufacturing Revenue (Million), by Country 2024 & 2032
- Figure 36: Europe Global Mixing Equipment Market For Battery Manufacturing Volume (K Unit), by Country 2024 & 2032
- Figure 37: Europe Global Mixing Equipment Market For Battery Manufacturing Revenue Share (%), by Country 2024 & 2032
- Figure 38: Europe Global Mixing Equipment Market For Battery Manufacturing Volume Share (%), by Country 2024 & 2032
- Figure 39: Asia Pacific Global Mixing Equipment Market For Battery Manufacturing Revenue (Million), by Type 2024 & 2032
- Figure 40: Asia Pacific Global Mixing Equipment Market For Battery Manufacturing Volume (K Unit), by Type 2024 & 2032
- Figure 41: Asia Pacific Global Mixing Equipment Market For Battery Manufacturing Revenue Share (%), by Type 2024 & 2032
- Figure 42: Asia Pacific Global Mixing Equipment Market For Battery Manufacturing Volume Share (%), by Type 2024 & 2032
- Figure 43: Asia Pacific Global Mixing Equipment Market For Battery Manufacturing Revenue (Million), by Country 2024 & 2032
- Figure 44: Asia Pacific Global Mixing Equipment Market For Battery Manufacturing Volume (K Unit), by Country 2024 & 2032
- Figure 45: Asia Pacific Global Mixing Equipment Market For Battery Manufacturing Revenue Share (%), by Country 2024 & 2032
- Figure 46: Asia Pacific Global Mixing Equipment Market For Battery Manufacturing Volume Share (%), by Country 2024 & 2032
- Figure 47: Middle East and Africa Global Mixing Equipment Market For Battery Manufacturing Revenue (Million), by Type 2024 & 2032
- Figure 48: Middle East and Africa Global Mixing Equipment Market For Battery Manufacturing Volume (K Unit), by Type 2024 & 2032
- Figure 49: Middle East and Africa Global Mixing Equipment Market For Battery Manufacturing Revenue Share (%), by Type 2024 & 2032
- Figure 50: Middle East and Africa Global Mixing Equipment Market For Battery Manufacturing Volume Share (%), by Type 2024 & 2032
- Figure 51: Middle East and Africa Global Mixing Equipment Market For Battery Manufacturing Revenue (Million), by Country 2024 & 2032
- Figure 52: Middle East and Africa Global Mixing Equipment Market For Battery Manufacturing Volume (K Unit), by Country 2024 & 2032
- Figure 53: Middle East and Africa Global Mixing Equipment Market For Battery Manufacturing Revenue Share (%), by Country 2024 & 2032
- Figure 54: Middle East and Africa Global Mixing Equipment Market For Battery Manufacturing Volume Share (%), by Country 2024 & 2032
- Figure 55: South America Global Mixing Equipment Market For Battery Manufacturing Revenue (Million), by Type 2024 & 2032
- Figure 56: South America Global Mixing Equipment Market For Battery Manufacturing Volume (K Unit), by Type 2024 & 2032
- Figure 57: South America Global Mixing Equipment Market For Battery Manufacturing Revenue Share (%), by Type 2024 & 2032
- Figure 58: South America Global Mixing Equipment Market For Battery Manufacturing Volume Share (%), by Type 2024 & 2032
- Figure 59: South America Global Mixing Equipment Market For Battery Manufacturing Revenue (Million), by Country 2024 & 2032
- Figure 60: South America Global Mixing Equipment Market For Battery Manufacturing Volume (K Unit), by Country 2024 & 2032
- Figure 61: South America Global Mixing Equipment Market For Battery Manufacturing Revenue Share (%), by Country 2024 & 2032
- Figure 62: South America Global Mixing Equipment Market For Battery Manufacturing Volume Share (%), by Country 2024 & 2032
List of Tables
- Table 1: Global Mixing Equipment Market For Battery Manufacturing Revenue Million Forecast, by Region 2019 & 2032
- Table 2: Global Mixing Equipment Market For Battery Manufacturing Volume K Unit Forecast, by Region 2019 & 2032
- Table 3: Global Mixing Equipment Market For Battery Manufacturing Revenue Million Forecast, by Type 2019 & 2032
- Table 4: Global Mixing Equipment Market For Battery Manufacturing Volume K Unit Forecast, by Type 2019 & 2032
- Table 5: Global Mixing Equipment Market For Battery Manufacturing Revenue Million Forecast, by Region 2019 & 2032
- Table 6: Global Mixing Equipment Market For Battery Manufacturing Volume K Unit Forecast, by Region 2019 & 2032
- Table 7: Global Mixing Equipment Market For Battery Manufacturing Revenue Million Forecast, by Country 2019 & 2032
- Table 8: Global Mixing Equipment Market For Battery Manufacturing Volume K Unit Forecast, by Country 2019 & 2032
- Table 9: United States Global Mixing Equipment Market For Battery Manufacturing Revenue (Million) Forecast, by Application 2019 & 2032
- Table 10: United States Global Mixing Equipment Market For Battery Manufacturing Volume (K Unit) Forecast, by Application 2019 & 2032
- Table 11: Canada Global Mixing Equipment Market For Battery Manufacturing Revenue (Million) Forecast, by Application 2019 & 2032
- Table 12: Canada Global Mixing Equipment Market For Battery Manufacturing Volume (K Unit) Forecast, by Application 2019 & 2032
- Table 13: Mexico Global Mixing Equipment Market For Battery Manufacturing Revenue (Million) Forecast, by Application 2019 & 2032
- Table 14: Mexico Global Mixing Equipment Market For Battery Manufacturing Volume (K Unit) Forecast, by Application 2019 & 2032
- Table 15: Global Mixing Equipment Market For Battery Manufacturing Revenue Million Forecast, by Country 2019 & 2032
- Table 16: Global Mixing Equipment Market For Battery Manufacturing Volume K Unit Forecast, by Country 2019 & 2032
- Table 17: Germany Global Mixing Equipment Market For Battery Manufacturing Revenue (Million) Forecast, by Application 2019 & 2032
- Table 18: Germany Global Mixing Equipment Market For Battery Manufacturing Volume (K Unit) Forecast, by Application 2019 & 2032
- Table 19: United Kingdom Global Mixing Equipment Market For Battery Manufacturing Revenue (Million) Forecast, by Application 2019 & 2032
- Table 20: United Kingdom Global Mixing Equipment Market For Battery Manufacturing Volume (K Unit) Forecast, by Application 2019 & 2032
- Table 21: France Global Mixing Equipment Market For Battery Manufacturing Revenue (Million) Forecast, by Application 2019 & 2032
- Table 22: France Global Mixing Equipment Market For Battery Manufacturing Volume (K Unit) Forecast, by Application 2019 & 2032
- Table 23: Spain Global Mixing Equipment Market For Battery Manufacturing Revenue (Million) Forecast, by Application 2019 & 2032
- Table 24: Spain Global Mixing Equipment Market For Battery Manufacturing Volume (K Unit) Forecast, by Application 2019 & 2032
- Table 25: Italy Global Mixing Equipment Market For Battery Manufacturing Revenue (Million) Forecast, by Application 2019 & 2032
- Table 26: Italy Global Mixing Equipment Market For Battery Manufacturing Volume (K Unit) Forecast, by Application 2019 & 2032
- Table 27: Spain Global Mixing Equipment Market For Battery Manufacturing Revenue (Million) Forecast, by Application 2019 & 2032
- Table 28: Spain Global Mixing Equipment Market For Battery Manufacturing Volume (K Unit) Forecast, by Application 2019 & 2032
- Table 29: Belgium Global Mixing Equipment Market For Battery Manufacturing Revenue (Million) Forecast, by Application 2019 & 2032
- Table 30: Belgium Global Mixing Equipment Market For Battery Manufacturing Volume (K Unit) Forecast, by Application 2019 & 2032
- Table 31: Netherland Global Mixing Equipment Market For Battery Manufacturing Revenue (Million) Forecast, by Application 2019 & 2032
- Table 32: Netherland Global Mixing Equipment Market For Battery Manufacturing Volume (K Unit) Forecast, by Application 2019 & 2032
- Table 33: Nordics Global Mixing Equipment Market For Battery Manufacturing Revenue (Million) Forecast, by Application 2019 & 2032
- Table 34: Nordics Global Mixing Equipment Market For Battery Manufacturing Volume (K Unit) Forecast, by Application 2019 & 2032
- Table 35: Rest of Europe Global Mixing Equipment Market For Battery Manufacturing Revenue (Million) Forecast, by Application 2019 & 2032
- Table 36: Rest of Europe Global Mixing Equipment Market For Battery Manufacturing Volume (K Unit) Forecast, by Application 2019 & 2032
- Table 37: Global Mixing Equipment Market For Battery Manufacturing Revenue Million Forecast, by Country 2019 & 2032
- Table 38: Global Mixing Equipment Market For Battery Manufacturing Volume K Unit Forecast, by Country 2019 & 2032
- Table 39: China Global Mixing Equipment Market For Battery Manufacturing Revenue (Million) Forecast, by Application 2019 & 2032
- Table 40: China Global Mixing Equipment Market For Battery Manufacturing Volume (K Unit) Forecast, by Application 2019 & 2032
- Table 41: Japan Global Mixing Equipment Market For Battery Manufacturing Revenue (Million) Forecast, by Application 2019 & 2032
- Table 42: Japan Global Mixing Equipment Market For Battery Manufacturing Volume (K Unit) Forecast, by Application 2019 & 2032
- Table 43: India Global Mixing Equipment Market For Battery Manufacturing Revenue (Million) Forecast, by Application 2019 & 2032
- Table 44: India Global Mixing Equipment Market For Battery Manufacturing Volume (K Unit) Forecast, by Application 2019 & 2032
- Table 45: South Korea Global Mixing Equipment Market For Battery Manufacturing Revenue (Million) Forecast, by Application 2019 & 2032
- Table 46: South Korea Global Mixing Equipment Market For Battery Manufacturing Volume (K Unit) Forecast, by Application 2019 & 2032
- Table 47: Southeast Asia Global Mixing Equipment Market For Battery Manufacturing Revenue (Million) Forecast, by Application 2019 & 2032
- Table 48: Southeast Asia Global Mixing Equipment Market For Battery Manufacturing Volume (K Unit) Forecast, by Application 2019 & 2032
- Table 49: Australia Global Mixing Equipment Market For Battery Manufacturing Revenue (Million) Forecast, by Application 2019 & 2032
- Table 50: Australia Global Mixing Equipment Market For Battery Manufacturing Volume (K Unit) Forecast, by Application 2019 & 2032
- Table 51: Indonesia Global Mixing Equipment Market For Battery Manufacturing Revenue (Million) Forecast, by Application 2019 & 2032
- Table 52: Indonesia Global Mixing Equipment Market For Battery Manufacturing Volume (K Unit) Forecast, by Application 2019 & 2032
- Table 53: Phillipes Global Mixing Equipment Market For Battery Manufacturing Revenue (Million) Forecast, by Application 2019 & 2032
- Table 54: Phillipes Global Mixing Equipment Market For Battery Manufacturing Volume (K Unit) Forecast, by Application 2019 & 2032
- Table 55: Singapore Global Mixing Equipment Market For Battery Manufacturing Revenue (Million) Forecast, by Application 2019 & 2032
- Table 56: Singapore Global Mixing Equipment Market For Battery Manufacturing Volume (K Unit) Forecast, by Application 2019 & 2032
- Table 57: Thailandc Global Mixing Equipment Market For Battery Manufacturing Revenue (Million) Forecast, by Application 2019 & 2032
- Table 58: Thailandc Global Mixing Equipment Market For Battery Manufacturing Volume (K Unit) Forecast, by Application 2019 & 2032
- Table 59: Rest of Asia Pacific Global Mixing Equipment Market For Battery Manufacturing Revenue (Million) Forecast, by Application 2019 & 2032
- Table 60: Rest of Asia Pacific Global Mixing Equipment Market For Battery Manufacturing Volume (K Unit) Forecast, by Application 2019 & 2032
- Table 61: Global Mixing Equipment Market For Battery Manufacturing Revenue Million Forecast, by Country 2019 & 2032
- Table 62: Global Mixing Equipment Market For Battery Manufacturing Volume K Unit Forecast, by Country 2019 & 2032
- Table 63: Brazil Global Mixing Equipment Market For Battery Manufacturing Revenue (Million) Forecast, by Application 2019 & 2032
- Table 64: Brazil Global Mixing Equipment Market For Battery Manufacturing Volume (K Unit) Forecast, by Application 2019 & 2032
- Table 65: Argentina Global Mixing Equipment Market For Battery Manufacturing Revenue (Million) Forecast, by Application 2019 & 2032
- Table 66: Argentina Global Mixing Equipment Market For Battery Manufacturing Volume (K Unit) Forecast, by Application 2019 & 2032
- Table 67: Peru Global Mixing Equipment Market For Battery Manufacturing Revenue (Million) Forecast, by Application 2019 & 2032
- Table 68: Peru Global Mixing Equipment Market For Battery Manufacturing Volume (K Unit) Forecast, by Application 2019 & 2032
- Table 69: Chile Global Mixing Equipment Market For Battery Manufacturing Revenue (Million) Forecast, by Application 2019 & 2032
- Table 70: Chile Global Mixing Equipment Market For Battery Manufacturing Volume (K Unit) Forecast, by Application 2019 & 2032
- Table 71: Colombia Global Mixing Equipment Market For Battery Manufacturing Revenue (Million) Forecast, by Application 2019 & 2032
- Table 72: Colombia Global Mixing Equipment Market For Battery Manufacturing Volume (K Unit) Forecast, by Application 2019 & 2032
- Table 73: Ecuador Global Mixing Equipment Market For Battery Manufacturing Revenue (Million) Forecast, by Application 2019 & 2032
- Table 74: Ecuador Global Mixing Equipment Market For Battery Manufacturing Volume (K Unit) Forecast, by Application 2019 & 2032
- Table 75: Venezuela Global Mixing Equipment Market For Battery Manufacturing Revenue (Million) Forecast, by Application 2019 & 2032
- Table 76: Venezuela Global Mixing Equipment Market For Battery Manufacturing Volume (K Unit) Forecast, by Application 2019 & 2032
- Table 77: Rest of South America Global Mixing Equipment Market For Battery Manufacturing Revenue (Million) Forecast, by Application 2019 & 2032
- Table 78: Rest of South America Global Mixing Equipment Market For Battery Manufacturing Volume (K Unit) Forecast, by Application 2019 & 2032
- Table 79: Global Mixing Equipment Market For Battery Manufacturing Revenue Million Forecast, by Country 2019 & 2032
- Table 80: Global Mixing Equipment Market For Battery Manufacturing Volume K Unit Forecast, by Country 2019 & 2032
- Table 81: United Arab Emirates Global Mixing Equipment Market For Battery Manufacturing Revenue (Million) Forecast, by Application 2019 & 2032
- Table 82: United Arab Emirates Global Mixing Equipment Market For Battery Manufacturing Volume (K Unit) Forecast, by Application 2019 & 2032
- Table 83: Saudi Arabia Global Mixing Equipment Market For Battery Manufacturing Revenue (Million) Forecast, by Application 2019 & 2032
- Table 84: Saudi Arabia Global Mixing Equipment Market For Battery Manufacturing Volume (K Unit) Forecast, by Application 2019 & 2032
- Table 85: South Africa Global Mixing Equipment Market For Battery Manufacturing Revenue (Million) Forecast, by Application 2019 & 2032
- Table 86: South Africa Global Mixing Equipment Market For Battery Manufacturing Volume (K Unit) Forecast, by Application 2019 & 2032
- Table 87: Rest of Middle East and Africa Global Mixing Equipment Market For Battery Manufacturing Revenue (Million) Forecast, by Application 2019 & 2032
- Table 88: Rest of Middle East and Africa Global Mixing Equipment Market For Battery Manufacturing Volume (K Unit) Forecast, by Application 2019 & 2032
- Table 89: Global Mixing Equipment Market For Battery Manufacturing Revenue Million Forecast, by Type 2019 & 2032
- Table 90: Global Mixing Equipment Market For Battery Manufacturing Volume K Unit Forecast, by Type 2019 & 2032
- Table 91: Global Mixing Equipment Market For Battery Manufacturing Revenue Million Forecast, by Country 2019 & 2032
- Table 92: Global Mixing Equipment Market For Battery Manufacturing Volume K Unit Forecast, by Country 2019 & 2032
- Table 93: United States Global Mixing Equipment Market For Battery Manufacturing Revenue (Million) Forecast, by Application 2019 & 2032
- Table 94: United States Global Mixing Equipment Market For Battery Manufacturing Volume (K Unit) Forecast, by Application 2019 & 2032
- Table 95: Canada Global Mixing Equipment Market For Battery Manufacturing Revenue (Million) Forecast, by Application 2019 & 2032
- Table 96: Canada Global Mixing Equipment Market For Battery Manufacturing Volume (K Unit) Forecast, by Application 2019 & 2032
- Table 97: Rest of North America Global Mixing Equipment Market For Battery Manufacturing Revenue (Million) Forecast, by Application 2019 & 2032
- Table 98: Rest of North America Global Mixing Equipment Market For Battery Manufacturing Volume (K Unit) Forecast, by Application 2019 & 2032
- Table 99: Global Mixing Equipment Market For Battery Manufacturing Revenue Million Forecast, by Type 2019 & 2032
- Table 100: Global Mixing Equipment Market For Battery Manufacturing Volume K Unit Forecast, by Type 2019 & 2032
- Table 101: Global Mixing Equipment Market For Battery Manufacturing Revenue Million Forecast, by Country 2019 & 2032
- Table 102: Global Mixing Equipment Market For Battery Manufacturing Volume K Unit Forecast, by Country 2019 & 2032
- Table 103: Germany Global Mixing Equipment Market For Battery Manufacturing Revenue (Million) Forecast, by Application 2019 & 2032
- Table 104: Germany Global Mixing Equipment Market For Battery Manufacturing Volume (K Unit) Forecast, by Application 2019 & 2032
- Table 105: France Global Mixing Equipment Market For Battery Manufacturing Revenue (Million) Forecast, by Application 2019 & 2032
- Table 106: France Global Mixing Equipment Market For Battery Manufacturing Volume (K Unit) Forecast, by Application 2019 & 2032
- Table 107: United Kingdom Global Mixing Equipment Market For Battery Manufacturing Revenue (Million) Forecast, by Application 2019 & 2032
- Table 108: United Kingdom Global Mixing Equipment Market For Battery Manufacturing Volume (K Unit) Forecast, by Application 2019 & 2032
- Table 109: Italy Global Mixing Equipment Market For Battery Manufacturing Revenue (Million) Forecast, by Application 2019 & 2032
- Table 110: Italy Global Mixing Equipment Market For Battery Manufacturing Volume (K Unit) Forecast, by Application 2019 & 2032
- Table 111: Spain Global Mixing Equipment Market For Battery Manufacturing Revenue (Million) Forecast, by Application 2019 & 2032
- Table 112: Spain Global Mixing Equipment Market For Battery Manufacturing Volume (K Unit) Forecast, by Application 2019 & 2032
- Table 113: NORDIC Global Mixing Equipment Market For Battery Manufacturing Revenue (Million) Forecast, by Application 2019 & 2032
- Table 114: NORDIC Global Mixing Equipment Market For Battery Manufacturing Volume (K Unit) Forecast, by Application 2019 & 2032
- Table 115: Turkey Global Mixing Equipment Market For Battery Manufacturing Revenue (Million) Forecast, by Application 2019 & 2032
- Table 116: Turkey Global Mixing Equipment Market For Battery Manufacturing Volume (K Unit) Forecast, by Application 2019 & 2032
- Table 117: Russia Global Mixing Equipment Market For Battery Manufacturing Revenue (Million) Forecast, by Application 2019 & 2032
- Table 118: Russia Global Mixing Equipment Market For Battery Manufacturing Volume (K Unit) Forecast, by Application 2019 & 2032
- Table 119: Rest of Europe Global Mixing Equipment Market For Battery Manufacturing Revenue (Million) Forecast, by Application 2019 & 2032
- Table 120: Rest of Europe Global Mixing Equipment Market For Battery Manufacturing Volume (K Unit) Forecast, by Application 2019 & 2032
- Table 121: Global Mixing Equipment Market For Battery Manufacturing Revenue Million Forecast, by Type 2019 & 2032
- Table 122: Global Mixing Equipment Market For Battery Manufacturing Volume K Unit Forecast, by Type 2019 & 2032
- Table 123: Global Mixing Equipment Market For Battery Manufacturing Revenue Million Forecast, by Country 2019 & 2032
- Table 124: Global Mixing Equipment Market For Battery Manufacturing Volume K Unit Forecast, by Country 2019 & 2032
- Table 125: China Global Mixing Equipment Market For Battery Manufacturing Revenue (Million) Forecast, by Application 2019 & 2032
- Table 126: China Global Mixing Equipment Market For Battery Manufacturing Volume (K Unit) Forecast, by Application 2019 & 2032
- Table 127: India Global Mixing Equipment Market For Battery Manufacturing Revenue (Million) Forecast, by Application 2019 & 2032
- Table 128: India Global Mixing Equipment Market For Battery Manufacturing Volume (K Unit) Forecast, by Application 2019 & 2032
- Table 129: Australia Global Mixing Equipment Market For Battery Manufacturing Revenue (Million) Forecast, by Application 2019 & 2032
- Table 130: Australia Global Mixing Equipment Market For Battery Manufacturing Volume (K Unit) Forecast, by Application 2019 & 2032
- Table 131: Japan Global Mixing Equipment Market For Battery Manufacturing Revenue (Million) Forecast, by Application 2019 & 2032
- Table 132: Japan Global Mixing Equipment Market For Battery Manufacturing Volume (K Unit) Forecast, by Application 2019 & 2032
- Table 133: Malaysia Global Mixing Equipment Market For Battery Manufacturing Revenue (Million) Forecast, by Application 2019 & 2032
- Table 134: Malaysia Global Mixing Equipment Market For Battery Manufacturing Volume (K Unit) Forecast, by Application 2019 & 2032
- Table 135: Thailand Global Mixing Equipment Market For Battery Manufacturing Revenue (Million) Forecast, by Application 2019 & 2032
- Table 136: Thailand Global Mixing Equipment Market For Battery Manufacturing Volume (K Unit) Forecast, by Application 2019 & 2032
- Table 137: Indonesia Global Mixing Equipment Market For Battery Manufacturing Revenue (Million) Forecast, by Application 2019 & 2032
- Table 138: Indonesia Global Mixing Equipment Market For Battery Manufacturing Volume (K Unit) Forecast, by Application 2019 & 2032
- Table 139: Vietnam Global Mixing Equipment Market For Battery Manufacturing Revenue (Million) Forecast, by Application 2019 & 2032
- Table 140: Vietnam Global Mixing Equipment Market For Battery Manufacturing Volume (K Unit) Forecast, by Application 2019 & 2032
- Table 141: Rest of Asia Pacific Global Mixing Equipment Market For Battery Manufacturing Revenue (Million) Forecast, by Application 2019 & 2032
- Table 142: Rest of Asia Pacific Global Mixing Equipment Market For Battery Manufacturing Volume (K Unit) Forecast, by Application 2019 & 2032
- Table 143: Global Mixing Equipment Market For Battery Manufacturing Revenue Million Forecast, by Type 2019 & 2032
- Table 144: Global Mixing Equipment Market For Battery Manufacturing Volume K Unit Forecast, by Type 2019 & 2032
- Table 145: Global Mixing Equipment Market For Battery Manufacturing Revenue Million Forecast, by Country 2019 & 2032
- Table 146: Global Mixing Equipment Market For Battery Manufacturing Volume K Unit Forecast, by Country 2019 & 2032
- Table 147: Saudi Arabia Global Mixing Equipment Market For Battery Manufacturing Revenue (Million) Forecast, by Application 2019 & 2032
- Table 148: Saudi Arabia Global Mixing Equipment Market For Battery Manufacturing Volume (K Unit) Forecast, by Application 2019 & 2032
- Table 149: United Arab Emirates Global Mixing Equipment Market For Battery Manufacturing Revenue (Million) Forecast, by Application 2019 & 2032
- Table 150: United Arab Emirates Global Mixing Equipment Market For Battery Manufacturing Volume (K Unit) Forecast, by Application 2019 & 2032
- Table 151: Qatar Global Mixing Equipment Market For Battery Manufacturing Revenue (Million) Forecast, by Application 2019 & 2032
- Table 152: Qatar Global Mixing Equipment Market For Battery Manufacturing Volume (K Unit) Forecast, by Application 2019 & 2032
- Table 153: Egypt Global Mixing Equipment Market For Battery Manufacturing Revenue (Million) Forecast, by Application 2019 & 2032
- Table 154: Egypt Global Mixing Equipment Market For Battery Manufacturing Volume (K Unit) Forecast, by Application 2019 & 2032
- Table 155: Nigeria Global Mixing Equipment Market For Battery Manufacturing Revenue (Million) Forecast, by Application 2019 & 2032
- Table 156: Nigeria Global Mixing Equipment Market For Battery Manufacturing Volume (K Unit) Forecast, by Application 2019 & 2032
- Table 157: South Africa Global Mixing Equipment Market For Battery Manufacturing Revenue (Million) Forecast, by Application 2019 & 2032
- Table 158: South Africa Global Mixing Equipment Market For Battery Manufacturing Volume (K Unit) Forecast, by Application 2019 & 2032
- Table 159: Rest of Middle East and Africa Global Mixing Equipment Market For Battery Manufacturing Revenue (Million) Forecast, by Application 2019 & 2032
- Table 160: Rest of Middle East and Africa Global Mixing Equipment Market For Battery Manufacturing Volume (K Unit) Forecast, by Application 2019 & 2032
- Table 161: Global Mixing Equipment Market For Battery Manufacturing Revenue Million Forecast, by Type 2019 & 2032
- Table 162: Global Mixing Equipment Market For Battery Manufacturing Volume K Unit Forecast, by Type 2019 & 2032
- Table 163: Global Mixing Equipment Market For Battery Manufacturing Revenue Million Forecast, by Country 2019 & 2032
- Table 164: Global Mixing Equipment Market For Battery Manufacturing Volume K Unit Forecast, by Country 2019 & 2032
- Table 165: Brazil Global Mixing Equipment Market For Battery Manufacturing Revenue (Million) Forecast, by Application 2019 & 2032
- Table 166: Brazil Global Mixing Equipment Market For Battery Manufacturing Volume (K Unit) Forecast, by Application 2019 & 2032
- Table 167: Argentina Global Mixing Equipment Market For Battery Manufacturing Revenue (Million) Forecast, by Application 2019 & 2032
- Table 168: Argentina Global Mixing Equipment Market For Battery Manufacturing Volume (K Unit) Forecast, by Application 2019 & 2032
- Table 169: Columbia Global Mixing Equipment Market For Battery Manufacturing Revenue (Million) Forecast, by Application 2019 & 2032
- Table 170: Columbia Global Mixing Equipment Market For Battery Manufacturing Volume (K Unit) Forecast, by Application 2019 & 2032
- Table 171: Rest of South America Global Mixing Equipment Market For Battery Manufacturing Revenue (Million) Forecast, by Application 2019 & 2032
- Table 172: Rest of South America Global Mixing Equipment Market For Battery Manufacturing Volume (K Unit) Forecast, by Application 2019 & 2032
Frequently Asked Questions
1. What is the projected Compound Annual Growth Rate (CAGR) of the Global Mixing Equipment Market For Battery Manufacturing?
The projected CAGR is approximately 21.20%.
2. Which companies are prominent players in the Global Mixing Equipment Market For Battery Manufacturing?
Key companies in the market include Processall, Charles Ross & Son Company, MIXACO, XIAMEN TOB NEW ENERGY TECHNOLOGY Co LTD, Jongia Mixing Technology, ONGOAL, IKA India Private Limited, SIEHE GROUP, SCM GROUP LIMITED HK, Xiamen Tmax Battery Equipments Limited.
3. What are the main segments of the Global Mixing Equipment Market For Battery Manufacturing?
The market segments include Type.
4. Can you provide details about the market size?
The market size is estimated to be USD 1.69 Million as of 2022.
5. What are some drivers contributing to market growth?
4.; The Increase in Investments to Enhance the Battery Production Capacity4.; Rising Adoption of Electric Vehicles.
6. What are the notable trends driving market growth?
Investments To Enhance the Battery Production Capacity is expected to Drive the Market Growth.
7. Are there any restraints impacting market growth?
4.; The High Logistic Cost.
8. Can you provide examples of recent developments in the market?
September 2023: Fraunhofer Research Institution for Battery Cell Production used a 30-millimeter extruder at FFB’s new R&D site in Münster, Germany. Fraunhofer-Gesellschaft’s research organization is also building its FFB PreFab test facility, with a throughput of up to 1,200 liters of electrode/battery slurry per hour.
9. What pricing options are available for accessing the report?
Pricing options include single-user, multi-user, and enterprise licenses priced at USD 4750, USD 5250, and USD 8750 respectively.
10. Is the market size provided in terms of value or volume?
The market size is provided in terms of value, measured in Million and volume, measured in K Unit.
11. Are there any specific market keywords associated with the report?
Yes, the market keyword associated with the report is "Global Mixing Equipment Market For Battery Manufacturing," which aids in identifying and referencing the specific market segment covered.
12. How do I determine which pricing option suits my needs best?
The pricing options vary based on user requirements and access needs. Individual users may opt for single-user licenses, while businesses requiring broader access may choose multi-user or enterprise licenses for cost-effective access to the report.
13. Are there any additional resources or data provided in the Global Mixing Equipment Market For Battery Manufacturing report?
While the report offers comprehensive insights, it's advisable to review the specific contents or supplementary materials provided to ascertain if additional resources or data are available.
14. How can I stay updated on further developments or reports in the Global Mixing Equipment Market For Battery Manufacturing?
To stay informed about further developments, trends, and reports in the Global Mixing Equipment Market For Battery Manufacturing, consider subscribing to industry newsletters, following relevant companies and organizations, or regularly checking reputable industry news sources and publications.
Methodology
Step 1 - Identification of Relevant Samples Size from Population Database


Step 2 - Approaches for Defining Global Market Size (Value, Volume* & Price*)

Note*: In applicable scenarios
Step 3 - Data Sources
Primary Research
- Web Analytics
- Survey Reports
- Research Institute
- Latest Research Reports
- Opinion Leaders
Secondary Research
- Annual Reports
- White Paper
- Latest Press Release
- Industry Association
- Paid Database
- Investor Presentations

Step 4 - Data Triangulation
Involves using different sources of information in order to increase the validity of a study
These sources are likely to be stakeholders in a program - participants, other researchers, program staff, other community members, and so on.
Then we put all data in single framework & apply various statistical tools to find out the dynamic on the market.
During the analysis stage, feedback from the stakeholder groups would be compared to determine areas of agreement as well as areas of divergence


