Exploring Key Dynamics of Green Coffee Industry Industry

Green Coffee Industry by Production Analysis, by Consumption Analysis, by Import Market Analysis (Value & Volume), by Export Market Analysis (Value & Volume), by Price Trend Analysis, by North America (United States, Canada, Mexico), by Europe (Germany, United Kingdom, Spain, France, Italy, Belgium, Russia), by Asia Pacific (China, Vietnam, Indonesia, India, Japan), by South America (Brazil, Colombia), by Middle East and Africa (Uganda, Ethiopia) Forecast 2025-2033

Jun 27 2025
Base Year: 2024

234 Pages
Main Logo

Exploring Key Dynamics of Green Coffee Industry Industry


Home
Industries
Agriculture
sponsor image

Tailored for you

  • In-depth Analysis Tailored to Specified Regions or Segments
  • Company Profiles Customized to User Preferences
  • Comprehensive Insights Focused on Specific Segments or Regions
  • Customized Evaluation of Competitive Landscape to Meet Your Needs
  • Tailored Customization to Address Other Specific Requirements
Ask for customization


Key Insights

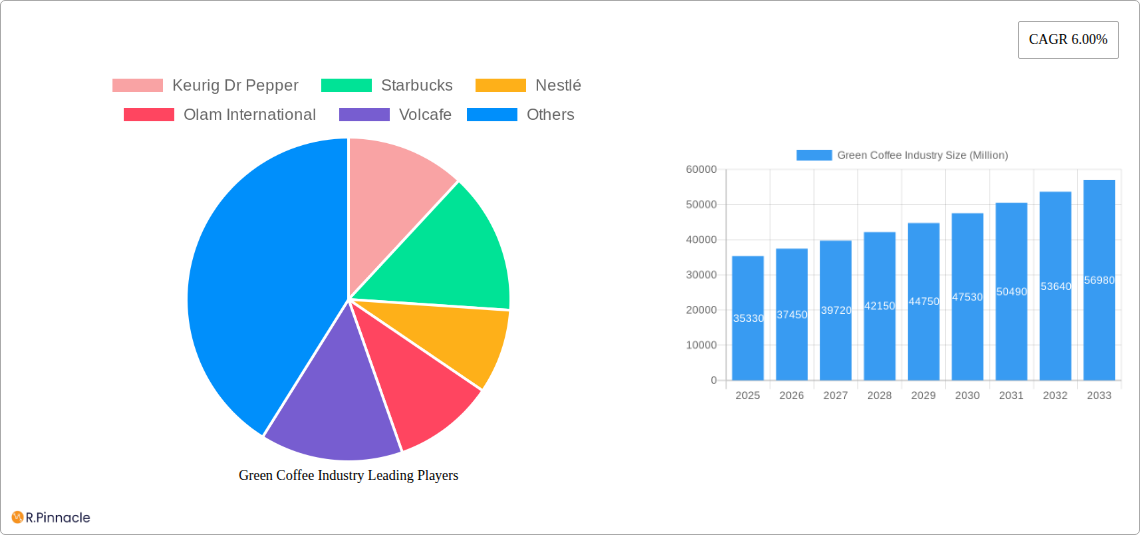
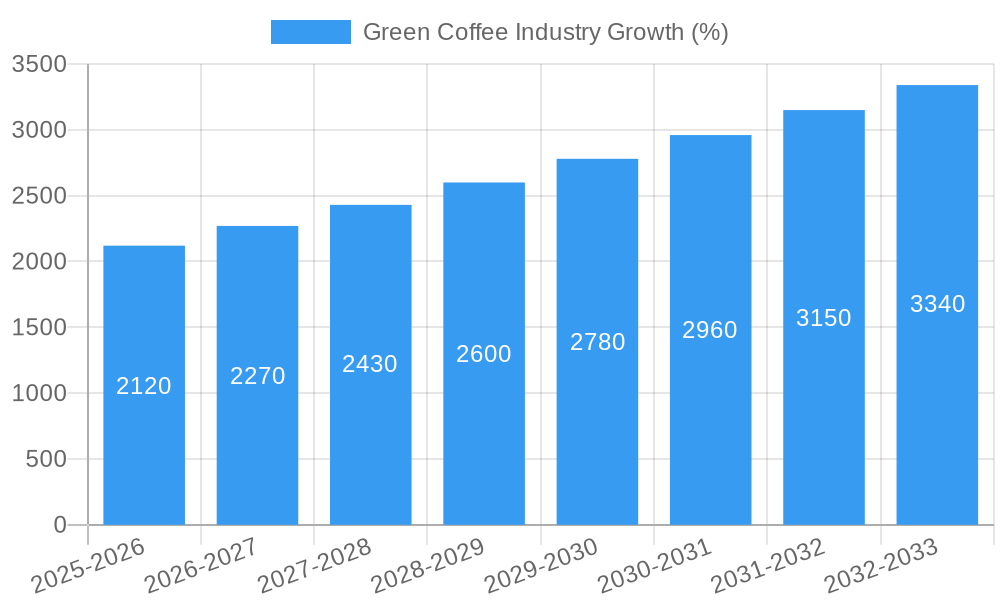
The global green coffee market, valued at $35.33 billion in 2025, is projected to experience robust growth, driven by rising global coffee consumption, increasing demand for specialty coffee, and the growing popularity of at-home coffee brewing. The market's Compound Annual Growth Rate (CAGR) of 6.00% from 2025 to 2033 indicates a significant expansion over the forecast period. Key drivers include the increasing disposable incomes in developing economies, leading to higher spending on premium coffee products; a shift towards healthier lifestyle choices, with coffee perceived as a relatively healthy beverage option; and the continuous innovation in coffee brewing technologies and product offerings, such as single-serve pods and cold brew options. Market segmentation reveals a strong preference for Arabica beans over Robusta, reflecting consumer demand for superior flavor profiles. The beverage segment dominates application, reflecting the traditional use of coffee, while the household end-user segment displays the largest market share, indicative of the sustained popularity of home coffee consumption. Major players, including Keurig Dr Pepper, Starbucks, Nestlé, and Olam International, are actively shaping the market through strategic acquisitions, product diversification, and sustainable sourcing initiatives. While factors such as fluctuating coffee bean prices and potential climate change impacts on coffee production pose challenges, the overall market outlook remains positive, particularly in regions like Asia Pacific and North America, which are exhibiting high growth trajectories.

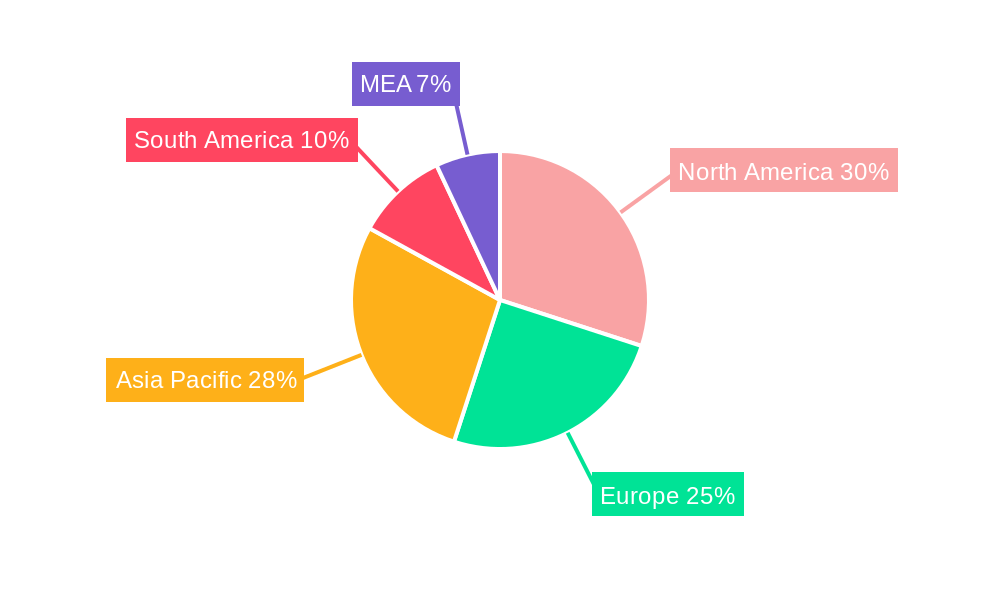
The competitive landscape is characterized by a mix of large multinational corporations and smaller specialty coffee roasters. The significant presence of established brands ensures a stable market foundation, while the emergence of smaller players introduces innovation and caters to niche consumer preferences. Regional variations in consumption patterns are evident, with North America and Europe maintaining strong positions driven by established coffee cultures. However, rapid growth is expected from Asia Pacific, particularly in countries like China and India, due to increasing coffee consumption and evolving consumer preferences. The market is continuously adapting to emerging trends, such as the growing interest in organic and sustainably sourced coffee, driving opportunities for businesses focusing on ethical and environmentally responsible practices. This growing demand is expected to further boost the overall market growth in the coming years.

Green Coffee Industry Research Report - Market Size, Growth & Forecast

Green Coffee Industry Market Report: 2019-2033

This comprehensive report provides an in-depth analysis of the global green coffee industry, projecting a market value exceeding $XX Million by 2033. The report covers the period from 2019 to 2033, with 2025 as the base and estimated year. It offers actionable insights for industry professionals, investors, and stakeholders seeking to navigate this dynamic market. The study meticulously analyzes market structure, growth drivers, competitive dynamics, and emerging trends, enabling informed decision-making.

Green Coffee Industry Market Structure & Innovation Trends

The global green coffee market exhibits a moderately consolidated structure, with key players like Keurig Dr Pepper, Starbucks, Nestlé, Olam International, Volcafe, Jacobs Douwe Egberts, Lavazza illycaffè, J.M. Smucker, and Kraft Heinz holding significant market share. Market concentration is influenced by factors including brand recognition, global distribution networks, and vertical integration. Innovation is driven by consumer demand for sustainable and ethically sourced coffee, leading to advancements in farming practices, processing techniques, and product offerings.

  • Market Share: Nestlé and Starbucks hold a combined market share of approximately xx%.
  • M&A Activity: The historical period (2019-2024) witnessed M&A deal values exceeding $XX Million, primarily driven by consolidation efforts and expansion into new markets. (Further breakdown of M&A deals will be detailed in the full report.)
  • Regulatory Frameworks: Government regulations regarding fair trade, sustainability, and food safety significantly impact market dynamics. The recently proposed 'Coffee Promotion and Development Bill, 2022' in India, for example, aims to modernize the coffee industry.
  • Product Substitutes: The emergence of alternative beverages like tea and functional drinks poses a competitive threat, influencing market growth projections.
  • End-User Demographics: Growing consumer preference for specialty coffee and premium blends drives market expansion. The Household segment remains dominant with increasing commercial sector penetration due to the rising number of coffee shops.
Green Coffee Industry Growth

Green Coffee Industry Market Dynamics & Trends

The global green coffee market is experiencing robust growth, fueled by several key factors. The Compound Annual Growth Rate (CAGR) for the forecast period (2025-2033) is estimated at xx%, driven by rising disposable incomes, shifting consumer preferences towards premium coffee, and increasing coffee consumption in emerging markets. Technological advancements in processing and roasting techniques further enhance quality and efficiency. However, challenges such as climate change, supply chain disruptions, and price volatility pose significant risks. Market penetration of specialty coffee is increasing at a rate of xx% annually. Competitive dynamics are shaped by intense rivalry among major players, leading to product innovation, branding strategies, and strategic partnerships to gain market share.

Green Coffee Industry Growth

Dominant Regions & Segments in Green Coffee Industry

  • Leading Region: The [Specific Region, e.g., Asia-Pacific] region dominates the green coffee market, driven by strong economic growth, increasing coffee consumption, and favorable government policies.

  • Dominant Product Type: Arabica coffee holds the largest market share, valued at $XX Million in 2025, due to its superior taste and aroma.

  • Key Application: The Beverage segment accounts for the major share of the market, primarily driven by the booming café culture and increasing demand for ready-to-drink (RTD) coffee products.

  • Primary End-User: The Household segment contributes most to market revenue, followed by the Commercial segment.

  • Drivers for Dominance (Bullet Points):

    • Robust economic growth
    • Increasing disposable incomes
    • Expanding café culture
    • Favorable government regulations supporting the coffee industry
    • Significant investments in coffee production and processing infrastructure

Green Coffee Industry Product Innovations

Recent innovations focus on enhancing coffee quality, sustainability, and convenience. This includes the development of single-serve coffee pods, innovative brewing technologies, and sustainably sourced coffee beans. Companies are also focusing on product differentiation through unique flavor profiles, organic options, and fair-trade certifications, aligning with the growing consumer preference for ethical and sustainable consumption.

Report Scope & Segmentation Analysis

This report segments the green coffee market based on product type (Arabica, Robusta, Others), application (Beverage, Food, Others), and end-user (Household, Commercial, Others). Each segment's growth trajectory, market size, and competitive dynamics are thoroughly analyzed, providing a detailed overview of the industry's structure. Projected growth for Arabica is xx%, for Robusta is yy% and for others is zz% for the forecast period.

Key Drivers of Green Coffee Industry Growth

The growth of the green coffee industry is primarily driven by the increasing global coffee consumption, driven by rising disposable incomes particularly in emerging economies. Technological advancements in coffee production and processing enhance efficiency and quality. Favorable government policies and initiatives supporting the industry also contribute significantly to growth. The growing popularity of specialty coffee, including single-origin beans and unique blends, further propels market expansion.

Challenges in the Green Coffee Industry Sector

The green coffee industry faces challenges such as climate change impacting coffee bean yields, resulting in price volatility. Supply chain disruptions due to geopolitical instability and logistical issues impact production and distribution. Intense competition among major players exerts downward pressure on prices. Regulatory hurdles related to sustainability and fair trade standards present operational complexities.

Emerging Opportunities in Green Coffee Industry

Emerging opportunities exist in expanding into new markets in Asia and Africa, focusing on convenient coffee formats. There's also significant potential in sustainable and ethical sourcing, meeting growing consumer demands for environmentally responsible products. Innovations in coffee brewing technologies, such as single-serve systems and capsule machines, present a significant growth avenue.

Leading Players in the Green Coffee Industry Market

  • Keurig Dr Pepper
  • Starbucks
  • Nestlé
  • Olam International
  • Volcafe
  • Jacobs Douwe Egberts
  • Lavazza illycaffè
  • J.M. Smucker
  • Kraft Heinz

Key Developments in Green Coffee Industry

  • July 2021: The Rainforest Alliance launched a new sustainability certification program, promoting sustainable farming practices and fair prices for farmers.
  • July 2022: The Ethiopian Coffee and Tea Authority (ECTA) launched a strategy to triple coffee production in ten years.
  • July 2022: India proposed the 'Coffee Promotion and Development Bill, 2022' to modernize the coffee industry.

Future Outlook for Green Coffee Industry Market

The future outlook for the green coffee market is positive, driven by sustained growth in coffee consumption, technological advancements, and increasing demand for sustainable and ethical products. Strategic investments in research and development, coupled with effective marketing and branding strategies, will be critical for companies seeking to capitalize on the market's growth potential. The industry will continue to evolve, adapting to consumer preferences and environmental considerations.

Green Coffee Industry Segmentation

  • 1. Production Analysis
  • 2. Consumption Analysis
  • 3. Import Market Analysis (Value & Volume)
  • 4. Export Market Analysis (Value & Volume)
  • 5. Price Trend Analysis

Green Coffee Industry Segmentation By Geography

  • 1. North America
    • 1.1. United States
    • 1.2. Canada
    • 1.3. Mexico
  • 2. Europe
    • 2.1. Germany
    • 2.2. United Kingdom
    • 2.3. Spain
    • 2.4. France
    • 2.5. Italy
    • 2.6. Belgium
    • 2.7. Russia
  • 3. Asia Pacific
    • 3.1. China
    • 3.2. Vietnam
    • 3.3. Indonesia
    • 3.4. India
    • 3.5. Japan
  • 4. South America
    • 4.1. Brazil
    • 4.2. Colombia
  • 5. Middle East and Africa
    • 5.1. Uganda
    • 5.2. Ethiopia
Green Coffee Industry Regional Share


Green Coffee Industry REPORT HIGHLIGHTS

AspectsDetails
Study Period 2019-2033
Base Year 2024
Estimated Year 2025
Forecast Period2025-2033
Historical Period2019-2024
Growth RateCAGR of 6.00% from 2019-2033
Segmentation
    • By Production Analysis
    • By Consumption Analysis
    • By Import Market Analysis (Value & Volume)
    • By Export Market Analysis (Value & Volume)
    • By Price Trend Analysis
  • By Geography
    • North America
      • United States
      • Canada
      • Mexico
    • Europe
      • Germany
      • United Kingdom
      • Spain
      • France
      • Italy
      • Belgium
      • Russia
    • Asia Pacific
      • China
      • Vietnam
      • Indonesia
      • India
      • Japan
    • South America
      • Brazil
      • Colombia
    • Middle East and Africa
      • Uganda
      • Ethiopia


Table of Contents

  1. 1. Introduction
    • 1.1. Research Scope
    • 1.2. Market Segmentation
    • 1.3. Research Methodology
    • 1.4. Definitions and Assumptions
  2. 2. Executive Summary
    • 2.1. Introduction
  3. 3. Market Dynamics
    • 3.1. Introduction
      • 3.2. Market Drivers
        • 3.2.1. Increasing Berry Consumption for Health Benefits; Increasing Adoption of High-Technology Farm Practices; Growing Usage of Berries in the Food and Beverage Industries
      • 3.3. Market Restrains
        • 3.3.1. High Production Cost Involved in Berry Production; Increasing Disease and Pest Infestations
      • 3.4. Market Trends
        • 3.4.1. Increasing Demand for Certified Coffee
  4. 4. Market Factor Analysis
    • 4.1. Porters Five Forces
    • 4.2. Supply/Value Chain
    • 4.3. PESTEL analysis
    • 4.4. Market Entropy
    • 4.5. Patent/Trademark Analysis
  5. 5. Global Green Coffee Industry Analysis, Insights and Forecast, 2019-2031
    • 5.1. Market Analysis, Insights and Forecast - by Production Analysis
      • 5.2. Market Analysis, Insights and Forecast - by Consumption Analysis
        • 5.3. Market Analysis, Insights and Forecast - by Import Market Analysis (Value & Volume)
          • 5.4. Market Analysis, Insights and Forecast - by Export Market Analysis (Value & Volume)
            • 5.5. Market Analysis, Insights and Forecast - by Price Trend Analysis
              • 5.6. Market Analysis, Insights and Forecast - by Region
                • 5.6.1. North America
                • 5.6.2. Europe
                • 5.6.3. Asia Pacific
                • 5.6.4. South America
                • 5.6.5. Middle East and Africa
            • 6. North America Green Coffee Industry Analysis, Insights and Forecast, 2019-2031
              • 6.1. Market Analysis, Insights and Forecast - by Production Analysis
                • 6.2. Market Analysis, Insights and Forecast - by Consumption Analysis
                  • 6.3. Market Analysis, Insights and Forecast - by Import Market Analysis (Value & Volume)
                    • 6.4. Market Analysis, Insights and Forecast - by Export Market Analysis (Value & Volume)
                      • 6.5. Market Analysis, Insights and Forecast - by Price Trend Analysis
                      • 7. Europe Green Coffee Industry Analysis, Insights and Forecast, 2019-2031
                        • 7.1. Market Analysis, Insights and Forecast - by Production Analysis
                          • 7.2. Market Analysis, Insights and Forecast - by Consumption Analysis
                            • 7.3. Market Analysis, Insights and Forecast - by Import Market Analysis (Value & Volume)
                              • 7.4. Market Analysis, Insights and Forecast - by Export Market Analysis (Value & Volume)
                                • 7.5. Market Analysis, Insights and Forecast - by Price Trend Analysis
                                • 8. Asia Pacific Green Coffee Industry Analysis, Insights and Forecast, 2019-2031
                                  • 8.1. Market Analysis, Insights and Forecast - by Production Analysis
                                    • 8.2. Market Analysis, Insights and Forecast - by Consumption Analysis
                                      • 8.3. Market Analysis, Insights and Forecast - by Import Market Analysis (Value & Volume)
                                        • 8.4. Market Analysis, Insights and Forecast - by Export Market Analysis (Value & Volume)
                                          • 8.5. Market Analysis, Insights and Forecast - by Price Trend Analysis
                                          • 9. South America Green Coffee Industry Analysis, Insights and Forecast, 2019-2031
                                            • 9.1. Market Analysis, Insights and Forecast - by Production Analysis
                                              • 9.2. Market Analysis, Insights and Forecast - by Consumption Analysis
                                                • 9.3. Market Analysis, Insights and Forecast - by Import Market Analysis (Value & Volume)
                                                  • 9.4. Market Analysis, Insights and Forecast - by Export Market Analysis (Value & Volume)
                                                    • 9.5. Market Analysis, Insights and Forecast - by Price Trend Analysis
                                                    • 10. Middle East and Africa Green Coffee Industry Analysis, Insights and Forecast, 2019-2031
                                                      • 10.1. Market Analysis, Insights and Forecast - by Production Analysis
                                                        • 10.2. Market Analysis, Insights and Forecast - by Consumption Analysis
                                                          • 10.3. Market Analysis, Insights and Forecast - by Import Market Analysis (Value & Volume)
                                                            • 10.4. Market Analysis, Insights and Forecast - by Export Market Analysis (Value & Volume)
                                                              • 10.5. Market Analysis, Insights and Forecast - by Price Trend Analysis
                                                              • 11. North America Green Coffee Industry Analysis, Insights and Forecast, 2019-2031
                                                                  • 11.1. Market Analysis, Insights and Forecast - By Country/Sub-region
                                                                    • 11.1.1 United States
                                                                    • 11.1.2 Canada
                                                                    • 11.1.3 Mexico
                                                              • 12. Europe Green Coffee Industry Analysis, Insights and Forecast, 2019-2031
                                                                  • 12.1. Market Analysis, Insights and Forecast - By Country/Sub-region
                                                                    • 12.1.1 Germany
                                                                    • 12.1.2 United Kingdom
                                                                    • 12.1.3 France
                                                                    • 12.1.4 Spain
                                                                    • 12.1.5 Italy
                                                                    • 12.1.6 Spain
                                                                    • 12.1.7 Belgium
                                                                    • 12.1.8 Netherland
                                                                    • 12.1.9 Nordics
                                                                    • 12.1.10 Rest of Europe
                                                              • 13. Asia Pacific Green Coffee Industry Analysis, Insights and Forecast, 2019-2031
                                                                  • 13.1. Market Analysis, Insights and Forecast - By Country/Sub-region
                                                                    • 13.1.1 China
                                                                    • 13.1.2 Japan
                                                                    • 13.1.3 India
                                                                    • 13.1.4 South Korea
                                                                    • 13.1.5 Southeast Asia
                                                                    • 13.1.6 Australia
                                                                    • 13.1.7 Indonesia
                                                                    • 13.1.8 Phillipes
                                                                    • 13.1.9 Singapore
                                                                    • 13.1.10 Thailandc
                                                                    • 13.1.11 Rest of Asia Pacific
                                                              • 14. South America Green Coffee Industry Analysis, Insights and Forecast, 2019-2031
                                                                  • 14.1. Market Analysis, Insights and Forecast - By Country/Sub-region
                                                                    • 14.1.1 Brazil
                                                                    • 14.1.2 Argentina
                                                                    • 14.1.3 Peru
                                                                    • 14.1.4 Chile
                                                                    • 14.1.5 Colombia
                                                                    • 14.1.6 Ecuador
                                                                    • 14.1.7 Venezuela
                                                                    • 14.1.8 Rest of South America
                                                              • 15. MEA Green Coffee Industry Analysis, Insights and Forecast, 2019-2031
                                                                  • 15.1. Market Analysis, Insights and Forecast - By Country/Sub-region
                                                                    • 15.1.1 United Arab Emirates
                                                                    • 15.1.2 Saudi Arabia
                                                                    • 15.1.3 South Africa
                                                                    • 15.1.4 Rest of Middle East and Africa
                                                              • 16. Competitive Analysis
                                                                • 16.1. Global Market Share Analysis 2024
                                                                  • 16.2. Company Profiles
                                                                    • 16.2.1 Keurig Dr Pepper
                                                                      • 16.2.1.1. Overview
                                                                      • 16.2.1.2. Products
                                                                      • 16.2.1.3. SWOT Analysis
                                                                      • 16.2.1.4. Recent Developments
                                                                      • 16.2.1.5. Financials (Based on Availability)
                                                                    • 16.2.2 Starbucks
                                                                      • 16.2.2.1. Overview
                                                                      • 16.2.2.2. Products
                                                                      • 16.2.2.3. SWOT Analysis
                                                                      • 16.2.2.4. Recent Developments
                                                                      • 16.2.2.5. Financials (Based on Availability)
                                                                    • 16.2.3 Nestlé
                                                                      • 16.2.3.1. Overview
                                                                      • 16.2.3.2. Products
                                                                      • 16.2.3.3. SWOT Analysis
                                                                      • 16.2.3.4. Recent Developments
                                                                      • 16.2.3.5. Financials (Based on Availability)
                                                                    • 16.2.4 Olam International
                                                                      • 16.2.4.1. Overview
                                                                      • 16.2.4.2. Products
                                                                      • 16.2.4.3. SWOT Analysis
                                                                      • 16.2.4.4. Recent Developments
                                                                      • 16.2.4.5. Financials (Based on Availability)
                                                                    • 16.2.5 Volcafe
                                                                      • 16.2.5.1. Overview
                                                                      • 16.2.5.2. Products
                                                                      • 16.2.5.3. SWOT Analysis
                                                                      • 16.2.5.4. Recent Developments
                                                                      • 16.2.5.5. Financials (Based on Availability)
                                                                    • 16.2.6 Jacobs Douwe Egberts
                                                                      • 16.2.6.1. Overview
                                                                      • 16.2.6.2. Products
                                                                      • 16.2.6.3. SWOT Analysis
                                                                      • 16.2.6.4. Recent Developments
                                                                      • 16.2.6.5. Financials (Based on Availability)
                                                                    • 16.2.7 Lavazza illycaffè
                                                                      • 16.2.7.1. Overview
                                                                      • 16.2.7.2. Products
                                                                      • 16.2.7.3. SWOT Analysis
                                                                      • 16.2.7.4. Recent Developments
                                                                      • 16.2.7.5. Financials (Based on Availability)
                                                                    • 16.2.8 J.M. Smucker
                                                                      • 16.2.8.1. Overview
                                                                      • 16.2.8.2. Products
                                                                      • 16.2.8.3. SWOT Analysis
                                                                      • 16.2.8.4. Recent Developments
                                                                      • 16.2.8.5. Financials (Based on Availability)
                                                                    • 16.2.9 Kraft Heinz
                                                                      • 16.2.9.1. Overview
                                                                      • 16.2.9.2. Products
                                                                      • 16.2.9.3. SWOT Analysis
                                                                      • 16.2.9.4. Recent Developments
                                                                      • 16.2.9.5. Financials (Based on Availability)

                                                              List of Figures

                                                              1. Figure 1: Global Green Coffee Industry Revenue Breakdown (Million, %) by Region 2024 & 2032
                                                              2. Figure 2: North America Green Coffee Industry Revenue (Million), by Country 2024 & 2032
                                                              3. Figure 3: North America Green Coffee Industry Revenue Share (%), by Country 2024 & 2032
                                                              4. Figure 4: Europe Green Coffee Industry Revenue (Million), by Country 2024 & 2032
                                                              5. Figure 5: Europe Green Coffee Industry Revenue Share (%), by Country 2024 & 2032
                                                              6. Figure 6: Asia Pacific Green Coffee Industry Revenue (Million), by Country 2024 & 2032
                                                              7. Figure 7: Asia Pacific Green Coffee Industry Revenue Share (%), by Country 2024 & 2032
                                                              8. Figure 8: South America Green Coffee Industry Revenue (Million), by Country 2024 & 2032
                                                              9. Figure 9: South America Green Coffee Industry Revenue Share (%), by Country 2024 & 2032
                                                              10. Figure 10: MEA Green Coffee Industry Revenue (Million), by Country 2024 & 2032
                                                              11. Figure 11: MEA Green Coffee Industry Revenue Share (%), by Country 2024 & 2032
                                                              12. Figure 12: North America Green Coffee Industry Revenue (Million), by Production Analysis 2024 & 2032
                                                              13. Figure 13: North America Green Coffee Industry Revenue Share (%), by Production Analysis 2024 & 2032
                                                              14. Figure 14: North America Green Coffee Industry Revenue (Million), by Consumption Analysis 2024 & 2032
                                                              15. Figure 15: North America Green Coffee Industry Revenue Share (%), by Consumption Analysis 2024 & 2032
                                                              16. Figure 16: North America Green Coffee Industry Revenue (Million), by Import Market Analysis (Value & Volume) 2024 & 2032
                                                              17. Figure 17: North America Green Coffee Industry Revenue Share (%), by Import Market Analysis (Value & Volume) 2024 & 2032
                                                              18. Figure 18: North America Green Coffee Industry Revenue (Million), by Export Market Analysis (Value & Volume) 2024 & 2032
                                                              19. Figure 19: North America Green Coffee Industry Revenue Share (%), by Export Market Analysis (Value & Volume) 2024 & 2032
                                                              20. Figure 20: North America Green Coffee Industry Revenue (Million), by Price Trend Analysis 2024 & 2032
                                                              21. Figure 21: North America Green Coffee Industry Revenue Share (%), by Price Trend Analysis 2024 & 2032
                                                              22. Figure 22: North America Green Coffee Industry Revenue (Million), by Country 2024 & 2032
                                                              23. Figure 23: North America Green Coffee Industry Revenue Share (%), by Country 2024 & 2032
                                                              24. Figure 24: Europe Green Coffee Industry Revenue (Million), by Production Analysis 2024 & 2032
                                                              25. Figure 25: Europe Green Coffee Industry Revenue Share (%), by Production Analysis 2024 & 2032
                                                              26. Figure 26: Europe Green Coffee Industry Revenue (Million), by Consumption Analysis 2024 & 2032
                                                              27. Figure 27: Europe Green Coffee Industry Revenue Share (%), by Consumption Analysis 2024 & 2032
                                                              28. Figure 28: Europe Green Coffee Industry Revenue (Million), by Import Market Analysis (Value & Volume) 2024 & 2032
                                                              29. Figure 29: Europe Green Coffee Industry Revenue Share (%), by Import Market Analysis (Value & Volume) 2024 & 2032
                                                              30. Figure 30: Europe Green Coffee Industry Revenue (Million), by Export Market Analysis (Value & Volume) 2024 & 2032
                                                              31. Figure 31: Europe Green Coffee Industry Revenue Share (%), by Export Market Analysis (Value & Volume) 2024 & 2032
                                                              32. Figure 32: Europe Green Coffee Industry Revenue (Million), by Price Trend Analysis 2024 & 2032
                                                              33. Figure 33: Europe Green Coffee Industry Revenue Share (%), by Price Trend Analysis 2024 & 2032
                                                              34. Figure 34: Europe Green Coffee Industry Revenue (Million), by Country 2024 & 2032
                                                              35. Figure 35: Europe Green Coffee Industry Revenue Share (%), by Country 2024 & 2032
                                                              36. Figure 36: Asia Pacific Green Coffee Industry Revenue (Million), by Production Analysis 2024 & 2032
                                                              37. Figure 37: Asia Pacific Green Coffee Industry Revenue Share (%), by Production Analysis 2024 & 2032
                                                              38. Figure 38: Asia Pacific Green Coffee Industry Revenue (Million), by Consumption Analysis 2024 & 2032
                                                              39. Figure 39: Asia Pacific Green Coffee Industry Revenue Share (%), by Consumption Analysis 2024 & 2032
                                                              40. Figure 40: Asia Pacific Green Coffee Industry Revenue (Million), by Import Market Analysis (Value & Volume) 2024 & 2032
                                                              41. Figure 41: Asia Pacific Green Coffee Industry Revenue Share (%), by Import Market Analysis (Value & Volume) 2024 & 2032
                                                              42. Figure 42: Asia Pacific Green Coffee Industry Revenue (Million), by Export Market Analysis (Value & Volume) 2024 & 2032
                                                              43. Figure 43: Asia Pacific Green Coffee Industry Revenue Share (%), by Export Market Analysis (Value & Volume) 2024 & 2032
                                                              44. Figure 44: Asia Pacific Green Coffee Industry Revenue (Million), by Price Trend Analysis 2024 & 2032
                                                              45. Figure 45: Asia Pacific Green Coffee Industry Revenue Share (%), by Price Trend Analysis 2024 & 2032
                                                              46. Figure 46: Asia Pacific Green Coffee Industry Revenue (Million), by Country 2024 & 2032
                                                              47. Figure 47: Asia Pacific Green Coffee Industry Revenue Share (%), by Country 2024 & 2032
                                                              48. Figure 48: South America Green Coffee Industry Revenue (Million), by Production Analysis 2024 & 2032
                                                              49. Figure 49: South America Green Coffee Industry Revenue Share (%), by Production Analysis 2024 & 2032
                                                              50. Figure 50: South America Green Coffee Industry Revenue (Million), by Consumption Analysis 2024 & 2032
                                                              51. Figure 51: South America Green Coffee Industry Revenue Share (%), by Consumption Analysis 2024 & 2032
                                                              52. Figure 52: South America Green Coffee Industry Revenue (Million), by Import Market Analysis (Value & Volume) 2024 & 2032
                                                              53. Figure 53: South America Green Coffee Industry Revenue Share (%), by Import Market Analysis (Value & Volume) 2024 & 2032
                                                              54. Figure 54: South America Green Coffee Industry Revenue (Million), by Export Market Analysis (Value & Volume) 2024 & 2032
                                                              55. Figure 55: South America Green Coffee Industry Revenue Share (%), by Export Market Analysis (Value & Volume) 2024 & 2032
                                                              56. Figure 56: South America Green Coffee Industry Revenue (Million), by Price Trend Analysis 2024 & 2032
                                                              57. Figure 57: South America Green Coffee Industry Revenue Share (%), by Price Trend Analysis 2024 & 2032
                                                              58. Figure 58: South America Green Coffee Industry Revenue (Million), by Country 2024 & 2032
                                                              59. Figure 59: South America Green Coffee Industry Revenue Share (%), by Country 2024 & 2032
                                                              60. Figure 60: Middle East and Africa Green Coffee Industry Revenue (Million), by Production Analysis 2024 & 2032
                                                              61. Figure 61: Middle East and Africa Green Coffee Industry Revenue Share (%), by Production Analysis 2024 & 2032
                                                              62. Figure 62: Middle East and Africa Green Coffee Industry Revenue (Million), by Consumption Analysis 2024 & 2032
                                                              63. Figure 63: Middle East and Africa Green Coffee Industry Revenue Share (%), by Consumption Analysis 2024 & 2032
                                                              64. Figure 64: Middle East and Africa Green Coffee Industry Revenue (Million), by Import Market Analysis (Value & Volume) 2024 & 2032
                                                              65. Figure 65: Middle East and Africa Green Coffee Industry Revenue Share (%), by Import Market Analysis (Value & Volume) 2024 & 2032
                                                              66. Figure 66: Middle East and Africa Green Coffee Industry Revenue (Million), by Export Market Analysis (Value & Volume) 2024 & 2032
                                                              67. Figure 67: Middle East and Africa Green Coffee Industry Revenue Share (%), by Export Market Analysis (Value & Volume) 2024 & 2032
                                                              68. Figure 68: Middle East and Africa Green Coffee Industry Revenue (Million), by Price Trend Analysis 2024 & 2032
                                                              69. Figure 69: Middle East and Africa Green Coffee Industry Revenue Share (%), by Price Trend Analysis 2024 & 2032
                                                              70. Figure 70: Middle East and Africa Green Coffee Industry Revenue (Million), by Country 2024 & 2032
                                                              71. Figure 71: Middle East and Africa Green Coffee Industry Revenue Share (%), by Country 2024 & 2032

                                                              List of Tables

                                                              1. Table 1: Global Green Coffee Industry Revenue Million Forecast, by Region 2019 & 2032
                                                              2. Table 2: Global Green Coffee Industry Revenue Million Forecast, by Production Analysis 2019 & 2032
                                                              3. Table 3: Global Green Coffee Industry Revenue Million Forecast, by Consumption Analysis 2019 & 2032
                                                              4. Table 4: Global Green Coffee Industry Revenue Million Forecast, by Import Market Analysis (Value & Volume) 2019 & 2032
                                                              5. Table 5: Global Green Coffee Industry Revenue Million Forecast, by Export Market Analysis (Value & Volume) 2019 & 2032
                                                              6. Table 6: Global Green Coffee Industry Revenue Million Forecast, by Price Trend Analysis 2019 & 2032
                                                              7. Table 7: Global Green Coffee Industry Revenue Million Forecast, by Region 2019 & 2032
                                                              8. Table 8: Global Green Coffee Industry Revenue Million Forecast, by Country 2019 & 2032
                                                              9. Table 9: United States Green Coffee Industry Revenue (Million) Forecast, by Application 2019 & 2032
                                                              10. Table 10: Canada Green Coffee Industry Revenue (Million) Forecast, by Application 2019 & 2032
                                                              11. Table 11: Mexico Green Coffee Industry Revenue (Million) Forecast, by Application 2019 & 2032
                                                              12. Table 12: Global Green Coffee Industry Revenue Million Forecast, by Country 2019 & 2032
                                                              13. Table 13: Germany Green Coffee Industry Revenue (Million) Forecast, by Application 2019 & 2032
                                                              14. Table 14: United Kingdom Green Coffee Industry Revenue (Million) Forecast, by Application 2019 & 2032
                                                              15. Table 15: France Green Coffee Industry Revenue (Million) Forecast, by Application 2019 & 2032
                                                              16. Table 16: Spain Green Coffee Industry Revenue (Million) Forecast, by Application 2019 & 2032
                                                              17. Table 17: Italy Green Coffee Industry Revenue (Million) Forecast, by Application 2019 & 2032
                                                              18. Table 18: Spain Green Coffee Industry Revenue (Million) Forecast, by Application 2019 & 2032
                                                              19. Table 19: Belgium Green Coffee Industry Revenue (Million) Forecast, by Application 2019 & 2032
                                                              20. Table 20: Netherland Green Coffee Industry Revenue (Million) Forecast, by Application 2019 & 2032
                                                              21. Table 21: Nordics Green Coffee Industry Revenue (Million) Forecast, by Application 2019 & 2032
                                                              22. Table 22: Rest of Europe Green Coffee Industry Revenue (Million) Forecast, by Application 2019 & 2032
                                                              23. Table 23: Global Green Coffee Industry Revenue Million Forecast, by Country 2019 & 2032
                                                              24. Table 24: China Green Coffee Industry Revenue (Million) Forecast, by Application 2019 & 2032
                                                              25. Table 25: Japan Green Coffee Industry Revenue (Million) Forecast, by Application 2019 & 2032
                                                              26. Table 26: India Green Coffee Industry Revenue (Million) Forecast, by Application 2019 & 2032
                                                              27. Table 27: South Korea Green Coffee Industry Revenue (Million) Forecast, by Application 2019 & 2032
                                                              28. Table 28: Southeast Asia Green Coffee Industry Revenue (Million) Forecast, by Application 2019 & 2032
                                                              29. Table 29: Australia Green Coffee Industry Revenue (Million) Forecast, by Application 2019 & 2032
                                                              30. Table 30: Indonesia Green Coffee Industry Revenue (Million) Forecast, by Application 2019 & 2032
                                                              31. Table 31: Phillipes Green Coffee Industry Revenue (Million) Forecast, by Application 2019 & 2032
                                                              32. Table 32: Singapore Green Coffee Industry Revenue (Million) Forecast, by Application 2019 & 2032
                                                              33. Table 33: Thailandc Green Coffee Industry Revenue (Million) Forecast, by Application 2019 & 2032
                                                              34. Table 34: Rest of Asia Pacific Green Coffee Industry Revenue (Million) Forecast, by Application 2019 & 2032
                                                              35. Table 35: Global Green Coffee Industry Revenue Million Forecast, by Country 2019 & 2032
                                                              36. Table 36: Brazil Green Coffee Industry Revenue (Million) Forecast, by Application 2019 & 2032
                                                              37. Table 37: Argentina Green Coffee Industry Revenue (Million) Forecast, by Application 2019 & 2032
                                                              38. Table 38: Peru Green Coffee Industry Revenue (Million) Forecast, by Application 2019 & 2032
                                                              39. Table 39: Chile Green Coffee Industry Revenue (Million) Forecast, by Application 2019 & 2032
                                                              40. Table 40: Colombia Green Coffee Industry Revenue (Million) Forecast, by Application 2019 & 2032
                                                              41. Table 41: Ecuador Green Coffee Industry Revenue (Million) Forecast, by Application 2019 & 2032
                                                              42. Table 42: Venezuela Green Coffee Industry Revenue (Million) Forecast, by Application 2019 & 2032
                                                              43. Table 43: Rest of South America Green Coffee Industry Revenue (Million) Forecast, by Application 2019 & 2032
                                                              44. Table 44: Global Green Coffee Industry Revenue Million Forecast, by Country 2019 & 2032
                                                              45. Table 45: United Arab Emirates Green Coffee Industry Revenue (Million) Forecast, by Application 2019 & 2032
                                                              46. Table 46: Saudi Arabia Green Coffee Industry Revenue (Million) Forecast, by Application 2019 & 2032
                                                              47. Table 47: South Africa Green Coffee Industry Revenue (Million) Forecast, by Application 2019 & 2032
                                                              48. Table 48: Rest of Middle East and Africa Green Coffee Industry Revenue (Million) Forecast, by Application 2019 & 2032
                                                              49. Table 49: Global Green Coffee Industry Revenue Million Forecast, by Production Analysis 2019 & 2032
                                                              50. Table 50: Global Green Coffee Industry Revenue Million Forecast, by Consumption Analysis 2019 & 2032
                                                              51. Table 51: Global Green Coffee Industry Revenue Million Forecast, by Import Market Analysis (Value & Volume) 2019 & 2032
                                                              52. Table 52: Global Green Coffee Industry Revenue Million Forecast, by Export Market Analysis (Value & Volume) 2019 & 2032
                                                              53. Table 53: Global Green Coffee Industry Revenue Million Forecast, by Price Trend Analysis 2019 & 2032
                                                              54. Table 54: Global Green Coffee Industry Revenue Million Forecast, by Country 2019 & 2032
                                                              55. Table 55: United States Green Coffee Industry Revenue (Million) Forecast, by Application 2019 & 2032
                                                              56. Table 56: Canada Green Coffee Industry Revenue (Million) Forecast, by Application 2019 & 2032
                                                              57. Table 57: Mexico Green Coffee Industry Revenue (Million) Forecast, by Application 2019 & 2032
                                                              58. Table 58: Global Green Coffee Industry Revenue Million Forecast, by Production Analysis 2019 & 2032
                                                              59. Table 59: Global Green Coffee Industry Revenue Million Forecast, by Consumption Analysis 2019 & 2032
                                                              60. Table 60: Global Green Coffee Industry Revenue Million Forecast, by Import Market Analysis (Value & Volume) 2019 & 2032
                                                              61. Table 61: Global Green Coffee Industry Revenue Million Forecast, by Export Market Analysis (Value & Volume) 2019 & 2032
                                                              62. Table 62: Global Green Coffee Industry Revenue Million Forecast, by Price Trend Analysis 2019 & 2032
                                                              63. Table 63: Global Green Coffee Industry Revenue Million Forecast, by Country 2019 & 2032
                                                              64. Table 64: Germany Green Coffee Industry Revenue (Million) Forecast, by Application 2019 & 2032
                                                              65. Table 65: United Kingdom Green Coffee Industry Revenue (Million) Forecast, by Application 2019 & 2032
                                                              66. Table 66: Spain Green Coffee Industry Revenue (Million) Forecast, by Application 2019 & 2032
                                                              67. Table 67: France Green Coffee Industry Revenue (Million) Forecast, by Application 2019 & 2032
                                                              68. Table 68: Italy Green Coffee Industry Revenue (Million) Forecast, by Application 2019 & 2032
                                                              69. Table 69: Belgium Green Coffee Industry Revenue (Million) Forecast, by Application 2019 & 2032
                                                              70. Table 70: Russia Green Coffee Industry Revenue (Million) Forecast, by Application 2019 & 2032
                                                              71. Table 71: Global Green Coffee Industry Revenue Million Forecast, by Production Analysis 2019 & 2032
                                                              72. Table 72: Global Green Coffee Industry Revenue Million Forecast, by Consumption Analysis 2019 & 2032
                                                              73. Table 73: Global Green Coffee Industry Revenue Million Forecast, by Import Market Analysis (Value & Volume) 2019 & 2032
                                                              74. Table 74: Global Green Coffee Industry Revenue Million Forecast, by Export Market Analysis (Value & Volume) 2019 & 2032
                                                              75. Table 75: Global Green Coffee Industry Revenue Million Forecast, by Price Trend Analysis 2019 & 2032
                                                              76. Table 76: Global Green Coffee Industry Revenue Million Forecast, by Country 2019 & 2032
                                                              77. Table 77: China Green Coffee Industry Revenue (Million) Forecast, by Application 2019 & 2032
                                                              78. Table 78: Vietnam Green Coffee Industry Revenue (Million) Forecast, by Application 2019 & 2032
                                                              79. Table 79: Indonesia Green Coffee Industry Revenue (Million) Forecast, by Application 2019 & 2032
                                                              80. Table 80: India Green Coffee Industry Revenue (Million) Forecast, by Application 2019 & 2032
                                                              81. Table 81: Japan Green Coffee Industry Revenue (Million) Forecast, by Application 2019 & 2032
                                                              82. Table 82: Global Green Coffee Industry Revenue Million Forecast, by Production Analysis 2019 & 2032
                                                              83. Table 83: Global Green Coffee Industry Revenue Million Forecast, by Consumption Analysis 2019 & 2032
                                                              84. Table 84: Global Green Coffee Industry Revenue Million Forecast, by Import Market Analysis (Value & Volume) 2019 & 2032
                                                              85. Table 85: Global Green Coffee Industry Revenue Million Forecast, by Export Market Analysis (Value & Volume) 2019 & 2032
                                                              86. Table 86: Global Green Coffee Industry Revenue Million Forecast, by Price Trend Analysis 2019 & 2032
                                                              87. Table 87: Global Green Coffee Industry Revenue Million Forecast, by Country 2019 & 2032
                                                              88. Table 88: Brazil Green Coffee Industry Revenue (Million) Forecast, by Application 2019 & 2032
                                                              89. Table 89: Colombia Green Coffee Industry Revenue (Million) Forecast, by Application 2019 & 2032
                                                              90. Table 90: Global Green Coffee Industry Revenue Million Forecast, by Production Analysis 2019 & 2032
                                                              91. Table 91: Global Green Coffee Industry Revenue Million Forecast, by Consumption Analysis 2019 & 2032
                                                              92. Table 92: Global Green Coffee Industry Revenue Million Forecast, by Import Market Analysis (Value & Volume) 2019 & 2032
                                                              93. Table 93: Global Green Coffee Industry Revenue Million Forecast, by Export Market Analysis (Value & Volume) 2019 & 2032
                                                              94. Table 94: Global Green Coffee Industry Revenue Million Forecast, by Price Trend Analysis 2019 & 2032
                                                              95. Table 95: Global Green Coffee Industry Revenue Million Forecast, by Country 2019 & 2032
                                                              96. Table 96: Uganda Green Coffee Industry Revenue (Million) Forecast, by Application 2019 & 2032
                                                              97. Table 97: Ethiopia Green Coffee Industry Revenue (Million) Forecast, by Application 2019 & 2032


                                                              Frequently Asked Questions

                                                              1. What is the projected Compound Annual Growth Rate (CAGR) of the Green Coffee Industry?

                                                              The projected CAGR is approximately 6.00%.

                                                              2. Which companies are prominent players in the Green Coffee Industry?

                                                              Key companies in the market include Keurig Dr Pepper , Starbucks , Nestlé , Olam International , Volcafe, Jacobs Douwe Egberts , Lavazza illycaffè , J.M. Smucker , Kraft Heinz .

                                                              3. What are the main segments of the Green Coffee Industry?

                                                              The market segments include Production Analysis, Consumption Analysis, Import Market Analysis (Value & Volume), Export Market Analysis (Value & Volume), Price Trend Analysis.

                                                              4. Can you provide details about the market size?

                                                              The market size is estimated to be USD 35.33 Million as of 2022.

                                                              5. What are some drivers contributing to market growth?

                                                              Increasing Berry Consumption for Health Benefits; Increasing Adoption of High-Technology Farm Practices; Growing Usage of Berries in the Food and Beverage Industries.

                                                              6. What are the notable trends driving market growth?

                                                              Increasing Demand for Certified Coffee.

                                                              7. Are there any restraints impacting market growth?

                                                              High Production Cost Involved in Berry Production; Increasing Disease and Pest Infestations.

                                                              8. Can you provide examples of recent developments in the market?

                                                              July 2022: The Ethiopian Coffee and Tea Authority (ECTA) released a new, comprehensive strategy for the country's coffee sector, which was developed in collaboration with the Ethiopian Institute of Agriculture Research (EIAR) and international nonprofit TechnoServe to increase coffee production by three times within next 10 years.

                                                              9. What pricing options are available for accessing the report?

                                                              Pricing options include single-user, multi-user, and enterprise licenses priced at USD 4750, USD 5250, and USD 8750 respectively.

                                                              10. Is the market size provided in terms of value or volume?

                                                              The market size is provided in terms of value, measured in Million.

                                                              11. Are there any specific market keywords associated with the report?

                                                              Yes, the market keyword associated with the report is "Green Coffee Industry," which aids in identifying and referencing the specific market segment covered.

                                                              12. How do I determine which pricing option suits my needs best?

                                                              The pricing options vary based on user requirements and access needs. Individual users may opt for single-user licenses, while businesses requiring broader access may choose multi-user or enterprise licenses for cost-effective access to the report.

                                                              13. Are there any additional resources or data provided in the Green Coffee Industry report?

                                                              While the report offers comprehensive insights, it's advisable to review the specific contents or supplementary materials provided to ascertain if additional resources or data are available.

                                                              14. How can I stay updated on further developments or reports in the Green Coffee Industry?

                                                              To stay informed about further developments, trends, and reports in the Green Coffee Industry, consider subscribing to industry newsletters, following relevant companies and organizations, or regularly checking reputable industry news sources and publications.


                                                              Methodology

                                                              Step 1 - Identification of Relevant Samples Size from Population Database

                                                              Step Chart
                                                              Bar Chart
                                                              Method Chart

                                                              Step 2 - Approaches for Defining Global Market Size (Value, Volume* & Price*)

                                                              Approach Chart
                                                              Top-down and bottom-up approaches are used to validate the global market size and estimate the market size for manufactures, regional segments, product, and application.

                                                              Note*: In applicable scenarios

                                                              Step 3 - Data Sources

                                                              Primary Research

                                                              • Web Analytics
                                                              • Survey Reports
                                                              • Research Institute
                                                              • Latest Research Reports
                                                              • Opinion Leaders

                                                              Secondary Research

                                                              • Annual Reports
                                                              • White Paper
                                                              • Latest Press Release
                                                              • Industry Association
                                                              • Paid Database
                                                              • Investor Presentations
                                                              Analyst Chart

                                                              Step 4 - Data Triangulation

                                                              Involves using different sources of information in order to increase the validity of a study

                                                              These sources are likely to be stakeholders in a program - participants, other researchers, program staff, other community members, and so on.

                                                              Then we put all data in single framework & apply various statistical tools to find out the dynamic on the market.

                                                              During the analysis stage, feedback from the stakeholder groups would be compared to determine areas of agreement as well as areas of divergence

                                                              Additionally, after gathering mixed and scattered data from a wide range of sources, data is triangulated and correlated to come up with estimated figures which are further validated through primary mediums or industry experts, opinion leaders.

                                                              About Report Pinnacle

                                                              Report Pinnacle provides top-tier market research, industry intelligence, and actionable insights for finance, technology, healthcare, and consumer sectors. Our reports empower you to make informed decisions and achieve business success.

                                                              Our expert team combines primary research, data analytics, and industry knowledge to deliver insights you can trust. We offer syndicated reports, custom research, and consulting services tailored to your unique business needs.

                                                              At Report Pinnacle, we are committed to quality, transparency, and client satisfaction. Every report is rigorously validated to ensure accuracy and relevance. Our global perspective and local expertise help you understand both broad trends and detailed market shifts.

                                                              Stay ahead with Report Pinnacle. Subscribe to our newsletter for the latest insights and research highlights, and follow us on social media for real-time updates.

                                                              Report Pinnacle – Your Partner for Reaching the Top in Market Intelligence.

                                                              artwork spiralartwork spiralRelated Reports
                                                              artwork underline

                                                              Middle East Vertical Farming Market Market Strategies for the Next Decade: 2025-2033

                                                              Booming Middle East vertical farming market analysis reveals a 14.20% CAGR, driven by water scarcity and urbanization. Explore market size, key players (Madar Farms, Crop One Holdings), segments (aeroponics, hydroponics), and regional insights (UAE, Saudi Arabia) in our comprehensive report covering 2019-2033.

                                                              July 2025
                                                              Base Year: 2024
                                                              No Of Pages: 234
                                                              Price: $4750

                                                              Malaysia Agrochemical Market Unlocking Growth Potential: 2025-2033 Analysis and Forecasts

                                                              Discover the booming Malaysian agrochemical market! Our comprehensive analysis reveals a RM 679.59 million market in 2025, projected to grow at a CAGR of 4.56% until 2033. Explore key drivers, trends, and leading companies shaping this dynamic sector.

                                                              July 2025
                                                              Base Year: 2024
                                                              No Of Pages: 150
                                                              Price: $3800

                                                              Rice Seed Treatment Market Decade Long Trends, Analysis and Forecast 2025-2033

                                                              The global rice seed treatment market is booming, projected to reach \$[estimated 2033 value] million by 2033, driven by rising demand for high-yielding rice and sustainable agriculture. Explore market trends, key players (Bayer, Syngenta, UPL), and regional growth in this comprehensive analysis.

                                                              July 2025
                                                              Base Year: 2024
                                                              No Of Pages: 234
                                                              Price: $4750

                                                              Hydrolyzed Feather Meal Industry Drivers of Growth: Opportunities to 2033

                                                              The hydrolyzed feather meal market is booming, projected to reach [estimated 2033 value based on CAGR] by 2033. Driven by sustainable agriculture and growing animal feed demand, this market offers lucrative opportunities. Learn about market trends, key players, and regional insights.

                                                              July 2025
                                                              Base Year: 2024
                                                              No Of Pages: 234
                                                              Price: $4750

                                                              South America Molluscicides Market Market Outlook and Strategic Insights

                                                              Discover the booming South American molluscicides market! This in-depth analysis reveals key trends, growth drivers, and challenges impacting the $XX million market, segmented by product type (Ferric Phosphate, Metaldehyde, etc.) and application. Learn about leading companies and projected CAGR of 3.50% through 2033.

                                                              July 2025
                                                              Base Year: 2024
                                                              No Of Pages: 150
                                                              Price: $4750

                                                              Asia-Pacific Agricultural Biologicals Market Strategic Insights for 2025 and Forecasts to 2033: Market Trends

                                                              The Asia-Pacific agricultural biologicals market is booming, projected to reach $XX million by 2033 with a 4% CAGR. Driven by sustainable farming trends and government initiatives, this market analysis explores key segments (biopesticides, biofertilizers), regional growth (China, India, Japan), and leading companies. Discover the opportunities and challenges in this dynamic sector.

                                                              July 2025
                                                              Base Year: 2024
                                                              No Of Pages: 197
                                                              Price: $3800

                                                              Exploring France Seed Treatment Market Market Disruption and Innovation

                                                              Discover the booming France seed treatment market! Learn about its €150 million valuation in 2025, 5.60% CAGR, key drivers (biological treatments, precision coating), leading companies (Syngenta, BASF, Semences de France), and future trends in this dynamic agricultural sector. Explore market segmentation and growth projections to 2033.

                                                              July 2025
                                                              Base Year: 2024
                                                              No Of Pages: 197
                                                              Price: $3800

                                                              Brazil Crops Industry Market’s Consumer Preferences: Trends and Analysis 2025-2033

                                                              Discover the booming Brazil crops market! Our analysis reveals a $100.13M (2025) industry projected to grow at a 2.60% CAGR through 2033, driven by soybeans, corn, and biofuels. Learn about key players, market trends, and regional insights.

                                                              July 2025
                                                              Base Year: 2024
                                                              No Of Pages: 197
                                                              Price: $3800

                                                              India Biofertilizer Market Strategic Market Roadmap: Analysis and Forecasts 2025-2033

                                                              Discover the booming India Biofertilizer Market! This in-depth analysis reveals a CAGR of 4% and projects significant growth to 2033, driven by sustainable farming trends and government initiatives. Explore market segments, key players, and regional insights. Learn about the opportunities and challenges shaping this vital sector.

                                                              July 2025
                                                              Base Year: 2024
                                                              No Of Pages: 197
                                                              Price: $3800

                                                              Mexico Seed Treatment Market Insightful Market Analysis: Trends and Opportunities 2025-2033

                                                              Discover the booming Mexico seed treatment market! This comprehensive analysis reveals a $158.20 million market in 2025, projected to grow at a 5.70% CAGR through 2033. Explore key drivers, trends, restraints, and leading companies shaping this dynamic sector. Learn more about market segmentation and growth opportunities in Mexico's agriculture sector.

                                                              July 2025
                                                              Base Year: 2024
                                                              No Of Pages: 197
                                                              Price: $3800

                                                              Exploring Growth Avenues in Europe Blueberry Market Market

                                                              Discover the booming European blueberry market! This in-depth analysis reveals a €8.88 billion market projected to grow at a 6.90% CAGR until 2033, driven by health trends and product diversification. Explore key players, segments, and regional insights.

                                                              July 2025
                                                              Base Year: 2024
                                                              No Of Pages: 180
                                                              Price: $4750

                                                              Germany Fertilizer Market: Competitive Landscape and Growth Trends 2025-2033

                                                              Discover the booming German fertilizer market! This in-depth analysis reveals a CAGR of 15.30% (2025-2033), driven by rising food demands and advanced farming techniques. Explore market segmentation, key players, and regional trends across North Rhine-Westphalia, Bavaria, and other key German states. Get the insights you need for informed decisions.

                                                              July 2025
                                                              Base Year: 2024
                                                              No Of Pages: 180
                                                              Price: $3800

                                                              Biostimulants Market Growth Opportunities and Market Forecast 2025-2033: A Strategic Analysis

                                                              Discover the booming biostimulants market! This in-depth analysis reveals a CAGR of 4.56%, driven by sustainable agriculture and rising food demand. Explore market segments, key players (UPL, Haifa Group, etc.), and regional growth projections (North America, Europe, Asia-Pacific) for 2025-2033. Learn how biostimulants like amino acids and seaweed extracts are transforming crop yields.

                                                              July 2025
                                                              Base Year: 2024
                                                              No Of Pages: 150
                                                              Price: $3800

                                                              South America Quinoa Seeds Industry Strategic Dynamics: Competitor Analysis 2025-2033

                                                              Discover the booming South American quinoa seeds market! This in-depth analysis reveals key trends, growth drivers, leading companies, and regional market shares from 2019-2033. Explore the potential of this lucrative industry with a projected CAGR of 12.50%.

                                                              July 2025
                                                              Base Year: 2024
                                                              No Of Pages: 180
                                                              Price: $4750

                                                              Unlocking Insights for North America Biopesticides Market Growth Strategies

                                                              The North America Biopesticides Market is booming, driven by growing demand for sustainable agriculture and stricter regulations. Discover key trends, market size projections, leading companies, and growth opportunities in this rapidly expanding sector. Explore the market's segmentation by crop type and geographic region to understand the future of biopesticides in North America.

                                                              July 2025
                                                              Base Year: 2024
                                                              No Of Pages: 197
                                                              Price: $3800

                                                              Indonesia Agrochemical Market Consumer Behavior Dynamics: Key Trends 2025-2033

                                                              Discover the booming Indonesian agrochemical market! This in-depth analysis reveals a CAGR of 4.09% through 2033, driven by rising food demand and government initiatives. Explore market size, segmentation, key players (BASF, Syngenta, etc.), and growth challenges. Invest wisely with our data-driven insights.

                                                              July 2025
                                                              Base Year: 2024
                                                              No Of Pages: 150
                                                              Price: $3800

                                                              Charting Insecticides Industry Growth: CAGR Projections for 2025-2033

                                                              The global insecticides market is booming, projected to reach $XX billion by 2033 with a 5.60% CAGR. Driven by food security needs and pest control challenges, this market analysis explores key trends, restraints, and leading companies like FMC, Bayer, and Syngenta, offering insights into application modes, crop types, and regional variations.

                                                              July 2025
                                                              Base Year: 2024
                                                              No Of Pages: 197
                                                              Price: $3800

                                                              US Vertical Farming Market to Grow at XX CAGR: Market Size Analysis and Forecasts 2025-2033

                                                              Discover the booming US vertical farming market! Explore its $3.56 billion (2025) valuation, 10.80% CAGR, key drivers, and leading companies. Learn about market segmentation, regional trends, and future growth projections in hydroponics, aeroponics, and aquaponics.

                                                              July 2025
                                                              Base Year: 2024
                                                              No Of Pages: 150
                                                              Price: $3800

                                                              Europe Agricultural Enzymes Market Strategic Insights: Analysis 2025 and Forecasts 2033

                                                              The European Agricultural Enzymes Market is booming, projected to reach €650 million by 2033 with a 10% CAGR. Driven by sustainable farming and increased food demand, this market analysis explores key trends, segments (crop protection, fertility, etc.), and leading companies like BASF and Novozymes. Discover the growth opportunities in this dynamic sector.

                                                              July 2025
                                                              Base Year: 2024
                                                              No Of Pages: 197
                                                              Price: $3800

                                                              Europe Quinoa Seed Market Analysis 2025 and Forecasts 2033: Unveiling Growth Opportunities

                                                              Discover the booming European quinoa seed market! This comprehensive analysis reveals key trends, growth drivers, and market segmentation from 2019-2033, including insights into major players and projected market value. Explore the rising demand for organic quinoa and its impact on the food and beverage industry.

                                                              July 2025
                                                              Base Year: 2024
                                                              No Of Pages: 180
                                                              Price: $4750

                                                              Business Address

                                                              Head Office

                                                              Office no. A 5010, fifth floor, Solitaire Business Hub, Near Phoenix mall, Pune, Maharashtra 411014

                                                              Contact Information

                                                              Craig Francis

                                                              Business Development Head

                                                              +17162654855

                                                              [email protected]

                                                              Connect With Us

                                                              Secure Payment Partners

                                                              payment image
                                                              RetailLogisticsPackagingAutomotiveHealthcareAgricultureEnergy & PowerFood & BeverageAerospace & DefenseChemicals & MaterialsHospitality and TourismAnimal Nutrition & WellnessConsumer Goods and ServicesReal Estate and ConstructionHome and Property ImprovementTechnology, Media and TelecomManufacturing Products and ServicesFinancial Services and Investment Intelligence

                                                              © 2025 All rights reserved


                                                              Privacy Policy
                                                              Terms and Conditions
                                                              FAQ
                                                              • Home
                                                              • About Us
                                                              • Industries
                                                                • Aerospace & Defense
                                                                • Agriculture
                                                                • Animal Nutrition & Wellness
                                                                • Automotive
                                                                • Chemicals & Materials
                                                                • Consumer Goods and Services
                                                                • Energy & Power
                                                                • Financial Services and Investment Intelligence
                                                                • Food & Beverage
                                                                • Home and Property Improvement
                                                                • Hospitality and Tourism
                                                                • Logistics
                                                                • Manufacturing Products and Services
                                                                • Packaging
                                                                • Professional and Commercial Services
                                                                • Real Estate and Construction
                                                                • Retail
                                                                • Technology, Media and Telecom
                                                                • Healthcare
                                                              • Services
                                                              • Contact
                                                              Main Logo
                                                              • Home
                                                              • About Us
                                                              • Industries
                                                                • Aerospace & Defense
                                                                • Agriculture
                                                                • Animal Nutrition & Wellness
                                                                • Automotive
                                                                • Chemicals & Materials
                                                                • Consumer Goods and Services
                                                                • Energy & Power
                                                                • Financial Services and Investment Intelligence
                                                                • Food & Beverage
                                                                • Home and Property Improvement
                                                                • Hospitality and Tourism
                                                                • Logistics
                                                                • Manufacturing Products and Services
                                                                • Packaging
                                                                • Professional and Commercial Services
                                                                • Real Estate and Construction
                                                                • Retail
                                                                • Technology, Media and Telecom
                                                                • Healthcare
                                                              • Services
                                                              • Contact
                                                              +17162654855
                                                              [email protected]

                                                              +17162654855

                                                              [email protected]