


Key Insights
The global market for Hardware Protection Boards is poised for substantial growth, projected to reach $8223 million by 2025. This expansion is driven by the increasing demand for sophisticated battery management systems (BMS) across a spectrum of applications, including consumer electronics, electric vehicles (EVs), and energy storage solutions. The market is expected to maintain a healthy Compound Annual Growth Rate (CAGR) of 5.8% from 2025 to 2033. Key growth drivers include the escalating adoption of lithium-ion battery technologies, particularly Ternary Lithium and LFP batteries, due to their superior energy density and longer lifespan. Furthermore, stringent safety regulations and the growing emphasis on energy efficiency and grid stability are further propelling the adoption of advanced BMS hardware protection boards. The automotive sector, with the burgeoning EV market, represents a significant segment, demanding robust and intelligent BMS solutions to ensure battery safety, performance, and longevity. Similarly, the energy storage segment, crucial for renewable energy integration and grid modernization, is witnessing a surge in demand for reliable hardware protection.
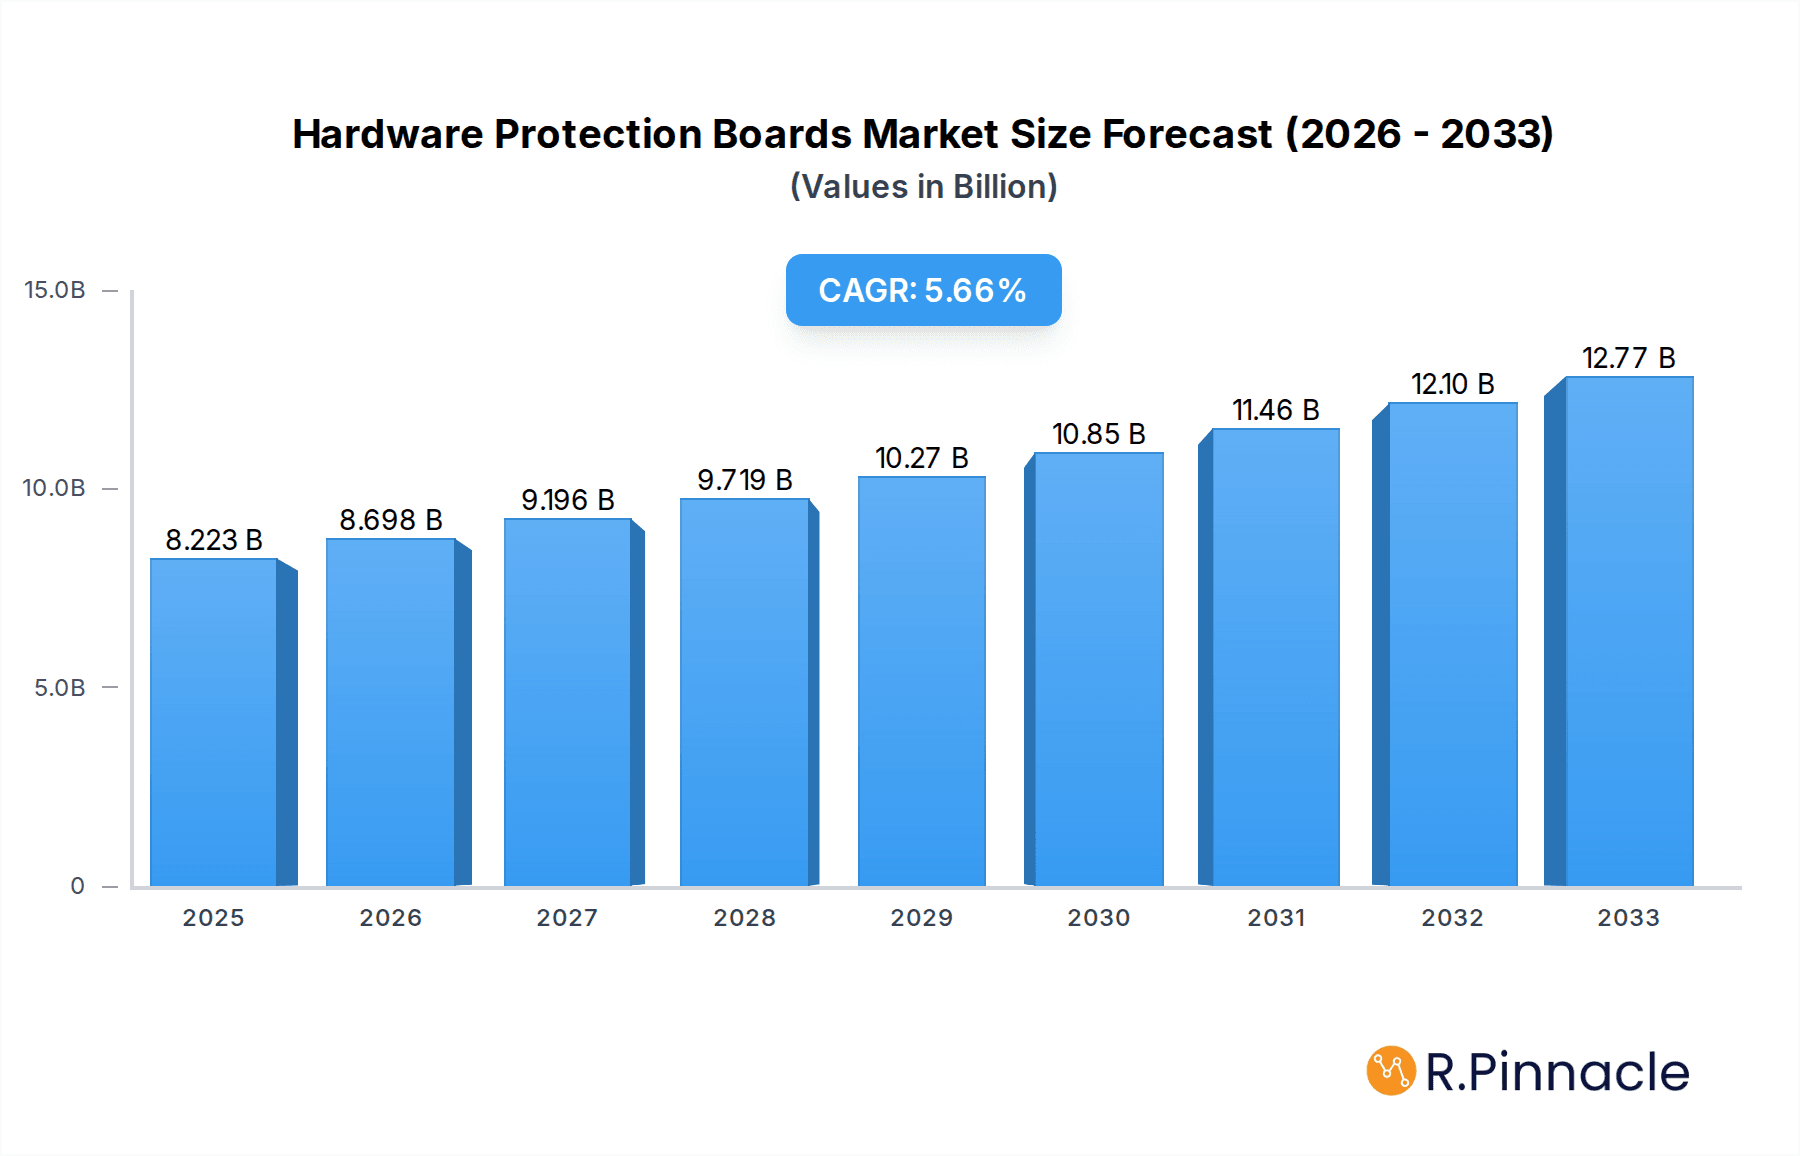
Hardware Protection Boards Market Size (In Billion)

The competitive landscape for Hardware Protection Boards is dynamic, featuring a mix of established players and emerging innovators. Companies like Lithium Balance (Sensata), Shinwa (JVCKENWOOD), and Viritech are at the forefront, developing advanced solutions catering to evolving market needs. The market’s growth is also influenced by ongoing technological advancements in battery management, including enhanced thermal management, sophisticated fault detection, and predictive maintenance capabilities. Despite the strong growth trajectory, certain restraints, such as the high cost of advanced components and the complexity of integrating new technologies, may pose challenges. However, the continuous push for innovation, coupled with increasing government support for electric mobility and renewable energy, is expected to mitigate these challenges. The Asia Pacific region, particularly China, is anticipated to dominate the market due to its robust manufacturing capabilities and high demand for electric vehicles and consumer electronics. As the world transitions towards a more sustainable energy future, the market for Hardware Protection Boards will remain critical in ensuring the safe and efficient operation of battery systems.

Hardware Protection Boards Company Market Share
Hardware Protection Boards Market: Comprehensive Analysis & Forecast (2019-2033)
This in-depth report offers a strategic overview of the global Hardware Protection Boards (HPB) market, a critical component for battery safety and performance across diverse applications. Leveraging advanced analytics and extensive industry data, we provide unparalleled insights into market dynamics, segmentation, key players, and future trends. Designed for industry professionals, stakeholders, and investors, this report empowers informed decision-making in the rapidly evolving lithium-ion battery management system (BMS) landscape. Expect to uncover market share analysis, CAGR projections, and future market potential to navigate the complexities of this vital sector.
Hardware Protection Boards Market Structure & Innovation Trends
The Hardware Protection Boards market exhibits a moderate to high concentration, with leading players like Lithium Balance (Sensata) and Shinwa (JVCKENWOOD) holding significant market share, estimated to be over 15% combined in the forecast year 2025. Innovation is predominantly driven by advancements in semiconductor technology, miniaturization, and integrated safety features. Regulatory frameworks, particularly concerning battery safety standards for electric vehicles and energy storage systems, are increasingly stringent, acting as both a driver for innovation and a barrier to entry for nascent companies. Product substitutes are limited, with direct integration of protection circuits into battery packs representing the primary alternative, albeit often less efficient and scalable. End-user demographics are shifting towards industries with high energy demands and stringent safety requirements, such as automotive BMS and energy storage BMS. Mergers and acquisitions (M&A) activity in the sector is anticipated to remain steady, with estimated deal values in the hundreds of million for strategic acquisitions aimed at expanding product portfolios and market reach.
Hardware Protection Boards Market Dynamics & Trends
The global Hardware Protection Boards market is poised for significant expansion, driven by the exponential growth of lithium-ion battery adoption across various sectors. The estimated Compound Annual Growth Rate (CAGR) for the forecast period 2025–2033 is projected to be robust, likely exceeding 12%, with market penetration increasing substantially as battery-powered solutions become ubiquitous. Key growth drivers include the escalating demand for electric vehicles (EVs), which necessitates advanced automotive BMS for optimal battery performance and safety. The burgeoning energy storage BMS sector, fueled by renewable energy integration and grid stability initiatives, also represents a substantial market opportunity. Consumer electronics, while a mature segment, continues to demand reliable and cost-effective HPBs for its vast array of devices, contributing to steady growth.
Technological disruptions are continuously shaping the HPB landscape. Innovations in smarter, more integrated protection circuits, incorporating advanced diagnostics and communication capabilities, are becoming critical. The trend towards higher energy density batteries also places greater emphasis on sophisticated protection mechanisms to prevent thermal runaway and ensure longevity. Consumer preferences are increasingly leaning towards enhanced safety features, longer battery life, and reduced charging times, all of which are directly influenced by the quality and sophistication of the HPB. Competitive dynamics are intensifying, with established players investing heavily in R&D to maintain their edge, while new entrants are emerging with niche solutions. The increasing adoption of LFP Battery technology, known for its inherent safety advantages, will also influence the design and feature sets of HPBs. The overall market penetration is expected to reach over 70% in the forecast year 2025 for key segments.
Dominant Regions & Segments in Hardware Protection Boards
Asia Pacific currently dominates the Hardware Protection Boards market, with China emerging as the leading country. This dominance is propelled by its position as a global manufacturing hub for batteries and electronic components, coupled with significant government support for the electric vehicle and renewable energy sectors. Economic policies favoring domestic production and substantial investments in infrastructure development for charging networks further bolster its market leadership. The Automotive BMS segment is a major contributor to this regional dominance, driven by the massive production of EVs in China and other Asian countries.
Within applications, Automotive BMS is projected to be the largest and fastest-growing segment, with an estimated market size of over 500 million in the forecast year 2025. This growth is directly linked to the global shift towards electric mobility and increasingly stringent automotive safety regulations. The Energy Storage BMS segment is also experiencing substantial expansion, driven by the growing need for grid-scale battery storage solutions to support renewable energy sources and enhance grid stability. The market penetration for Automotive BMS is expected to exceed 80% in the forecast year 2025.
In terms of battery types, the Ternary Lithium Battery segment currently holds a significant market share due to its widespread use in EVs and consumer electronics, offering high energy density. However, the LFP Battery segment is rapidly gaining traction due to its enhanced safety, longer lifespan, and lower cost, making it a strong contender for future dominance, especially in energy storage and entry-level EVs. Key drivers for regional dominance include robust supply chains, a skilled workforce, and favorable government incentives.
Hardware Protection Boards Product Innovations
Recent product innovations in the Hardware Protection Boards market focus on enhanced safety, miniaturization, and intelligent functionality. Manufacturers are developing advanced overcurrent, overvoltage, and overtemperature protection circuits with faster response times and higher precision. Integration of communication protocols like CAN bus and SMBus is becoming standard, enabling seamless interaction with other vehicle or system components. These advancements offer significant competitive advantages by improving battery pack reliability, extending lifespan, and ensuring compliance with evolving safety standards, particularly for demanding applications like Automotive BMS.
Report Scope & Segmentation Analysis
The Hardware Protection Boards market is segmented by Application, including Consumer BMS, Automotive BMS, Energy Storage BMS, and Construction Machinery. Consumer BMS: This segment, covering devices like laptops and power tools, is characterized by a demand for cost-effective and reliable protection. Projected to maintain steady growth with a market size of over 300 million in 2025. Automotive BMS: The largest and fastest-growing segment, driven by EV adoption and stringent safety requirements. Anticipated market size of over 500 million in 2025. Energy Storage BMS: Fueled by renewable energy growth and grid modernization, this segment offers substantial expansion opportunities. Projected market size of over 400 million in 2025. Construction Machinery: A niche but growing segment demanding robust and durable HPBs for heavy-duty applications.
The market is also segmented by Type, including Ternary Lithium Battery, LFP Battery, and Others. Ternary Lithium Battery: Currently dominant due to high energy density. LFP Battery: Rapidly gaining market share due to safety and cost benefits. Others: Encompasses various other lithium-ion chemistries.
Key Drivers of Hardware Protection Boards Growth
The growth of the Hardware Protection Boards market is propelled by several key factors. The technological imperative for enhanced battery safety and performance in electric vehicles and grid-scale energy storage systems is paramount. Economic drivers include the declining cost of lithium-ion batteries and increasing global energy demands, making battery-powered solutions more viable. Regulatory factors, such as stricter safety standards for battery packs and government incentives for EV adoption and renewable energy deployment, are significant growth accelerators. The increasing pervasiveness of smart devices also fuels demand for reliable and compact protection solutions.
Challenges in the Hardware Protection Boards Sector
Despite its promising growth, the Hardware Protection Boards sector faces several challenges. Regulatory hurdles, including the evolving landscape of battery safety standards across different regions, can lead to increased compliance costs and product development complexities. Supply chain issues, particularly for critical raw materials and semiconductor components, can impact production timelines and costs. Intense competitive pressures from both established players and emerging low-cost manufacturers exert downward pressure on pricing, impacting profit margins. Furthermore, the rapid pace of technological advancement necessitates continuous investment in R&D, posing a challenge for smaller companies.
Emerging Opportunities in Hardware Protection Boards
Emerging opportunities in the Hardware Protection Boards market are abundant. The expanding electric two-wheeler and three-wheeler market in developing economies presents a significant untapped potential. Advancements in solid-state battery technology, while still nascent, offer future opportunities for specialized HPB designs. The increasing adoption of battery swapping infrastructure for EVs also requires robust and standardized protection solutions. Furthermore, the integration of AI and machine learning for predictive battery health monitoring and fault detection within HPBs opens new avenues for value-added services and differentiated products.
Leading Players in the Hardware Protection Boards Market
- Lithium Balance (Sensata)
- Shinwa (JVCKENWOOD)
- Viritech
- Hangzhou Huasu Technology
- Shenzhen Litongwei Electronic Technology
- Shenzhen Lishen Energy Technology
- Shenzhen Tuodatong Electronics
- Shenzhen SmarTEC Technology
- Chengdu Jikong Technology
- Hunan Zhongda Anfu New Energy Technology
- Shenzhen Ruixin Power Technology
- Dongguan BestWay Technology
- Dongguan DALY Electronics
- Shenzhen Ryder Electronics
- Wuhan Yanyang Technology
- Shenzhen Han Star
- Hubei Sun Wonder New Energy Technology
- Shiyan Ant IoT Technology
- Shenzhen EMX Electronics
- Chongqing Meishun Electronic
- Guangdong Bozhi New Energy
- E&J Technology Group
- Shenzhen Hima New Energy Technology
Key Developments in Hardware Protection Boards Industry
- 2023: Launch of advanced, high-voltage protection ICs for automotive BMS, enabling faster charging and enhanced safety.
- 2022: Significant investment in R&D for integrated BMS solutions, aiming to reduce component count and cost in consumer electronics.
- 2021: Emergence of specialized HPBs for LFP batteries, catering to the growing demand for safer and more affordable energy storage systems.
- 2020: Increased focus on IoT connectivity in HPBs for remote monitoring and diagnostics in energy storage applications.
- 2019: Introduction of miniaturized protection circuits for next-generation portable electronic devices.
Future Outlook for Hardware Protection Boards Market
The future outlook for the Hardware Protection Boards market is exceptionally bright, driven by persistent megatrends in electrification and renewable energy adoption. The ongoing evolution of battery technologies will necessitate continuous innovation in protection circuits, creating sustained demand. Strategic partnerships and collaborations between HPB manufacturers and battery developers will be crucial for optimizing performance and safety. Furthermore, the increasing emphasis on sustainability and circular economy principles will likely drive the development of more durable and recyclable HPB solutions. The market is poised for continued expansion, with significant opportunities arising from emerging applications and geographical markets.
Hardware Protection Boards Segmentation
-
1. Application
- 1.1. Consumer BMS
- 1.2. Automotive BMS
- 1.3. Energy Storage BMS
- 1.4. Construction Machinery
-
2. Type
- 2.1. Ternary Lithium Battery
- 2.2. LFP Battery
- 2.3. Others
Hardware Protection Boards Segmentation By Geography
-
1. North America
- 1.1. United States
- 1.2. Canada
- 1.3. Mexico
-
2. South America
- 2.1. Brazil
- 2.2. Argentina
- 2.3. Rest of South America
-
3. Europe
- 3.1. United Kingdom
- 3.2. Germany
- 3.3. France
- 3.4. Italy
- 3.5. Spain
- 3.6. Russia
- 3.7. Benelux
- 3.8. Nordics
- 3.9. Rest of Europe
-
4. Middle East & Africa
- 4.1. Turkey
- 4.2. Israel
- 4.3. GCC
- 4.4. North Africa
- 4.5. South Africa
- 4.6. Rest of Middle East & Africa
-
5. Asia Pacific
- 5.1. China
- 5.2. India
- 5.3. Japan
- 5.4. South Korea
- 5.5. ASEAN
- 5.6. Oceania
- 5.7. Rest of Asia Pacific
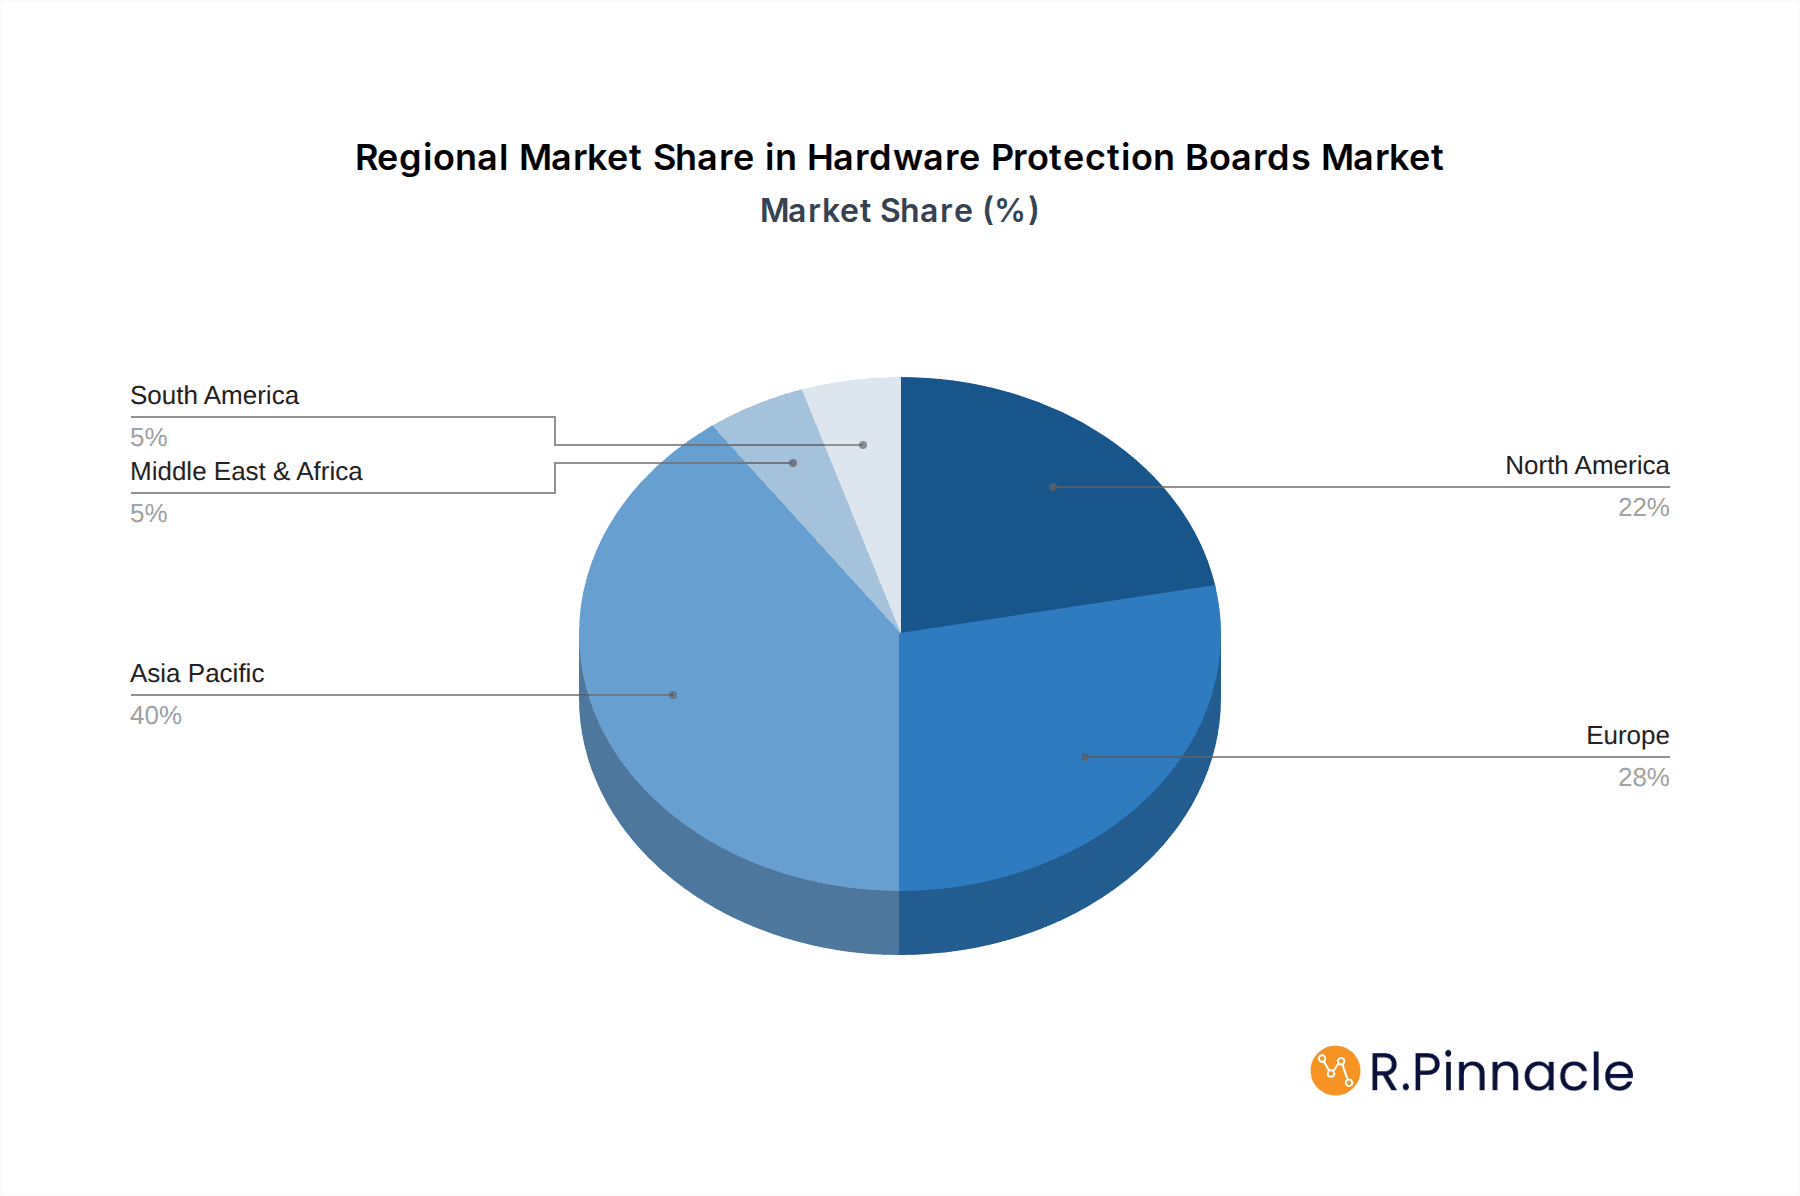
Hardware Protection Boards Regional Market Share
Geographic Coverage of Hardware Protection Boards
Hardware Protection Boards REPORT HIGHLIGHTS
| Aspects | Details |
|---|---|
| Study Period | 2020-2034 |
| Base Year | 2025 |
| Estimated Year | 2026 |
| Forecast Period | 2026-2034 |
| Historical Period | 2020-2025 |
| Growth Rate | CAGR of 5.8% from 2020-2034 |
| Segmentation |
|
Table of Contents
- 1. Introduction
- 1.1. Research Scope
- 1.2. Market Segmentation
- 1.3. Research Methodology
- 1.4. Definitions and Assumptions
- 2. Executive Summary
- 2.1. Introduction
- 3. Market Dynamics
- 3.1. Introduction
- 3.2. Market Drivers
- 3.3. Market Restrains
- 3.4. Market Trends
- 4. Market Factor Analysis
- 4.1. Porters Five Forces
- 4.2. Supply/Value Chain
- 4.3. PESTEL analysis
- 4.4. Market Entropy
- 4.5. Patent/Trademark Analysis
- 5. Global Hardware Protection Boards Analysis, Insights and Forecast, 2020-2032
- 5.1. Market Analysis, Insights and Forecast - by Application
- 5.1.1. Consumer BMS
- 5.1.2. Automotive BMS
- 5.1.3. Energy Storage BMS
- 5.1.4. Construction Machinery
- 5.2. Market Analysis, Insights and Forecast - by Type
- 5.2.1. Ternary Lithium Battery
- 5.2.2. LFP Battery
- 5.2.3. Others
- 5.3. Market Analysis, Insights and Forecast - by Region
- 5.3.1. North America
- 5.3.2. South America
- 5.3.3. Europe
- 5.3.4. Middle East & Africa
- 5.3.5. Asia Pacific
- 5.1. Market Analysis, Insights and Forecast - by Application
- 6. North America Hardware Protection Boards Analysis, Insights and Forecast, 2020-2032
- 6.1. Market Analysis, Insights and Forecast - by Application
- 6.1.1. Consumer BMS
- 6.1.2. Automotive BMS
- 6.1.3. Energy Storage BMS
- 6.1.4. Construction Machinery
- 6.2. Market Analysis, Insights and Forecast - by Type
- 6.2.1. Ternary Lithium Battery
- 6.2.2. LFP Battery
- 6.2.3. Others
- 6.1. Market Analysis, Insights and Forecast - by Application
- 7. South America Hardware Protection Boards Analysis, Insights and Forecast, 2020-2032
- 7.1. Market Analysis, Insights and Forecast - by Application
- 7.1.1. Consumer BMS
- 7.1.2. Automotive BMS
- 7.1.3. Energy Storage BMS
- 7.1.4. Construction Machinery
- 7.2. Market Analysis, Insights and Forecast - by Type
- 7.2.1. Ternary Lithium Battery
- 7.2.2. LFP Battery
- 7.2.3. Others
- 7.1. Market Analysis, Insights and Forecast - by Application
- 8. Europe Hardware Protection Boards Analysis, Insights and Forecast, 2020-2032
- 8.1. Market Analysis, Insights and Forecast - by Application
- 8.1.1. Consumer BMS
- 8.1.2. Automotive BMS
- 8.1.3. Energy Storage BMS
- 8.1.4. Construction Machinery
- 8.2. Market Analysis, Insights and Forecast - by Type
- 8.2.1. Ternary Lithium Battery
- 8.2.2. LFP Battery
- 8.2.3. Others
- 8.1. Market Analysis, Insights and Forecast - by Application
- 9. Middle East & Africa Hardware Protection Boards Analysis, Insights and Forecast, 2020-2032
- 9.1. Market Analysis, Insights and Forecast - by Application
- 9.1.1. Consumer BMS
- 9.1.2. Automotive BMS
- 9.1.3. Energy Storage BMS
- 9.1.4. Construction Machinery
- 9.2. Market Analysis, Insights and Forecast - by Type
- 9.2.1. Ternary Lithium Battery
- 9.2.2. LFP Battery
- 9.2.3. Others
- 9.1. Market Analysis, Insights and Forecast - by Application
- 10. Asia Pacific Hardware Protection Boards Analysis, Insights and Forecast, 2020-2032
- 10.1. Market Analysis, Insights and Forecast - by Application
- 10.1.1. Consumer BMS
- 10.1.2. Automotive BMS
- 10.1.3. Energy Storage BMS
- 10.1.4. Construction Machinery
- 10.2. Market Analysis, Insights and Forecast - by Type
- 10.2.1. Ternary Lithium Battery
- 10.2.2. LFP Battery
- 10.2.3. Others
- 10.1. Market Analysis, Insights and Forecast - by Application
- 11. Competitive Analysis
- 11.1. Global Market Share Analysis 2025
- 11.2. Company Profiles
- 11.2.1 Lithium Balance (Sensata)
- 11.2.1.1. Overview
- 11.2.1.2. Products
- 11.2.1.3. SWOT Analysis
- 11.2.1.4. Recent Developments
- 11.2.1.5. Financials (Based on Availability)
- 11.2.2 Shinwa (JVCKENWOOD)
- 11.2.2.1. Overview
- 11.2.2.2. Products
- 11.2.2.3. SWOT Analysis
- 11.2.2.4. Recent Developments
- 11.2.2.5. Financials (Based on Availability)
- 11.2.3 Viritech
- 11.2.3.1. Overview
- 11.2.3.2. Products
- 11.2.3.3. SWOT Analysis
- 11.2.3.4. Recent Developments
- 11.2.3.5. Financials (Based on Availability)
- 11.2.4 Hangzhou Huasu Technology
- 11.2.4.1. Overview
- 11.2.4.2. Products
- 11.2.4.3. SWOT Analysis
- 11.2.4.4. Recent Developments
- 11.2.4.5. Financials (Based on Availability)
- 11.2.5 Shenzhen Litongwei Electronic Technology
- 11.2.5.1. Overview
- 11.2.5.2. Products
- 11.2.5.3. SWOT Analysis
- 11.2.5.4. Recent Developments
- 11.2.5.5. Financials (Based on Availability)
- 11.2.6 Shenzhen Lishen Energy Technology
- 11.2.6.1. Overview
- 11.2.6.2. Products
- 11.2.6.3. SWOT Analysis
- 11.2.6.4. Recent Developments
- 11.2.6.5. Financials (Based on Availability)
- 11.2.7 Shenzhen Tuodatong Electronics
- 11.2.7.1. Overview
- 11.2.7.2. Products
- 11.2.7.3. SWOT Analysis
- 11.2.7.4. Recent Developments
- 11.2.7.5. Financials (Based on Availability)
- 11.2.8 Shenzhen SmarTEC Technology
- 11.2.8.1. Overview
- 11.2.8.2. Products
- 11.2.8.3. SWOT Analysis
- 11.2.8.4. Recent Developments
- 11.2.8.5. Financials (Based on Availability)
- 11.2.9 Chengdu Jikong Technology
- 11.2.9.1. Overview
- 11.2.9.2. Products
- 11.2.9.3. SWOT Analysis
- 11.2.9.4. Recent Developments
- 11.2.9.5. Financials (Based on Availability)
- 11.2.10 Hunan Zhongda Anfu New Energy Technology
- 11.2.10.1. Overview
- 11.2.10.2. Products
- 11.2.10.3. SWOT Analysis
- 11.2.10.4. Recent Developments
- 11.2.10.5. Financials (Based on Availability)
- 11.2.11 Shenzhen Ruixin Power Technology
- 11.2.11.1. Overview
- 11.2.11.2. Products
- 11.2.11.3. SWOT Analysis
- 11.2.11.4. Recent Developments
- 11.2.11.5. Financials (Based on Availability)
- 11.2.12 Dongguan BestWay Technology
- 11.2.12.1. Overview
- 11.2.12.2. Products
- 11.2.12.3. SWOT Analysis
- 11.2.12.4. Recent Developments
- 11.2.12.5. Financials (Based on Availability)
- 11.2.13 Dongguan DALY Electronics
- 11.2.13.1. Overview
- 11.2.13.2. Products
- 11.2.13.3. SWOT Analysis
- 11.2.13.4. Recent Developments
- 11.2.13.5. Financials (Based on Availability)
- 11.2.14 Shenzhen Ryder Electronics
- 11.2.14.1. Overview
- 11.2.14.2. Products
- 11.2.14.3. SWOT Analysis
- 11.2.14.4. Recent Developments
- 11.2.14.5. Financials (Based on Availability)
- 11.2.15 Wuhan Yanyang Technology
- 11.2.15.1. Overview
- 11.2.15.2. Products
- 11.2.15.3. SWOT Analysis
- 11.2.15.4. Recent Developments
- 11.2.15.5. Financials (Based on Availability)
- 11.2.16 Shenzhen Han Star
- 11.2.16.1. Overview
- 11.2.16.2. Products
- 11.2.16.3. SWOT Analysis
- 11.2.16.4. Recent Developments
- 11.2.16.5. Financials (Based on Availability)
- 11.2.17 Hubei Sun Wonder New Energy Technology
- 11.2.17.1. Overview
- 11.2.17.2. Products
- 11.2.17.3. SWOT Analysis
- 11.2.17.4. Recent Developments
- 11.2.17.5. Financials (Based on Availability)
- 11.2.18 Shiyan Ant IoT Technology
- 11.2.18.1. Overview
- 11.2.18.2. Products
- 11.2.18.3. SWOT Analysis
- 11.2.18.4. Recent Developments
- 11.2.18.5. Financials (Based on Availability)
- 11.2.19 Shenzhen EMX Electronics
- 11.2.19.1. Overview
- 11.2.19.2. Products
- 11.2.19.3. SWOT Analysis
- 11.2.19.4. Recent Developments
- 11.2.19.5. Financials (Based on Availability)
- 11.2.20 Chongqing Meishun Electronic
- 11.2.20.1. Overview
- 11.2.20.2. Products
- 11.2.20.3. SWOT Analysis
- 11.2.20.4. Recent Developments
- 11.2.20.5. Financials (Based on Availability)
- 11.2.21 Guangdong Bozhi New Energy
- 11.2.21.1. Overview
- 11.2.21.2. Products
- 11.2.21.3. SWOT Analysis
- 11.2.21.4. Recent Developments
- 11.2.21.5. Financials (Based on Availability)
- 11.2.22 E&J Technology Group
- 11.2.22.1. Overview
- 11.2.22.2. Products
- 11.2.22.3. SWOT Analysis
- 11.2.22.4. Recent Developments
- 11.2.22.5. Financials (Based on Availability)
- 11.2.23 Shenzhen Hima New Energy Technology
- 11.2.23.1. Overview
- 11.2.23.2. Products
- 11.2.23.3. SWOT Analysis
- 11.2.23.4. Recent Developments
- 11.2.23.5. Financials (Based on Availability)
- 11.2.1 Lithium Balance (Sensata)
List of Figures
- Figure 1: Global Hardware Protection Boards Revenue Breakdown (million, %) by Region 2025 & 2033
- Figure 2: North America Hardware Protection Boards Revenue (million), by Application 2025 & 2033
- Figure 3: North America Hardware Protection Boards Revenue Share (%), by Application 2025 & 2033
- Figure 4: North America Hardware Protection Boards Revenue (million), by Type 2025 & 2033
- Figure 5: North America Hardware Protection Boards Revenue Share (%), by Type 2025 & 2033
- Figure 6: North America Hardware Protection Boards Revenue (million), by Country 2025 & 2033
- Figure 7: North America Hardware Protection Boards Revenue Share (%), by Country 2025 & 2033
- Figure 8: South America Hardware Protection Boards Revenue (million), by Application 2025 & 2033
- Figure 9: South America Hardware Protection Boards Revenue Share (%), by Application 2025 & 2033
- Figure 10: South America Hardware Protection Boards Revenue (million), by Type 2025 & 2033
- Figure 11: South America Hardware Protection Boards Revenue Share (%), by Type 2025 & 2033
- Figure 12: South America Hardware Protection Boards Revenue (million), by Country 2025 & 2033
- Figure 13: South America Hardware Protection Boards Revenue Share (%), by Country 2025 & 2033
- Figure 14: Europe Hardware Protection Boards Revenue (million), by Application 2025 & 2033
- Figure 15: Europe Hardware Protection Boards Revenue Share (%), by Application 2025 & 2033
- Figure 16: Europe Hardware Protection Boards Revenue (million), by Type 2025 & 2033
- Figure 17: Europe Hardware Protection Boards Revenue Share (%), by Type 2025 & 2033
- Figure 18: Europe Hardware Protection Boards Revenue (million), by Country 2025 & 2033
- Figure 19: Europe Hardware Protection Boards Revenue Share (%), by Country 2025 & 2033
- Figure 20: Middle East & Africa Hardware Protection Boards Revenue (million), by Application 2025 & 2033
- Figure 21: Middle East & Africa Hardware Protection Boards Revenue Share (%), by Application 2025 & 2033
- Figure 22: Middle East & Africa Hardware Protection Boards Revenue (million), by Type 2025 & 2033
- Figure 23: Middle East & Africa Hardware Protection Boards Revenue Share (%), by Type 2025 & 2033
- Figure 24: Middle East & Africa Hardware Protection Boards Revenue (million), by Country 2025 & 2033
- Figure 25: Middle East & Africa Hardware Protection Boards Revenue Share (%), by Country 2025 & 2033
- Figure 26: Asia Pacific Hardware Protection Boards Revenue (million), by Application 2025 & 2033
- Figure 27: Asia Pacific Hardware Protection Boards Revenue Share (%), by Application 2025 & 2033
- Figure 28: Asia Pacific Hardware Protection Boards Revenue (million), by Type 2025 & 2033
- Figure 29: Asia Pacific Hardware Protection Boards Revenue Share (%), by Type 2025 & 2033
- Figure 30: Asia Pacific Hardware Protection Boards Revenue (million), by Country 2025 & 2033
- Figure 31: Asia Pacific Hardware Protection Boards Revenue Share (%), by Country 2025 & 2033
List of Tables
- Table 1: Global Hardware Protection Boards Revenue million Forecast, by Application 2020 & 2033
- Table 2: Global Hardware Protection Boards Revenue million Forecast, by Type 2020 & 2033
- Table 3: Global Hardware Protection Boards Revenue million Forecast, by Region 2020 & 2033
- Table 4: Global Hardware Protection Boards Revenue million Forecast, by Application 2020 & 2033
- Table 5: Global Hardware Protection Boards Revenue million Forecast, by Type 2020 & 2033
- Table 6: Global Hardware Protection Boards Revenue million Forecast, by Country 2020 & 2033
- Table 7: United States Hardware Protection Boards Revenue (million) Forecast, by Application 2020 & 2033
- Table 8: Canada Hardware Protection Boards Revenue (million) Forecast, by Application 2020 & 2033
- Table 9: Mexico Hardware Protection Boards Revenue (million) Forecast, by Application 2020 & 2033
- Table 10: Global Hardware Protection Boards Revenue million Forecast, by Application 2020 & 2033
- Table 11: Global Hardware Protection Boards Revenue million Forecast, by Type 2020 & 2033
- Table 12: Global Hardware Protection Boards Revenue million Forecast, by Country 2020 & 2033
- Table 13: Brazil Hardware Protection Boards Revenue (million) Forecast, by Application 2020 & 2033
- Table 14: Argentina Hardware Protection Boards Revenue (million) Forecast, by Application 2020 & 2033
- Table 15: Rest of South America Hardware Protection Boards Revenue (million) Forecast, by Application 2020 & 2033
- Table 16: Global Hardware Protection Boards Revenue million Forecast, by Application 2020 & 2033
- Table 17: Global Hardware Protection Boards Revenue million Forecast, by Type 2020 & 2033
- Table 18: Global Hardware Protection Boards Revenue million Forecast, by Country 2020 & 2033
- Table 19: United Kingdom Hardware Protection Boards Revenue (million) Forecast, by Application 2020 & 2033
- Table 20: Germany Hardware Protection Boards Revenue (million) Forecast, by Application 2020 & 2033
- Table 21: France Hardware Protection Boards Revenue (million) Forecast, by Application 2020 & 2033
- Table 22: Italy Hardware Protection Boards Revenue (million) Forecast, by Application 2020 & 2033
- Table 23: Spain Hardware Protection Boards Revenue (million) Forecast, by Application 2020 & 2033
- Table 24: Russia Hardware Protection Boards Revenue (million) Forecast, by Application 2020 & 2033
- Table 25: Benelux Hardware Protection Boards Revenue (million) Forecast, by Application 2020 & 2033
- Table 26: Nordics Hardware Protection Boards Revenue (million) Forecast, by Application 2020 & 2033
- Table 27: Rest of Europe Hardware Protection Boards Revenue (million) Forecast, by Application 2020 & 2033
- Table 28: Global Hardware Protection Boards Revenue million Forecast, by Application 2020 & 2033
- Table 29: Global Hardware Protection Boards Revenue million Forecast, by Type 2020 & 2033
- Table 30: Global Hardware Protection Boards Revenue million Forecast, by Country 2020 & 2033
- Table 31: Turkey Hardware Protection Boards Revenue (million) Forecast, by Application 2020 & 2033
- Table 32: Israel Hardware Protection Boards Revenue (million) Forecast, by Application 2020 & 2033
- Table 33: GCC Hardware Protection Boards Revenue (million) Forecast, by Application 2020 & 2033
- Table 34: North Africa Hardware Protection Boards Revenue (million) Forecast, by Application 2020 & 2033
- Table 35: South Africa Hardware Protection Boards Revenue (million) Forecast, by Application 2020 & 2033
- Table 36: Rest of Middle East & Africa Hardware Protection Boards Revenue (million) Forecast, by Application 2020 & 2033
- Table 37: Global Hardware Protection Boards Revenue million Forecast, by Application 2020 & 2033
- Table 38: Global Hardware Protection Boards Revenue million Forecast, by Type 2020 & 2033
- Table 39: Global Hardware Protection Boards Revenue million Forecast, by Country 2020 & 2033
- Table 40: China Hardware Protection Boards Revenue (million) Forecast, by Application 2020 & 2033
- Table 41: India Hardware Protection Boards Revenue (million) Forecast, by Application 2020 & 2033
- Table 42: Japan Hardware Protection Boards Revenue (million) Forecast, by Application 2020 & 2033
- Table 43: South Korea Hardware Protection Boards Revenue (million) Forecast, by Application 2020 & 2033
- Table 44: ASEAN Hardware Protection Boards Revenue (million) Forecast, by Application 2020 & 2033
- Table 45: Oceania Hardware Protection Boards Revenue (million) Forecast, by Application 2020 & 2033
- Table 46: Rest of Asia Pacific Hardware Protection Boards Revenue (million) Forecast, by Application 2020 & 2033
Frequently Asked Questions
1. What is the projected Compound Annual Growth Rate (CAGR) of the Hardware Protection Boards?
The projected CAGR is approximately 5.8%.
2. Which companies are prominent players in the Hardware Protection Boards?
Key companies in the market include Lithium Balance (Sensata), Shinwa (JVCKENWOOD), Viritech, Hangzhou Huasu Technology, Shenzhen Litongwei Electronic Technology, Shenzhen Lishen Energy Technology, Shenzhen Tuodatong Electronics, Shenzhen SmarTEC Technology, Chengdu Jikong Technology, Hunan Zhongda Anfu New Energy Technology, Shenzhen Ruixin Power Technology, Dongguan BestWay Technology, Dongguan DALY Electronics, Shenzhen Ryder Electronics, Wuhan Yanyang Technology, Shenzhen Han Star, Hubei Sun Wonder New Energy Technology, Shiyan Ant IoT Technology, Shenzhen EMX Electronics, Chongqing Meishun Electronic, Guangdong Bozhi New Energy, E&J Technology Group, Shenzhen Hima New Energy Technology.
3. What are the main segments of the Hardware Protection Boards?
The market segments include Application, Type.
4. Can you provide details about the market size?
The market size is estimated to be USD 8223 million as of 2022.
5. What are some drivers contributing to market growth?
N/A
6. What are the notable trends driving market growth?
N/A
7. Are there any restraints impacting market growth?
N/A
8. Can you provide examples of recent developments in the market?
N/A
9. What pricing options are available for accessing the report?
Pricing options include single-user, multi-user, and enterprise licenses priced at USD 4250.00, USD 6375.00, and USD 8500.00 respectively.
10. Is the market size provided in terms of value or volume?
The market size is provided in terms of value, measured in million.
11. Are there any specific market keywords associated with the report?
Yes, the market keyword associated with the report is "Hardware Protection Boards," which aids in identifying and referencing the specific market segment covered.
12. How do I determine which pricing option suits my needs best?
The pricing options vary based on user requirements and access needs. Individual users may opt for single-user licenses, while businesses requiring broader access may choose multi-user or enterprise licenses for cost-effective access to the report.
13. Are there any additional resources or data provided in the Hardware Protection Boards report?
While the report offers comprehensive insights, it's advisable to review the specific contents or supplementary materials provided to ascertain if additional resources or data are available.
14. How can I stay updated on further developments or reports in the Hardware Protection Boards?
To stay informed about further developments, trends, and reports in the Hardware Protection Boards, consider subscribing to industry newsletters, following relevant companies and organizations, or regularly checking reputable industry news sources and publications.
Methodology
Step 1 - Identification of Relevant Samples Size from Population Database


Step 2 - Approaches for Defining Global Market Size (Value, Volume* & Price*)

Note*: In applicable scenarios
Step 3 - Data Sources
Primary Research
- Web Analytics
- Survey Reports
- Research Institute
- Latest Research Reports
- Opinion Leaders
Secondary Research
- Annual Reports
- White Paper
- Latest Press Release
- Industry Association
- Paid Database
- Investor Presentations

Step 4 - Data Triangulation
Involves using different sources of information in order to increase the validity of a study
These sources are likely to be stakeholders in a program - participants, other researchers, program staff, other community members, and so on.
Then we put all data in single framework & apply various statistical tools to find out the dynamic on the market.
During the analysis stage, feedback from the stakeholder groups would be compared to determine areas of agreement as well as areas of divergence