
Key Insights
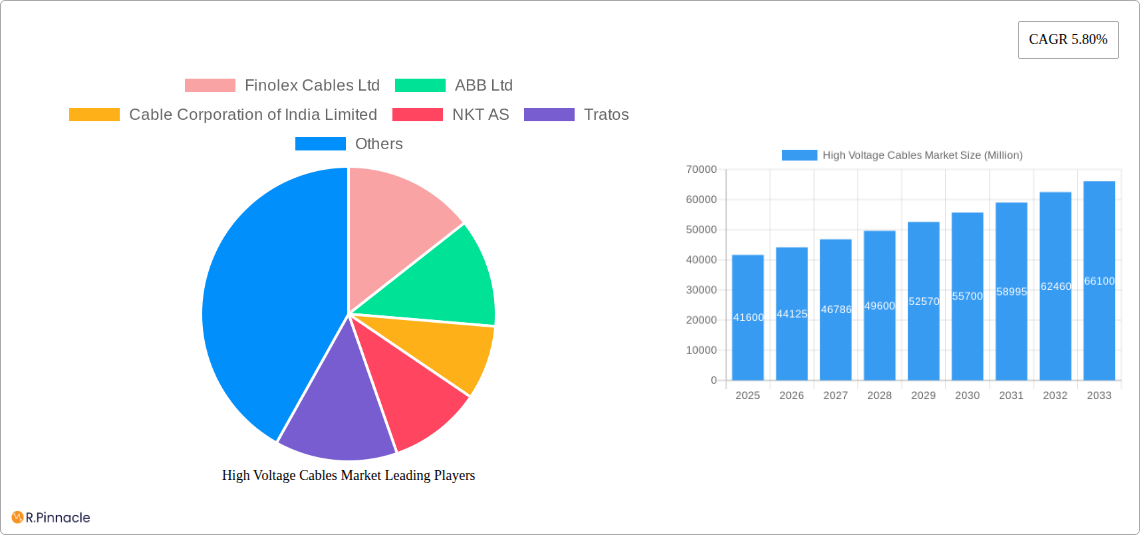
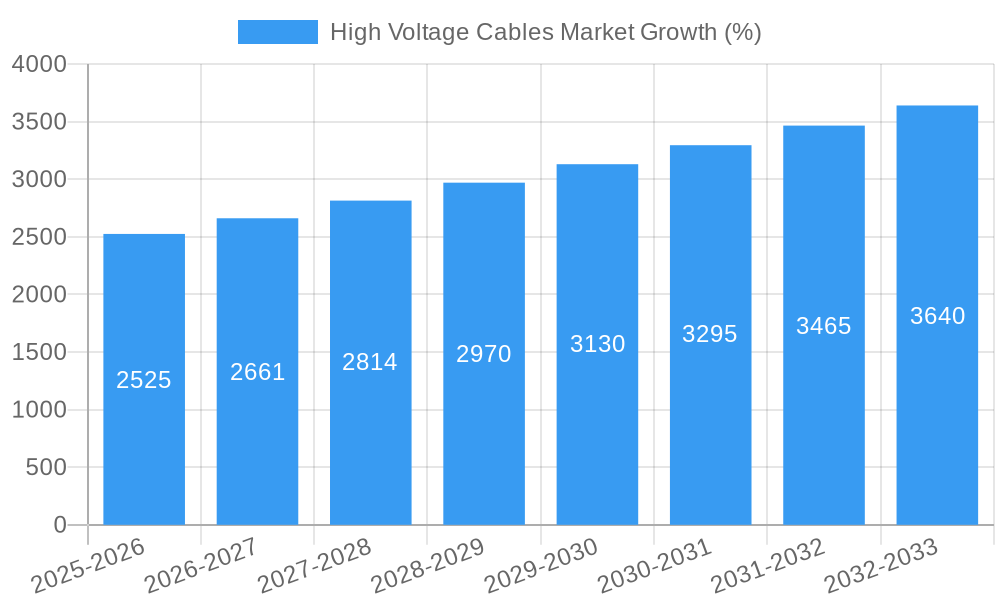
The global High Voltage Cables market, valued at $41.60 billion in 2025, is projected to experience robust growth, exhibiting a Compound Annual Growth Rate (CAGR) of 5.80% from 2025 to 2033. This expansion is driven by the escalating demand for electricity globally, particularly in emerging economies experiencing rapid industrialization and urbanization. The increasing adoption of renewable energy sources, such as solar and wind power, further fuels market growth as these technologies require extensive high-voltage transmission infrastructure. Furthermore, the ongoing upgrades and expansion of existing power grids, coupled with the need for improved grid reliability and efficiency, are key factors contributing to the market's upward trajectory. Significant investments in smart grid technologies and the development of advanced high-voltage cable systems with enhanced performance characteristics, such as increased capacity and durability, are also shaping market dynamics. The market is segmented by location of deployment (overhead, underground, submarine), type of transmission (HVDC, HVAC), and voltage level (50KV-110KV, 115KV-330KV, >330KV), offering diverse opportunities for specialized cable manufacturers. Key players like ABB Ltd, Prysmian SpA, and Nexans SA are leading the innovation and market share capture within this competitive landscape.
Geographic distribution reveals significant regional variations. North America and Europe currently hold substantial market share, driven by well-established power grids and robust regulatory frameworks. However, the Asia-Pacific region is expected to witness the most significant growth over the forecast period, fueled by the rapid economic development and infrastructure expansion in countries like China and India. While challenges such as high installation costs and stringent regulatory compliance in certain regions may act as restraints, the long-term outlook remains optimistic, supported by continuous advancements in cable technology and the urgent global need for reliable and efficient power transmission. The market is projected to surpass $65 billion by 2033, showcasing considerable potential for investors and industry participants.
High Voltage Cables Market Report: 2019-2033
This comprehensive report provides an in-depth analysis of the High Voltage Cables Market, offering valuable insights for industry professionals, investors, and strategic decision-makers. With a study period spanning 2019-2033, a base year of 2025, and a forecast period of 2025-2033, this report delivers a holistic view of market dynamics, trends, and future projections. The report leverages extensive research and data analysis to provide actionable insights into market size, segmentation, and growth opportunities.
High Voltage Cables Market Structure & Innovation Trends
This section analyzes the competitive landscape of the High Voltage Cables market, including market concentration, key innovation drivers, regulatory impacts, and the influence of substitute products. The report examines end-user demographics and significant M&A activities within the industry. We assess market share distribution amongst leading players like Finolex Cables Ltd, ABB Ltd, Cable Corporation of India Limited, NKT AS, Tratos, Prysmian SpA, Siemens AG, Nexans SA, and Southwire Company LLC. The report includes analysis of M&A deal values and their impact on market consolidation. Market concentration is estimated to be xx%, indicating a [description of market concentration – e.g., moderately concentrated, highly fragmented] market. Innovation drivers include [List 3-5 key innovation drivers e.g., advancements in materials science, increasing demand for renewable energy, stringent environmental regulations]. Regulatory frameworks vary across regions, influencing market access and product standards. The prevalence of product substitutes, such as [list substitute products e.g., optical fibers], is also considered.
High Voltage Cables Market Dynamics & Trends
This section delves into the market's growth trajectory, technological disruptions, evolving consumer preferences, and competitive dynamics. We analyze market growth drivers, including the increasing demand for electricity transmission and distribution infrastructure globally, the expansion of renewable energy sources, and grid modernization initiatives. The compound annual growth rate (CAGR) is projected to be xx% during the forecast period (2025-2033), driven by factors such as [specific growth drivers, e.g., urbanization, industrialization, government investments]. Market penetration of high-voltage cables in key regions is also examined. Technological advancements, such as the development of more efficient and durable cable materials, are shaping the market landscape. Competitive dynamics are influenced by factors such as pricing strategies, technological innovation, and market share competition among key players.
Dominant Regions & Segments in High Voltage Cables Market
This section identifies the leading regions and segments within the High Voltage Cables Market. The analysis considers location of deployment (Overhead Cables, Underground Cables, Submarine Cables), type of transmission (HVDC, HVAC), and voltage level (50KV - 110KV, 115KV - 330KV, Greater than 330KV).
Leading Region/Country: [Specify leading region/country and reasons, e.g., North America, due to significant investments in grid infrastructure and the growing adoption of renewable energy sources].
Key Drivers (by Segment):
- Overhead Cables: [Explain factors driving growth, e.g., cost-effectiveness for long-distance transmission].
- Underground Cables: [Explain factors driving growth, e.g., increasing urbanization and need for reliable power supply in densely populated areas].
- Submarine Cables: [Explain factors driving growth, e.g., growing offshore wind energy projects and interconnection of electricity grids across countries].
- HVDC: [Explain factors driving growth, e.g., efficient transmission over long distances and reduced power losses].
- HVAC: [Explain factors driving growth, e.g., established technology and widespread adoption in existing grids].
- Voltage Levels: Growth is projected to be highest in the [specify voltage level segment, e.g., Greater than 330KV segment] due to [explain the drivers, e.g., the increasing need for long-distance, high-capacity power transmission].
Dominance analysis includes a detailed examination of market share, revenue generation, and growth potential across different regions and segments.
High Voltage Cables Market Product Innovations
Recent product developments in the high-voltage cables market focus on improving efficiency, durability, and safety. This includes advancements in insulation materials, conductor designs, and monitoring technologies. New applications are emerging in renewable energy integration, smart grids, and electric vehicle charging infrastructure. These innovations provide competitive advantages by enhancing performance, reliability, and cost-effectiveness, better meeting the evolving needs of the market.
Report Scope & Segmentation Analysis
This report segments the High Voltage Cables market based on Location of Deployment (Overhead, Underground, Submarine), Type of Transmission (HVDC, HVAC), and Voltage Level (50KV-110KV, 115KV-330KV, >330KV). Each segment is analyzed in terms of market size, growth projections, and competitive dynamics. [Example: The Overhead Cables segment is projected to grow at xx% CAGR driven by [reason]. The HVDC segment shows robust growth due to [reason]. The >330KV voltage level segment is witnessing significant expansion due to [reason].] Market sizes for each segment are detailed within the full report.
Key Drivers of High Voltage Cables Market Growth
The growth of the High Voltage Cables Market is propelled by several key factors. These include the increasing demand for electricity in both developed and developing economies, the expansion of renewable energy projects requiring efficient transmission infrastructure, and government initiatives promoting grid modernization and upgrades. Technological advancements such as the development of high-temperature superconductors are also creating new opportunities.
Challenges in the High Voltage Cables Market Sector
The High Voltage Cables Market faces several challenges. These include the high initial investment costs associated with the installation of new high-voltage cable systems, the complexity of installation and maintenance, and potential environmental concerns related to the disposal of used cables. Supply chain disruptions and fluctuations in raw material prices also pose significant challenges.
Emerging Opportunities in High Voltage Cables Market
Emerging opportunities exist in the development of advanced cable materials, integration with smart grid technologies, and expansion into new geographic markets. The increasing adoption of renewable energy sources, particularly offshore wind power, is driving the demand for submarine high-voltage cables.
Leading Players in the High Voltage Cables Market Market
- Finolex Cables Ltd
- ABB Ltd (ABB)
- Cable Corporation of India Limited
- NKT AS (NKT)
- Tratos
- Prysmian SpA (Prysmian)
- Siemens AG (Siemens)
- Nexans SA (Nexans)
- Southwire Company LLC (Southwire)
Key Developments in High Voltage Cables Market Industry
- July 2022: Hitachi Energy India Ltd secured a major order from Adani Mumbai Electric Infrastructure for an 80-kilometer, 1000 MW HVDC transmission system, boosting Mumbai's power supply by almost 50%. This highlights the growing demand for HVDC technology in large-scale infrastructure projects.
- January 2023: ALLETE and Grid United signed a memorandum of understanding to explore transmission opportunities, including a North Plains high-voltage cables connector development agreement. This USD 2.5 Billion project signifies substantial investment in high-voltage cable infrastructure.
Future Outlook for High Voltage Cables Market Market
The High Voltage Cables Market is poised for continued growth, driven by the global energy transition and the increasing demand for reliable and efficient power transmission. Strategic opportunities lie in investing in research and development, expanding into new markets, and establishing strong partnerships within the energy sector. The market is expected to witness significant expansion, particularly in the renewable energy and smart grid sectors. The focus on improving grid efficiency and reliability will drive demand for advanced high-voltage cable technologies.
High Voltage Cables Market Segmentation
-
1. Location of Deployment
- 1.1. Overhead Cables
- 1.2. Underground Cables
- 1.3. Submarine Cables
-
2. Type of Transmission
- 2.1. HVDC
- 2.2. HVAC
-
3. Voltage Level
- 3.1. 50KV - 110KV
- 3.2. 115KV - 330KV
- 3.3. Greater than 330KV
High Voltage Cables Market Segmentation By Geography
-
1. North America
- 1.1. United States
- 1.2. Canada
- 1.3. Rest of North America
-
2. Asia Pacific
- 2.1. China
- 2.2. India
- 2.3. Japan
- 2.4. Australia
- 2.5. Malaysia
- 2.6. Rest of Asia Pacific
-
3. Europe
- 3.1. Germany
- 3.2. United Kingdom
- 3.3. Italy
- 3.4. France
- 3.5. Rest of Europe
-
4. South America
- 4.1. Brazil
- 4.2. Argentina
- 4.3. Rest of South America
-
5. Middle East and Africa
- 5.1. Saudi Arabia
- 5.2. United Arab Emirates
- 5.3. Qatar
- 5.4. South Africa
- 5.5. Egypt
- 5.6. Rest of Middle East and Africa

High Voltage Cables Market REPORT HIGHLIGHTS
| Aspects | Details |
|---|---|
| Study Period | 2019-2033 |
| Base Year | 2024 |
| Estimated Year | 2025 |
| Forecast Period | 2025-2033 |
| Historical Period | 2019-2024 |
| Growth Rate | CAGR of 5.80% from 2019-2033 |
| Segmentation |
|
Table of Contents
- 1. Introduction
- 1.1. Research Scope
- 1.2. Market Segmentation
- 1.3. Research Methodology
- 1.4. Definitions and Assumptions
- 2. Executive Summary
- 2.1. Introduction
- 3. Market Dynamics
- 3.1. Introduction
- 3.2. Market Drivers
- 3.2.1 Rapid urbanization and industrial growth in regions such as Asia-Pacific
- 3.2.2 the Middle East
- 3.2.3 and Africa are increasing electricity demand. High voltage cables are crucial for supporting the development of urban infrastructure and industrial facilities.
- 3.3. Market Restrains
- 3.3.1 The installation of high voltage cables
- 3.3.2 especially underground and submarine types
- 3.3.3 involves significant costs due to specialized materials
- 3.3.4 equipment
- 3.3.5 and labor. This high initial investment can be a barrier for some projects
- 3.3.6 particularly in cost-sensitive regions.
- 3.4. Market Trends
- 3.4.1 Submarine high voltage cables are increasingly used for offshore wind farms
- 3.4.2 island electrification
- 3.4.3 and intercontinental power transmission projects. These cables enable efficient power transmission over long distances and under challenging environmental conditions.
- 4. Market Factor Analysis
- 4.1. Porters Five Forces
- 4.2. Supply/Value Chain
- 4.3. PESTEL analysis
- 4.4. Market Entropy
- 4.5. Patent/Trademark Analysis
- 5. Global High Voltage Cables Market Analysis, Insights and Forecast, 2019-2031
- 5.1. Market Analysis, Insights and Forecast - by Location of Deployment
- 5.1.1. Overhead Cables
- 5.1.2. Underground Cables
- 5.1.3. Submarine Cables
- 5.2. Market Analysis, Insights and Forecast - by Type of Transmission
- 5.2.1. HVDC
- 5.2.2. HVAC
- 5.3. Market Analysis, Insights and Forecast - by Voltage Level
- 5.3.1. 50KV - 110KV
- 5.3.2. 115KV - 330KV
- 5.3.3. Greater than 330KV
- 5.4. Market Analysis, Insights and Forecast - by Region
- 5.4.1. North America
- 5.4.2. Asia Pacific
- 5.4.3. Europe
- 5.4.4. South America
- 5.4.5. Middle East and Africa
- 5.1. Market Analysis, Insights and Forecast - by Location of Deployment
- 6. North America High Voltage Cables Market Analysis, Insights and Forecast, 2019-2031
- 6.1. Market Analysis, Insights and Forecast - by Location of Deployment
- 6.1.1. Overhead Cables
- 6.1.2. Underground Cables
- 6.1.3. Submarine Cables
- 6.2. Market Analysis, Insights and Forecast - by Type of Transmission
- 6.2.1. HVDC
- 6.2.2. HVAC
- 6.3. Market Analysis, Insights and Forecast - by Voltage Level
- 6.3.1. 50KV - 110KV
- 6.3.2. 115KV - 330KV
- 6.3.3. Greater than 330KV
- 6.1. Market Analysis, Insights and Forecast - by Location of Deployment
- 7. Asia Pacific High Voltage Cables Market Analysis, Insights and Forecast, 2019-2031
- 7.1. Market Analysis, Insights and Forecast - by Location of Deployment
- 7.1.1. Overhead Cables
- 7.1.2. Underground Cables
- 7.1.3. Submarine Cables
- 7.2. Market Analysis, Insights and Forecast - by Type of Transmission
- 7.2.1. HVDC
- 7.2.2. HVAC
- 7.3. Market Analysis, Insights and Forecast - by Voltage Level
- 7.3.1. 50KV - 110KV
- 7.3.2. 115KV - 330KV
- 7.3.3. Greater than 330KV
- 7.1. Market Analysis, Insights and Forecast - by Location of Deployment
- 8. Europe High Voltage Cables Market Analysis, Insights and Forecast, 2019-2031
- 8.1. Market Analysis, Insights and Forecast - by Location of Deployment
- 8.1.1. Overhead Cables
- 8.1.2. Underground Cables
- 8.1.3. Submarine Cables
- 8.2. Market Analysis, Insights and Forecast - by Type of Transmission
- 8.2.1. HVDC
- 8.2.2. HVAC
- 8.3. Market Analysis, Insights and Forecast - by Voltage Level
- 8.3.1. 50KV - 110KV
- 8.3.2. 115KV - 330KV
- 8.3.3. Greater than 330KV
- 8.1. Market Analysis, Insights and Forecast - by Location of Deployment
- 9. South America High Voltage Cables Market Analysis, Insights and Forecast, 2019-2031
- 9.1. Market Analysis, Insights and Forecast - by Location of Deployment
- 9.1.1. Overhead Cables
- 9.1.2. Underground Cables
- 9.1.3. Submarine Cables
- 9.2. Market Analysis, Insights and Forecast - by Type of Transmission
- 9.2.1. HVDC
- 9.2.2. HVAC
- 9.3. Market Analysis, Insights and Forecast - by Voltage Level
- 9.3.1. 50KV - 110KV
- 9.3.2. 115KV - 330KV
- 9.3.3. Greater than 330KV
- 9.1. Market Analysis, Insights and Forecast - by Location of Deployment
- 10. Middle East and Africa High Voltage Cables Market Analysis, Insights and Forecast, 2019-2031
- 10.1. Market Analysis, Insights and Forecast - by Location of Deployment
- 10.1.1. Overhead Cables
- 10.1.2. Underground Cables
- 10.1.3. Submarine Cables
- 10.2. Market Analysis, Insights and Forecast - by Type of Transmission
- 10.2.1. HVDC
- 10.2.2. HVAC
- 10.3. Market Analysis, Insights and Forecast - by Voltage Level
- 10.3.1. 50KV - 110KV
- 10.3.2. 115KV - 330KV
- 10.3.3. Greater than 330KV
- 10.1. Market Analysis, Insights and Forecast - by Location of Deployment
- 11. North America High Voltage Cables Market Analysis, Insights and Forecast, 2019-2031
- 11.1. Market Analysis, Insights and Forecast - By Country/Sub-region
- 11.1.1 United States
- 11.1.2 Canada
- 11.1.3 Rest of North America
- 12. Asia Pacific High Voltage Cables Market Analysis, Insights and Forecast, 2019-2031
- 12.1. Market Analysis, Insights and Forecast - By Country/Sub-region
- 12.1.1 China
- 12.1.2 India
- 12.1.3 Japan
- 12.1.4 Australia
- 12.1.5 Malaysia
- 12.1.6 Rest of Asia Pacific
- 13. Europe High Voltage Cables Market Analysis, Insights and Forecast, 2019-2031
- 13.1. Market Analysis, Insights and Forecast - By Country/Sub-region
- 13.1.1 Germany
- 13.1.2 United Kingdom
- 13.1.3 Italy
- 13.1.4 France
- 13.1.5 Rest of Europe
- 14. South America High Voltage Cables Market Analysis, Insights and Forecast, 2019-2031
- 14.1. Market Analysis, Insights and Forecast - By Country/Sub-region
- 14.1.1 Brazil
- 14.1.2 Argentina
- 14.1.3 Rest of South America
- 15. Middle East and Africa High Voltage Cables Market Analysis, Insights and Forecast, 2019-2031
- 15.1. Market Analysis, Insights and Forecast - By Country/Sub-region
- 15.1.1 Saudi Arabia
- 15.1.2 United Arab Emirates
- 15.1.3 Qatar
- 15.1.4 South Africa
- 15.1.5 Egypt
- 15.1.6 Rest of Middle East and Africa
- 16. Competitive Analysis
- 16.1. Global Market Share Analysis 2024
- 16.2. Company Profiles
- 16.2.1 Finolex Cables Ltd
- 16.2.1.1. Overview
- 16.2.1.2. Products
- 16.2.1.3. SWOT Analysis
- 16.2.1.4. Recent Developments
- 16.2.1.5. Financials (Based on Availability)
- 16.2.2 ABB Ltd
- 16.2.2.1. Overview
- 16.2.2.2. Products
- 16.2.2.3. SWOT Analysis
- 16.2.2.4. Recent Developments
- 16.2.2.5. Financials (Based on Availability)
- 16.2.3 Cable Corporation of India Limited
- 16.2.3.1. Overview
- 16.2.3.2. Products
- 16.2.3.3. SWOT Analysis
- 16.2.3.4. Recent Developments
- 16.2.3.5. Financials (Based on Availability)
- 16.2.4 NKT AS
- 16.2.4.1. Overview
- 16.2.4.2. Products
- 16.2.4.3. SWOT Analysis
- 16.2.4.4. Recent Developments
- 16.2.4.5. Financials (Based on Availability)
- 16.2.5 Tratos
- 16.2.5.1. Overview
- 16.2.5.2. Products
- 16.2.5.3. SWOT Analysis
- 16.2.5.4. Recent Developments
- 16.2.5.5. Financials (Based on Availability)
- 16.2.6 Prysmian SpA
- 16.2.6.1. Overview
- 16.2.6.2. Products
- 16.2.6.3. SWOT Analysis
- 16.2.6.4. Recent Developments
- 16.2.6.5. Financials (Based on Availability)
- 16.2.7 Siemens AG
- 16.2.7.1. Overview
- 16.2.7.2. Products
- 16.2.7.3. SWOT Analysis
- 16.2.7.4. Recent Developments
- 16.2.7.5. Financials (Based on Availability)
- 16.2.8 Nexans SA
- 16.2.8.1. Overview
- 16.2.8.2. Products
- 16.2.8.3. SWOT Analysis
- 16.2.8.4. Recent Developments
- 16.2.8.5. Financials (Based on Availability)
- 16.2.9 Southwire Company LLC
- 16.2.9.1. Overview
- 16.2.9.2. Products
- 16.2.9.3. SWOT Analysis
- 16.2.9.4. Recent Developments
- 16.2.9.5. Financials (Based on Availability)
- 16.2.1 Finolex Cables Ltd
List of Figures
- Figure 1: Global High Voltage Cables Market Revenue Breakdown (Million, %) by Region 2024 & 2032
- Figure 2: North America High Voltage Cables Market Revenue (Million), by Country 2024 & 2032
- Figure 3: North America High Voltage Cables Market Revenue Share (%), by Country 2024 & 2032
- Figure 4: Asia Pacific High Voltage Cables Market Revenue (Million), by Country 2024 & 2032
- Figure 5: Asia Pacific High Voltage Cables Market Revenue Share (%), by Country 2024 & 2032
- Figure 6: Europe High Voltage Cables Market Revenue (Million), by Country 2024 & 2032
- Figure 7: Europe High Voltage Cables Market Revenue Share (%), by Country 2024 & 2032
- Figure 8: South America High Voltage Cables Market Revenue (Million), by Country 2024 & 2032
- Figure 9: South America High Voltage Cables Market Revenue Share (%), by Country 2024 & 2032
- Figure 10: Middle East and Africa High Voltage Cables Market Revenue (Million), by Country 2024 & 2032
- Figure 11: Middle East and Africa High Voltage Cables Market Revenue Share (%), by Country 2024 & 2032
- Figure 12: North America High Voltage Cables Market Revenue (Million), by Location of Deployment 2024 & 2032
- Figure 13: North America High Voltage Cables Market Revenue Share (%), by Location of Deployment 2024 & 2032
- Figure 14: North America High Voltage Cables Market Revenue (Million), by Type of Transmission 2024 & 2032
- Figure 15: North America High Voltage Cables Market Revenue Share (%), by Type of Transmission 2024 & 2032
- Figure 16: North America High Voltage Cables Market Revenue (Million), by Voltage Level 2024 & 2032
- Figure 17: North America High Voltage Cables Market Revenue Share (%), by Voltage Level 2024 & 2032
- Figure 18: North America High Voltage Cables Market Revenue (Million), by Country 2024 & 2032
- Figure 19: North America High Voltage Cables Market Revenue Share (%), by Country 2024 & 2032
- Figure 20: Asia Pacific High Voltage Cables Market Revenue (Million), by Location of Deployment 2024 & 2032
- Figure 21: Asia Pacific High Voltage Cables Market Revenue Share (%), by Location of Deployment 2024 & 2032
- Figure 22: Asia Pacific High Voltage Cables Market Revenue (Million), by Type of Transmission 2024 & 2032
- Figure 23: Asia Pacific High Voltage Cables Market Revenue Share (%), by Type of Transmission 2024 & 2032
- Figure 24: Asia Pacific High Voltage Cables Market Revenue (Million), by Voltage Level 2024 & 2032
- Figure 25: Asia Pacific High Voltage Cables Market Revenue Share (%), by Voltage Level 2024 & 2032
- Figure 26: Asia Pacific High Voltage Cables Market Revenue (Million), by Country 2024 & 2032
- Figure 27: Asia Pacific High Voltage Cables Market Revenue Share (%), by Country 2024 & 2032
- Figure 28: Europe High Voltage Cables Market Revenue (Million), by Location of Deployment 2024 & 2032
- Figure 29: Europe High Voltage Cables Market Revenue Share (%), by Location of Deployment 2024 & 2032
- Figure 30: Europe High Voltage Cables Market Revenue (Million), by Type of Transmission 2024 & 2032
- Figure 31: Europe High Voltage Cables Market Revenue Share (%), by Type of Transmission 2024 & 2032
- Figure 32: Europe High Voltage Cables Market Revenue (Million), by Voltage Level 2024 & 2032
- Figure 33: Europe High Voltage Cables Market Revenue Share (%), by Voltage Level 2024 & 2032
- Figure 34: Europe High Voltage Cables Market Revenue (Million), by Country 2024 & 2032
- Figure 35: Europe High Voltage Cables Market Revenue Share (%), by Country 2024 & 2032
- Figure 36: South America High Voltage Cables Market Revenue (Million), by Location of Deployment 2024 & 2032
- Figure 37: South America High Voltage Cables Market Revenue Share (%), by Location of Deployment 2024 & 2032
- Figure 38: South America High Voltage Cables Market Revenue (Million), by Type of Transmission 2024 & 2032
- Figure 39: South America High Voltage Cables Market Revenue Share (%), by Type of Transmission 2024 & 2032
- Figure 40: South America High Voltage Cables Market Revenue (Million), by Voltage Level 2024 & 2032
- Figure 41: South America High Voltage Cables Market Revenue Share (%), by Voltage Level 2024 & 2032
- Figure 42: South America High Voltage Cables Market Revenue (Million), by Country 2024 & 2032
- Figure 43: South America High Voltage Cables Market Revenue Share (%), by Country 2024 & 2032
- Figure 44: Middle East and Africa High Voltage Cables Market Revenue (Million), by Location of Deployment 2024 & 2032
- Figure 45: Middle East and Africa High Voltage Cables Market Revenue Share (%), by Location of Deployment 2024 & 2032
- Figure 46: Middle East and Africa High Voltage Cables Market Revenue (Million), by Type of Transmission 2024 & 2032
- Figure 47: Middle East and Africa High Voltage Cables Market Revenue Share (%), by Type of Transmission 2024 & 2032
- Figure 48: Middle East and Africa High Voltage Cables Market Revenue (Million), by Voltage Level 2024 & 2032
- Figure 49: Middle East and Africa High Voltage Cables Market Revenue Share (%), by Voltage Level 2024 & 2032
- Figure 50: Middle East and Africa High Voltage Cables Market Revenue (Million), by Country 2024 & 2032
- Figure 51: Middle East and Africa High Voltage Cables Market Revenue Share (%), by Country 2024 & 2032
List of Tables
- Table 1: Global High Voltage Cables Market Revenue Million Forecast, by Region 2019 & 2032
- Table 2: Global High Voltage Cables Market Revenue Million Forecast, by Location of Deployment 2019 & 2032
- Table 3: Global High Voltage Cables Market Revenue Million Forecast, by Type of Transmission 2019 & 2032
- Table 4: Global High Voltage Cables Market Revenue Million Forecast, by Voltage Level 2019 & 2032
- Table 5: Global High Voltage Cables Market Revenue Million Forecast, by Region 2019 & 2032
- Table 6: Global High Voltage Cables Market Revenue Million Forecast, by Country 2019 & 2032
- Table 7: United States High Voltage Cables Market Revenue (Million) Forecast, by Application 2019 & 2032
- Table 8: Canada High Voltage Cables Market Revenue (Million) Forecast, by Application 2019 & 2032
- Table 9: Rest of North America High Voltage Cables Market Revenue (Million) Forecast, by Application 2019 & 2032
- Table 10: Global High Voltage Cables Market Revenue Million Forecast, by Country 2019 & 2032
- Table 11: China High Voltage Cables Market Revenue (Million) Forecast, by Application 2019 & 2032
- Table 12: India High Voltage Cables Market Revenue (Million) Forecast, by Application 2019 & 2032
- Table 13: Japan High Voltage Cables Market Revenue (Million) Forecast, by Application 2019 & 2032
- Table 14: Australia High Voltage Cables Market Revenue (Million) Forecast, by Application 2019 & 2032
- Table 15: Malaysia High Voltage Cables Market Revenue (Million) Forecast, by Application 2019 & 2032
- Table 16: Rest of Asia Pacific High Voltage Cables Market Revenue (Million) Forecast, by Application 2019 & 2032
- Table 17: Global High Voltage Cables Market Revenue Million Forecast, by Country 2019 & 2032
- Table 18: Germany High Voltage Cables Market Revenue (Million) Forecast, by Application 2019 & 2032
- Table 19: United Kingdom High Voltage Cables Market Revenue (Million) Forecast, by Application 2019 & 2032
- Table 20: Italy High Voltage Cables Market Revenue (Million) Forecast, by Application 2019 & 2032
- Table 21: France High Voltage Cables Market Revenue (Million) Forecast, by Application 2019 & 2032
- Table 22: Rest of Europe High Voltage Cables Market Revenue (Million) Forecast, by Application 2019 & 2032
- Table 23: Global High Voltage Cables Market Revenue Million Forecast, by Country 2019 & 2032
- Table 24: Brazil High Voltage Cables Market Revenue (Million) Forecast, by Application 2019 & 2032
- Table 25: Argentina High Voltage Cables Market Revenue (Million) Forecast, by Application 2019 & 2032
- Table 26: Rest of South America High Voltage Cables Market Revenue (Million) Forecast, by Application 2019 & 2032
- Table 27: Global High Voltage Cables Market Revenue Million Forecast, by Country 2019 & 2032
- Table 28: Saudi Arabia High Voltage Cables Market Revenue (Million) Forecast, by Application 2019 & 2032
- Table 29: United Arab Emirates High Voltage Cables Market Revenue (Million) Forecast, by Application 2019 & 2032
- Table 30: Qatar High Voltage Cables Market Revenue (Million) Forecast, by Application 2019 & 2032
- Table 31: South Africa High Voltage Cables Market Revenue (Million) Forecast, by Application 2019 & 2032
- Table 32: Egypt High Voltage Cables Market Revenue (Million) Forecast, by Application 2019 & 2032
- Table 33: Rest of Middle East and Africa High Voltage Cables Market Revenue (Million) Forecast, by Application 2019 & 2032
- Table 34: Global High Voltage Cables Market Revenue Million Forecast, by Location of Deployment 2019 & 2032
- Table 35: Global High Voltage Cables Market Revenue Million Forecast, by Type of Transmission 2019 & 2032
- Table 36: Global High Voltage Cables Market Revenue Million Forecast, by Voltage Level 2019 & 2032
- Table 37: Global High Voltage Cables Market Revenue Million Forecast, by Country 2019 & 2032
- Table 38: United States High Voltage Cables Market Revenue (Million) Forecast, by Application 2019 & 2032
- Table 39: Canada High Voltage Cables Market Revenue (Million) Forecast, by Application 2019 & 2032
- Table 40: Rest of North America High Voltage Cables Market Revenue (Million) Forecast, by Application 2019 & 2032
- Table 41: Global High Voltage Cables Market Revenue Million Forecast, by Location of Deployment 2019 & 2032
- Table 42: Global High Voltage Cables Market Revenue Million Forecast, by Type of Transmission 2019 & 2032
- Table 43: Global High Voltage Cables Market Revenue Million Forecast, by Voltage Level 2019 & 2032
- Table 44: Global High Voltage Cables Market Revenue Million Forecast, by Country 2019 & 2032
- Table 45: China High Voltage Cables Market Revenue (Million) Forecast, by Application 2019 & 2032
- Table 46: India High Voltage Cables Market Revenue (Million) Forecast, by Application 2019 & 2032
- Table 47: Japan High Voltage Cables Market Revenue (Million) Forecast, by Application 2019 & 2032
- Table 48: Australia High Voltage Cables Market Revenue (Million) Forecast, by Application 2019 & 2032
- Table 49: Malaysia High Voltage Cables Market Revenue (Million) Forecast, by Application 2019 & 2032
- Table 50: Rest of Asia Pacific High Voltage Cables Market Revenue (Million) Forecast, by Application 2019 & 2032
- Table 51: Global High Voltage Cables Market Revenue Million Forecast, by Location of Deployment 2019 & 2032
- Table 52: Global High Voltage Cables Market Revenue Million Forecast, by Type of Transmission 2019 & 2032
- Table 53: Global High Voltage Cables Market Revenue Million Forecast, by Voltage Level 2019 & 2032
- Table 54: Global High Voltage Cables Market Revenue Million Forecast, by Country 2019 & 2032
- Table 55: Germany High Voltage Cables Market Revenue (Million) Forecast, by Application 2019 & 2032
- Table 56: United Kingdom High Voltage Cables Market Revenue (Million) Forecast, by Application 2019 & 2032
- Table 57: Italy High Voltage Cables Market Revenue (Million) Forecast, by Application 2019 & 2032
- Table 58: France High Voltage Cables Market Revenue (Million) Forecast, by Application 2019 & 2032
- Table 59: Rest of Europe High Voltage Cables Market Revenue (Million) Forecast, by Application 2019 & 2032
- Table 60: Global High Voltage Cables Market Revenue Million Forecast, by Location of Deployment 2019 & 2032
- Table 61: Global High Voltage Cables Market Revenue Million Forecast, by Type of Transmission 2019 & 2032
- Table 62: Global High Voltage Cables Market Revenue Million Forecast, by Voltage Level 2019 & 2032
- Table 63: Global High Voltage Cables Market Revenue Million Forecast, by Country 2019 & 2032
- Table 64: Brazil High Voltage Cables Market Revenue (Million) Forecast, by Application 2019 & 2032
- Table 65: Argentina High Voltage Cables Market Revenue (Million) Forecast, by Application 2019 & 2032
- Table 66: Rest of South America High Voltage Cables Market Revenue (Million) Forecast, by Application 2019 & 2032
- Table 67: Global High Voltage Cables Market Revenue Million Forecast, by Location of Deployment 2019 & 2032
- Table 68: Global High Voltage Cables Market Revenue Million Forecast, by Type of Transmission 2019 & 2032
- Table 69: Global High Voltage Cables Market Revenue Million Forecast, by Voltage Level 2019 & 2032
- Table 70: Global High Voltage Cables Market Revenue Million Forecast, by Country 2019 & 2032
- Table 71: Saudi Arabia High Voltage Cables Market Revenue (Million) Forecast, by Application 2019 & 2032
- Table 72: United Arab Emirates High Voltage Cables Market Revenue (Million) Forecast, by Application 2019 & 2032
- Table 73: Qatar High Voltage Cables Market Revenue (Million) Forecast, by Application 2019 & 2032
- Table 74: South Africa High Voltage Cables Market Revenue (Million) Forecast, by Application 2019 & 2032
- Table 75: Egypt High Voltage Cables Market Revenue (Million) Forecast, by Application 2019 & 2032
- Table 76: Rest of Middle East and Africa High Voltage Cables Market Revenue (Million) Forecast, by Application 2019 & 2032
Frequently Asked Questions
1. What is the projected Compound Annual Growth Rate (CAGR) of the High Voltage Cables Market?
The projected CAGR is approximately 5.80%.
2. Which companies are prominent players in the High Voltage Cables Market?
Key companies in the market include Finolex Cables Ltd, ABB Ltd, Cable Corporation of India Limited, NKT AS, Tratos, Prysmian SpA, Siemens AG, Nexans SA, Southwire Company LLC.
3. What are the main segments of the High Voltage Cables Market?
The market segments include Location of Deployment, Type of Transmission, Voltage Level.
4. Can you provide details about the market size?
The market size is estimated to be USD 41.60 Million as of 2022.
5. What are some drivers contributing to market growth?
Rapid urbanization and industrial growth in regions such as Asia-Pacific. the Middle East. and Africa are increasing electricity demand. High voltage cables are crucial for supporting the development of urban infrastructure and industrial facilities..
6. What are the notable trends driving market growth?
Submarine high voltage cables are increasingly used for offshore wind farms. island electrification. and intercontinental power transmission projects. These cables enable efficient power transmission over long distances and under challenging environmental conditions..
7. Are there any restraints impacting market growth?
The installation of high voltage cables. especially underground and submarine types. involves significant costs due to specialized materials. equipment. and labor. This high initial investment can be a barrier for some projects. particularly in cost-sensitive regions..
8. Can you provide examples of recent developments in the market?
January 2023: ALLETE and Grid United signed a memorandum of understanding to explore transmission opportunities. The two parties plan to execute a North Plains high voltage cables Connector development agreement during the year's first half. The project represents approximately USD 2.5 billion investment in Montana and North Dakota and will be a long-term asset for those states.
9. What pricing options are available for accessing the report?
Pricing options include single-user, multi-user, and enterprise licenses priced at USD 4750, USD 5250, and USD 8750 respectively.
10. Is the market size provided in terms of value or volume?
The market size is provided in terms of value, measured in Million.
11. Are there any specific market keywords associated with the report?
Yes, the market keyword associated with the report is "High Voltage Cables Market," which aids in identifying and referencing the specific market segment covered.
12. How do I determine which pricing option suits my needs best?
The pricing options vary based on user requirements and access needs. Individual users may opt for single-user licenses, while businesses requiring broader access may choose multi-user or enterprise licenses for cost-effective access to the report.
13. Are there any additional resources or data provided in the High Voltage Cables Market report?
While the report offers comprehensive insights, it's advisable to review the specific contents or supplementary materials provided to ascertain if additional resources or data are available.
14. How can I stay updated on further developments or reports in the High Voltage Cables Market?
To stay informed about further developments, trends, and reports in the High Voltage Cables Market, consider subscribing to industry newsletters, following relevant companies and organizations, or regularly checking reputable industry news sources and publications.
Methodology
Step 1 - Identification of Relevant Samples Size from Population Database


Step 2 - Approaches for Defining Global Market Size (Value, Volume* & Price*)

Note*: In applicable scenarios
Step 3 - Data Sources
Primary Research
- Web Analytics
- Survey Reports
- Research Institute
- Latest Research Reports
- Opinion Leaders
Secondary Research
- Annual Reports
- White Paper
- Latest Press Release
- Industry Association
- Paid Database
- Investor Presentations

Step 4 - Data Triangulation
Involves using different sources of information in order to increase the validity of a study
These sources are likely to be stakeholders in a program - participants, other researchers, program staff, other community members, and so on.
Then we put all data in single framework & apply various statistical tools to find out the dynamic on the market.
During the analysis stage, feedback from the stakeholder groups would be compared to determine areas of agreement as well as areas of divergence


