
Key Insights
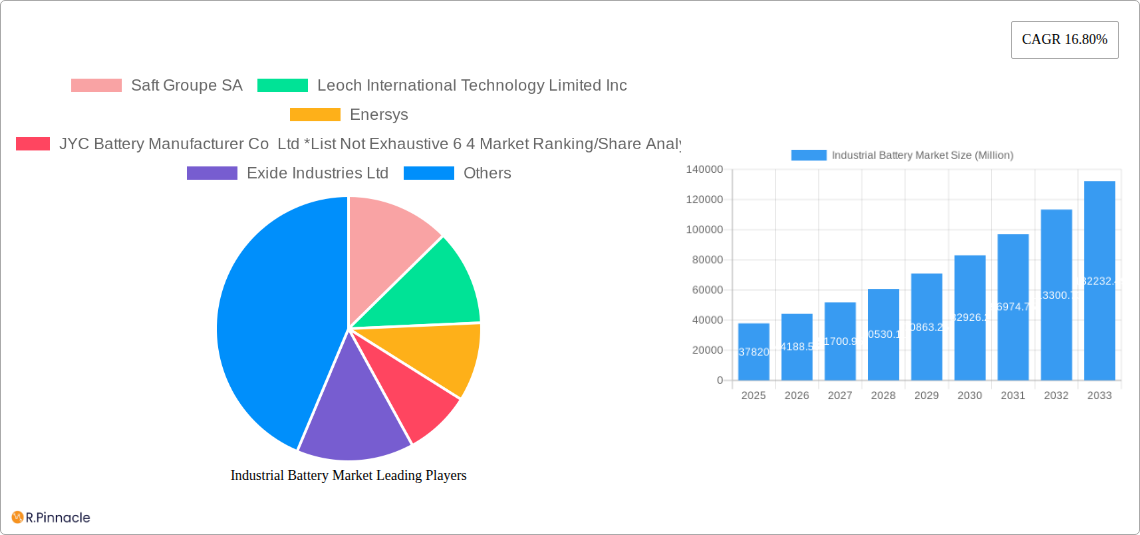
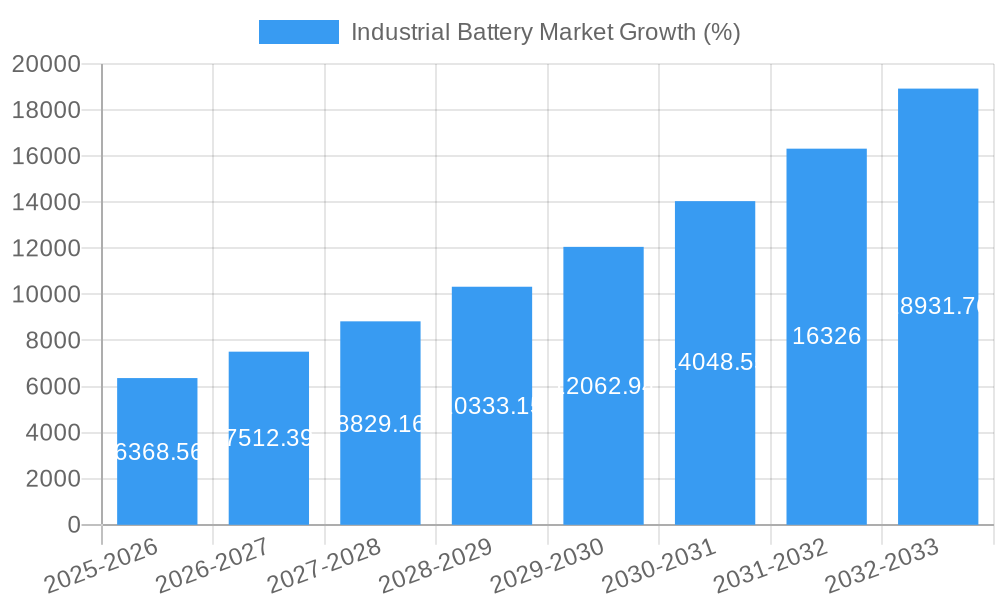
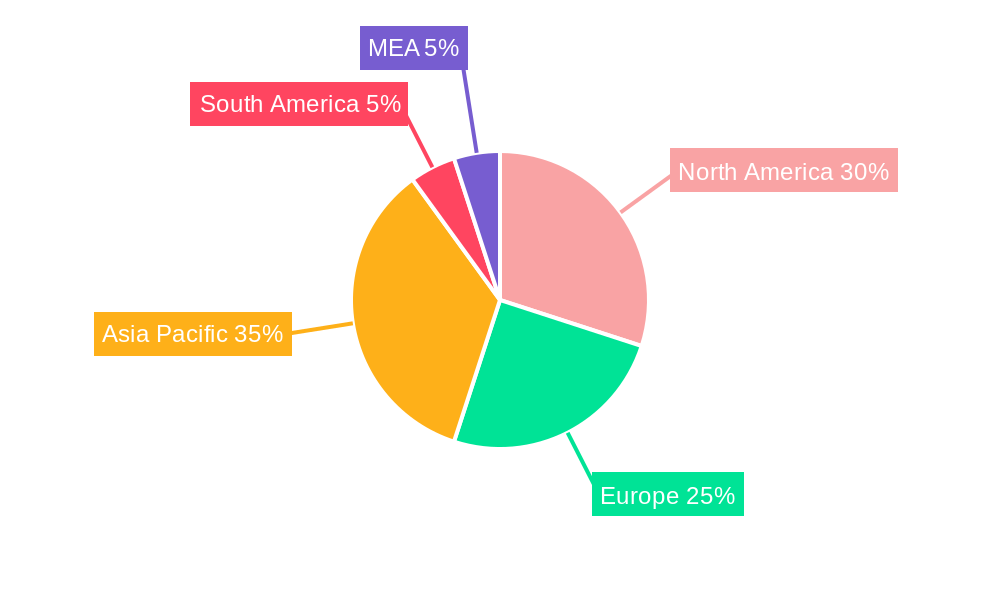
The industrial battery market, valued at $37.82 billion in 2025, is experiencing robust growth, projected to expand at a Compound Annual Growth Rate (CAGR) of 16.80% from 2025 to 2033. This surge is primarily driven by the increasing electrification of various industrial sectors, particularly the power sector (including energy storage systems and uninterruptible power supplies), oil & gas, and manufacturing. The rising adoption of renewable energy sources and the need for reliable backup power are key factors fueling demand. Technological advancements, notably in lithium-ion battery technology, are enhancing performance metrics like energy density and lifespan, making them increasingly attractive for industrial applications. Forklifts, telecom infrastructure, and UPS systems constitute major application areas. While the lead-acid battery remains a significant segment due to its cost-effectiveness, lithium-ion batteries are steadily gaining market share owing to their superior performance characteristics. Geographic growth is expected to be diverse, with North America and Asia-Pacific leading the charge, driven by robust industrial activity and supportive government policies promoting clean energy initiatives. However, potential restraints include the high initial cost of lithium-ion batteries and concerns around raw material sourcing and sustainability.
The market segmentation reveals significant opportunities across various end-user industries and technologies. The power sector, including the rapidly expanding energy storage systems (ESS) market, represents a substantial growth driver. Within the technology segment, lithium-ion batteries are poised for significant expansion, though the mature lead-acid battery segment will continue to hold considerable market share due to established infrastructure and cost advantages. The competitive landscape is characterized by a mix of established players like Saft, Leoch, Enersys, Exide Industries, and GS Yuasa, along with emerging players constantly innovating to improve battery performance and reduce costs. The geographical distribution of market share will likely reflect existing industrial infrastructure and economic growth trends, with mature markets in North America and Europe complemented by rapid expansion in developing economies of Asia-Pacific and South America. The forecast period (2025-2033) is anticipated to witness substantial market expansion driven by continued technological advancements and the global push towards sustainable energy solutions.
Industrial Battery Market Report: 2019-2033 Forecast
This comprehensive report provides a detailed analysis of the global industrial battery market, offering valuable insights for industry professionals, investors, and strategic decision-makers. Covering the period from 2019 to 2033, with a focus on 2025, this report delves into market dynamics, competitive landscapes, and future growth projections. The study period encompasses the historical period (2019-2024), the base year (2025), and the forecast period (2025-2033). Expect actionable intelligence on market sizing (in Millions), CAGR, and key players like Saft Groupe SA, Leoch International Technology Limited Inc, Enersys, and JYC Battery Manufacturer Co Ltd (among others).
Industrial Battery Market Market Structure & Innovation Trends
The industrial battery market exhibits a moderately concentrated structure, with several major players commanding significant market share. The market share of the top six players is estimated at xx%. Innovation is a key driver, with ongoing R&D focused on improving energy density, lifespan, safety, and cost-effectiveness of lithium-ion and lead-acid batteries. Stringent environmental regulations are pushing the adoption of sustainable battery technologies and recycling initiatives. The market witnesses frequent mergers and acquisitions (M&A), with deal values exceeding xx Million in recent years, demonstrating a trend toward consolidation and expansion. Substitute technologies, such as fuel cells, pose a potential threat, but their current market penetration is limited. The end-user demographic is diverse, spanning various industries, with manufacturing and the power sector showing particularly strong demand.
- Market Concentration: Top 6 players hold xx% market share.
- Innovation Drivers: Increased energy density, longer lifespan, improved safety, cost reduction.
- Regulatory Framework: Stringent environmental regulations promoting sustainable technologies.
- Product Substitutes: Fuel cells pose a long-term threat, but with low current penetration.
- M&A Activity: Deal values exceeding xx Million USD in recent years.
Industrial Battery Market Market Dynamics & Trends
The industrial battery market is experiencing robust growth, driven by increasing industrial automation, the rise of renewable energy sources (requiring energy storage solutions), and the growing adoption of electric vehicles and material handling equipment. Technological advancements, such as improved battery chemistries and energy management systems, are further fueling market expansion. Consumer preferences are shifting towards higher performance, longer-lasting, and more environmentally friendly batteries. The competitive landscape is characterized by intense rivalry among established players and emerging entrants, leading to continuous innovation and price competition. The market is projected to register a CAGR of xx% during the forecast period. Market penetration of lithium-ion batteries is expected to reach xx% by 2033.
Dominant Regions & Segments in Industrial Battery Market
The Asia-Pacific region currently dominates the industrial battery market, driven by robust economic growth, increasing industrialization, and significant investments in renewable energy infrastructure. Within this region, China and India stand out as major contributors.
- Leading End-User Industry: The Power Sector (including ESS and UPS systems) shows the highest growth, driven by the increasing demand for grid-scale energy storage and backup power solutions.
- Leading Technology: Lithium-ion batteries are experiencing rapid growth due to their superior performance characteristics, although lead-acid batteries still hold a significant market share in certain applications.
- Leading Application: Forklifts remain a major application, followed by the expanding telecom sector requiring reliable backup power.
- Key Drivers:
- Favorable government policies promoting renewable energy adoption and electric mobility.
- Robust infrastructure development in emerging economies.
- Growing investments in grid modernization and smart grids.
Industrial Battery Market Product Innovations
Recent product innovations focus on enhancing energy density, improving thermal management, and developing safer and more sustainable battery chemistries. Solid-state batteries and next-generation lithium-ion technologies are gaining traction, offering advantages in terms of energy density, safety, and lifespan. These innovations address market needs for higher performance, longer cycle life, and reduced environmental impact, ultimately enhancing competitiveness.
Report Scope & Segmentation Analysis
This report segments the industrial battery market by end-user industry (Power Sector, Oil & Gas Sector, Manufacturing Sector, Telecom, Other End-User Industries), technology (Lithium-ion Battery, Lead-acid Battery, Other Technologies), and application (Forklift, Telecom, UPS, Other Applications). Each segment's growth projections, market size, and competitive dynamics are analyzed in detail. The market is expected to reach xx Million by 2033.
Key Drivers of Industrial Battery Market Growth
Key drivers include the increasing demand for energy storage solutions in renewable energy systems, the growing adoption of electric vehicles and material handling equipment, and stringent environmental regulations promoting the use of cleaner energy technologies. Technological advancements, such as improved battery chemistries and better energy management systems, also contribute significantly to market growth.
Challenges in the Industrial Battery Market Sector
Challenges include the high initial cost of lithium-ion batteries, the complex supply chain for raw materials, and concerns about battery safety and disposal. Furthermore, regulatory hurdles related to battery recycling and environmental regulations pose significant obstacles. The impact of these challenges is estimated to slow market growth by approximately xx% by 2030.
Emerging Opportunities in Industrial Battery Market
Emerging opportunities include the growth of new energy storage applications such as microgrids and smart grids, the development of advanced battery management systems (BMS), and the increasing demand for second-life battery applications. The expanding electric vehicle market and the focus on sustainable energy solutions also create significant opportunities for growth.
Leading Players in the Industrial Battery Market Market
- Saft Groupe SA
- Leoch International Technology Limited Inc
- Enersys
- JYC Battery Manufacturer Co Ltd
- Exide Industries Ltd
- East Penn Manufacturing Company Inc
- GS Yuasa Corporation
- C&D Technologies Pvt Ltd
- Amar Raja batteries Ltd
- Panasonic Corporation
Key Developments in Industrial Battery Market Industry
- January 2023: ONGC Tripura Power Company and APDCL signed a USD 245 Million agreement for a 250MW/500MWh BESS project in Assam.
- October 2022: EnerSys expanded its presence in the Middle Tennessee Territory, enhancing its motive power product distribution and awareness.
Future Outlook for Industrial Battery Market Market
The industrial battery market is poised for continued growth, driven by technological advancements, increasing demand from key end-user industries, and supportive government policies. Strategic investments in R&D, expansion into new markets, and collaborations will play a crucial role in shaping the future of the market. The market is projected to experience sustained growth over the next decade, driven by continued innovation and adoption across diverse sectors.
Industrial Battery Market Segmentation
-
1. Technology
- 1.1. Lithium-ion Battery
- 1.2. Lead-acid Battery
- 1.3. Other Te
-
2. Application
- 2.1. Forklift
- 2.2. Telecom
- 2.3. UPS
- 2.4. Other Applications
-
3. End-User Industry
- 3.1. Power Sector (incl. ESS, UPS, etc.)
- 3.2. Oil & Gas Sector
- 3.3. Manufacturing Sector
- 3.4. Telecom
- 3.5. Other End-User Industries
Industrial Battery Market Segmentation By Geography
-
1. North America
- 1.1. United States
- 1.2. Canada
- 1.3. Rest of North America
-
2. Europe
- 2.1. Germany
- 2.2. France
- 2.3. United Kingdom
- 2.4. Italy
- 2.5. Spain
- 2.6. Nordic Countries
- 2.7. Turkey
- 2.8. Russia
- 2.9. Rest of Europe
-
3. Asia Pacific
- 3.1. China
- 3.2. Japan
- 3.3. India
- 3.4. Australia
- 3.5. Malaysis
- 3.6. Indonesia
- 3.7. Thailand
- 3.8. Vietnam
- 3.9. Rest of Asia Pacific
-
4. South America
- 4.1. Brazil
- 4.2. Argentina
- 4.3. Chile
- 4.4. Colombia
- 4.5. Rest of South America
-
5. Middle East and Africa
- 5.1. United Arab Emirates
- 5.2. Saudi Arabia
- 5.3. Qatar
- 5.4. South Africa
- 5.5. Nigeria
- 5.6. Egypt
- 5.7. Rest of Middle East and Africa
Industrial Battery Market REPORT HIGHLIGHTS
| Aspects | Details |
|---|---|
| Study Period | 2019-2033 |
| Base Year | 2024 |
| Estimated Year | 2025 |
| Forecast Period | 2025-2033 |
| Historical Period | 2019-2024 |
| Growth Rate | CAGR of 16.80% from 2019-2033 |
| Segmentation |
|
Table of Contents
- 1. Introduction
- 1.1. Research Scope
- 1.2. Market Segmentation
- 1.3. Research Methodology
- 1.4. Definitions and Assumptions
- 2. Executive Summary
- 2.1. Introduction
- 3. Market Dynamics
- 3.1. Introduction
- 3.2. Market Drivers
- 3.2.1. 4.; Declining Lithium-ion Battery Prices4.; Rising Renewable Energy Integration Worldwide
- 3.3. Market Restrains
- 3.3.1. 4.; Uncertainty in Raw Material Prices
- 3.4. Market Trends
- 3.4.1. Forklift Application Expected to Dominate the Market
- 4. Market Factor Analysis
- 4.1. Porters Five Forces
- 4.2. Supply/Value Chain
- 4.3. PESTEL analysis
- 4.4. Market Entropy
- 4.5. Patent/Trademark Analysis
- 5. Global Industrial Battery Market Analysis, Insights and Forecast, 2019-2031
- 5.1. Market Analysis, Insights and Forecast - by Technology
- 5.1.1. Lithium-ion Battery
- 5.1.2. Lead-acid Battery
- 5.1.3. Other Te
- 5.2. Market Analysis, Insights and Forecast - by Application
- 5.2.1. Forklift
- 5.2.2. Telecom
- 5.2.3. UPS
- 5.2.4. Other Applications
- 5.3. Market Analysis, Insights and Forecast - by End-User Industry
- 5.3.1. Power Sector (incl. ESS, UPS, etc.)
- 5.3.2. Oil & Gas Sector
- 5.3.3. Manufacturing Sector
- 5.3.4. Telecom
- 5.3.5. Other End-User Industries
- 5.4. Market Analysis, Insights and Forecast - by Region
- 5.4.1. North America
- 5.4.2. Europe
- 5.4.3. Asia Pacific
- 5.4.4. South America
- 5.4.5. Middle East and Africa
- 5.1. Market Analysis, Insights and Forecast - by Technology
- 6. North America Industrial Battery Market Analysis, Insights and Forecast, 2019-2031
- 6.1. Market Analysis, Insights and Forecast - by Technology
- 6.1.1. Lithium-ion Battery
- 6.1.2. Lead-acid Battery
- 6.1.3. Other Te
- 6.2. Market Analysis, Insights and Forecast - by Application
- 6.2.1. Forklift
- 6.2.2. Telecom
- 6.2.3. UPS
- 6.2.4. Other Applications
- 6.3. Market Analysis, Insights and Forecast - by End-User Industry
- 6.3.1. Power Sector (incl. ESS, UPS, etc.)
- 6.3.2. Oil & Gas Sector
- 6.3.3. Manufacturing Sector
- 6.3.4. Telecom
- 6.3.5. Other End-User Industries
- 6.1. Market Analysis, Insights and Forecast - by Technology
- 7. Europe Industrial Battery Market Analysis, Insights and Forecast, 2019-2031
- 7.1. Market Analysis, Insights and Forecast - by Technology
- 7.1.1. Lithium-ion Battery
- 7.1.2. Lead-acid Battery
- 7.1.3. Other Te
- 7.2. Market Analysis, Insights and Forecast - by Application
- 7.2.1. Forklift
- 7.2.2. Telecom
- 7.2.3. UPS
- 7.2.4. Other Applications
- 7.3. Market Analysis, Insights and Forecast - by End-User Industry
- 7.3.1. Power Sector (incl. ESS, UPS, etc.)
- 7.3.2. Oil & Gas Sector
- 7.3.3. Manufacturing Sector
- 7.3.4. Telecom
- 7.3.5. Other End-User Industries
- 7.1. Market Analysis, Insights and Forecast - by Technology
- 8. Asia Pacific Industrial Battery Market Analysis, Insights and Forecast, 2019-2031
- 8.1. Market Analysis, Insights and Forecast - by Technology
- 8.1.1. Lithium-ion Battery
- 8.1.2. Lead-acid Battery
- 8.1.3. Other Te
- 8.2. Market Analysis, Insights and Forecast - by Application
- 8.2.1. Forklift
- 8.2.2. Telecom
- 8.2.3. UPS
- 8.2.4. Other Applications
- 8.3. Market Analysis, Insights and Forecast - by End-User Industry
- 8.3.1. Power Sector (incl. ESS, UPS, etc.)
- 8.3.2. Oil & Gas Sector
- 8.3.3. Manufacturing Sector
- 8.3.4. Telecom
- 8.3.5. Other End-User Industries
- 8.1. Market Analysis, Insights and Forecast - by Technology
- 9. South America Industrial Battery Market Analysis, Insights and Forecast, 2019-2031
- 9.1. Market Analysis, Insights and Forecast - by Technology
- 9.1.1. Lithium-ion Battery
- 9.1.2. Lead-acid Battery
- 9.1.3. Other Te
- 9.2. Market Analysis, Insights and Forecast - by Application
- 9.2.1. Forklift
- 9.2.2. Telecom
- 9.2.3. UPS
- 9.2.4. Other Applications
- 9.3. Market Analysis, Insights and Forecast - by End-User Industry
- 9.3.1. Power Sector (incl. ESS, UPS, etc.)
- 9.3.2. Oil & Gas Sector
- 9.3.3. Manufacturing Sector
- 9.3.4. Telecom
- 9.3.5. Other End-User Industries
- 9.1. Market Analysis, Insights and Forecast - by Technology
- 10. Middle East and Africa Industrial Battery Market Analysis, Insights and Forecast, 2019-2031
- 10.1. Market Analysis, Insights and Forecast - by Technology
- 10.1.1. Lithium-ion Battery
- 10.1.2. Lead-acid Battery
- 10.1.3. Other Te
- 10.2. Market Analysis, Insights and Forecast - by Application
- 10.2.1. Forklift
- 10.2.2. Telecom
- 10.2.3. UPS
- 10.2.4. Other Applications
- 10.3. Market Analysis, Insights and Forecast - by End-User Industry
- 10.3.1. Power Sector (incl. ESS, UPS, etc.)
- 10.3.2. Oil & Gas Sector
- 10.3.3. Manufacturing Sector
- 10.3.4. Telecom
- 10.3.5. Other End-User Industries
- 10.1. Market Analysis, Insights and Forecast - by Technology
- 11. North America Industrial Battery Market Analysis, Insights and Forecast, 2019-2031
- 11.1. Market Analysis, Insights and Forecast - By Country/Sub-region
- 11.1.1 United States
- 11.1.2 Canada
- 11.1.3 Mexico
- 12. Europe Industrial Battery Market Analysis, Insights and Forecast, 2019-2031
- 12.1. Market Analysis, Insights and Forecast - By Country/Sub-region
- 12.1.1 Germany
- 12.1.2 United Kingdom
- 12.1.3 France
- 12.1.4 Spain
- 12.1.5 Italy
- 12.1.6 Spain
- 12.1.7 Belgium
- 12.1.8 Netherland
- 12.1.9 Nordics
- 12.1.10 Rest of Europe
- 13. Asia Pacific Industrial Battery Market Analysis, Insights and Forecast, 2019-2031
- 13.1. Market Analysis, Insights and Forecast - By Country/Sub-region
- 13.1.1 China
- 13.1.2 Japan
- 13.1.3 India
- 13.1.4 South Korea
- 13.1.5 Southeast Asia
- 13.1.6 Australia
- 13.1.7 Indonesia
- 13.1.8 Phillipes
- 13.1.9 Singapore
- 13.1.10 Thailandc
- 13.1.11 Rest of Asia Pacific
- 14. South America Industrial Battery Market Analysis, Insights and Forecast, 2019-2031
- 14.1. Market Analysis, Insights and Forecast - By Country/Sub-region
- 14.1.1 Brazil
- 14.1.2 Argentina
- 14.1.3 Peru
- 14.1.4 Chile
- 14.1.5 Colombia
- 14.1.6 Ecuador
- 14.1.7 Venezuela
- 14.1.8 Rest of South America
- 15. North America Industrial Battery Market Analysis, Insights and Forecast, 2019-2031
- 15.1. Market Analysis, Insights and Forecast - By Country/Sub-region
- 15.1.1 United States
- 15.1.2 Canada
- 15.1.3 Mexico
- 16. MEA Industrial Battery Market Analysis, Insights and Forecast, 2019-2031
- 16.1. Market Analysis, Insights and Forecast - By Country/Sub-region
- 16.1.1 United Arab Emirates
- 16.1.2 Saudi Arabia
- 16.1.3 South Africa
- 16.1.4 Rest of Middle East and Africa
- 17. Competitive Analysis
- 17.1. Global Market Share Analysis 2024
- 17.2. Company Profiles
- 17.2.1 Saft Groupe SA
- 17.2.1.1. Overview
- 17.2.1.2. Products
- 17.2.1.3. SWOT Analysis
- 17.2.1.4. Recent Developments
- 17.2.1.5. Financials (Based on Availability)
- 17.2.2 Leoch International Technology Limited Inc
- 17.2.2.1. Overview
- 17.2.2.2. Products
- 17.2.2.3. SWOT Analysis
- 17.2.2.4. Recent Developments
- 17.2.2.5. Financials (Based on Availability)
- 17.2.3 Enersys
- 17.2.3.1. Overview
- 17.2.3.2. Products
- 17.2.3.3. SWOT Analysis
- 17.2.3.4. Recent Developments
- 17.2.3.5. Financials (Based on Availability)
- 17.2.4 JYC Battery Manufacturer Co Ltd *List Not Exhaustive 6 4 Market Ranking/Share Analysi
- 17.2.4.1. Overview
- 17.2.4.2. Products
- 17.2.4.3. SWOT Analysis
- 17.2.4.4. Recent Developments
- 17.2.4.5. Financials (Based on Availability)
- 17.2.5 Exide Industries Ltd
- 17.2.5.1. Overview
- 17.2.5.2. Products
- 17.2.5.3. SWOT Analysis
- 17.2.5.4. Recent Developments
- 17.2.5.5. Financials (Based on Availability)
- 17.2.6 East Penn Manufacturing Company Inc
- 17.2.6.1. Overview
- 17.2.6.2. Products
- 17.2.6.3. SWOT Analysis
- 17.2.6.4. Recent Developments
- 17.2.6.5. Financials (Based on Availability)
- 17.2.7 GS Yuasa Corporation
- 17.2.7.1. Overview
- 17.2.7.2. Products
- 17.2.7.3. SWOT Analysis
- 17.2.7.4. Recent Developments
- 17.2.7.5. Financials (Based on Availability)
- 17.2.8 C&D Technologies Pvt Ltd
- 17.2.8.1. Overview
- 17.2.8.2. Products
- 17.2.8.3. SWOT Analysis
- 17.2.8.4. Recent Developments
- 17.2.8.5. Financials (Based on Availability)
- 17.2.9 Amar Raja batteries Ltd
- 17.2.9.1. Overview
- 17.2.9.2. Products
- 17.2.9.3. SWOT Analysis
- 17.2.9.4. Recent Developments
- 17.2.9.5. Financials (Based on Availability)
- 17.2.10 Panasonic Corporation
- 17.2.10.1. Overview
- 17.2.10.2. Products
- 17.2.10.3. SWOT Analysis
- 17.2.10.4. Recent Developments
- 17.2.10.5. Financials (Based on Availability)
- 17.2.1 Saft Groupe SA
List of Figures
- Figure 1: Global Industrial Battery Market Revenue Breakdown (Million, %) by Region 2024 & 2032
- Figure 2: Global Industrial Battery Market Volume Breakdown (K Unit, %) by Region 2024 & 2032
- Figure 3: North America Industrial Battery Market Revenue (Million), by Country 2024 & 2032
- Figure 4: North America Industrial Battery Market Volume (K Unit), by Country 2024 & 2032
- Figure 5: North America Industrial Battery Market Revenue Share (%), by Country 2024 & 2032
- Figure 6: North America Industrial Battery Market Volume Share (%), by Country 2024 & 2032
- Figure 7: Europe Industrial Battery Market Revenue (Million), by Country 2024 & 2032
- Figure 8: Europe Industrial Battery Market Volume (K Unit), by Country 2024 & 2032
- Figure 9: Europe Industrial Battery Market Revenue Share (%), by Country 2024 & 2032
- Figure 10: Europe Industrial Battery Market Volume Share (%), by Country 2024 & 2032
- Figure 11: Asia Pacific Industrial Battery Market Revenue (Million), by Country 2024 & 2032
- Figure 12: Asia Pacific Industrial Battery Market Volume (K Unit), by Country 2024 & 2032
- Figure 13: Asia Pacific Industrial Battery Market Revenue Share (%), by Country 2024 & 2032
- Figure 14: Asia Pacific Industrial Battery Market Volume Share (%), by Country 2024 & 2032
- Figure 15: South America Industrial Battery Market Revenue (Million), by Country 2024 & 2032
- Figure 16: South America Industrial Battery Market Volume (K Unit), by Country 2024 & 2032
- Figure 17: South America Industrial Battery Market Revenue Share (%), by Country 2024 & 2032
- Figure 18: South America Industrial Battery Market Volume Share (%), by Country 2024 & 2032
- Figure 19: North America Industrial Battery Market Revenue (Million), by Country 2024 & 2032
- Figure 20: North America Industrial Battery Market Volume (K Unit), by Country 2024 & 2032
- Figure 21: North America Industrial Battery Market Revenue Share (%), by Country 2024 & 2032
- Figure 22: North America Industrial Battery Market Volume Share (%), by Country 2024 & 2032
- Figure 23: MEA Industrial Battery Market Revenue (Million), by Country 2024 & 2032
- Figure 24: MEA Industrial Battery Market Volume (K Unit), by Country 2024 & 2032
- Figure 25: MEA Industrial Battery Market Revenue Share (%), by Country 2024 & 2032
- Figure 26: MEA Industrial Battery Market Volume Share (%), by Country 2024 & 2032
- Figure 27: North America Industrial Battery Market Revenue (Million), by Technology 2024 & 2032
- Figure 28: North America Industrial Battery Market Volume (K Unit), by Technology 2024 & 2032
- Figure 29: North America Industrial Battery Market Revenue Share (%), by Technology 2024 & 2032
- Figure 30: North America Industrial Battery Market Volume Share (%), by Technology 2024 & 2032
- Figure 31: North America Industrial Battery Market Revenue (Million), by Application 2024 & 2032
- Figure 32: North America Industrial Battery Market Volume (K Unit), by Application 2024 & 2032
- Figure 33: North America Industrial Battery Market Revenue Share (%), by Application 2024 & 2032
- Figure 34: North America Industrial Battery Market Volume Share (%), by Application 2024 & 2032
- Figure 35: North America Industrial Battery Market Revenue (Million), by End-User Industry 2024 & 2032
- Figure 36: North America Industrial Battery Market Volume (K Unit), by End-User Industry 2024 & 2032
- Figure 37: North America Industrial Battery Market Revenue Share (%), by End-User Industry 2024 & 2032
- Figure 38: North America Industrial Battery Market Volume Share (%), by End-User Industry 2024 & 2032
- Figure 39: North America Industrial Battery Market Revenue (Million), by Country 2024 & 2032
- Figure 40: North America Industrial Battery Market Volume (K Unit), by Country 2024 & 2032
- Figure 41: North America Industrial Battery Market Revenue Share (%), by Country 2024 & 2032
- Figure 42: North America Industrial Battery Market Volume Share (%), by Country 2024 & 2032
- Figure 43: Europe Industrial Battery Market Revenue (Million), by Technology 2024 & 2032
- Figure 44: Europe Industrial Battery Market Volume (K Unit), by Technology 2024 & 2032
- Figure 45: Europe Industrial Battery Market Revenue Share (%), by Technology 2024 & 2032
- Figure 46: Europe Industrial Battery Market Volume Share (%), by Technology 2024 & 2032
- Figure 47: Europe Industrial Battery Market Revenue (Million), by Application 2024 & 2032
- Figure 48: Europe Industrial Battery Market Volume (K Unit), by Application 2024 & 2032
- Figure 49: Europe Industrial Battery Market Revenue Share (%), by Application 2024 & 2032
- Figure 50: Europe Industrial Battery Market Volume Share (%), by Application 2024 & 2032
- Figure 51: Europe Industrial Battery Market Revenue (Million), by End-User Industry 2024 & 2032
- Figure 52: Europe Industrial Battery Market Volume (K Unit), by End-User Industry 2024 & 2032
- Figure 53: Europe Industrial Battery Market Revenue Share (%), by End-User Industry 2024 & 2032
- Figure 54: Europe Industrial Battery Market Volume Share (%), by End-User Industry 2024 & 2032
- Figure 55: Europe Industrial Battery Market Revenue (Million), by Country 2024 & 2032
- Figure 56: Europe Industrial Battery Market Volume (K Unit), by Country 2024 & 2032
- Figure 57: Europe Industrial Battery Market Revenue Share (%), by Country 2024 & 2032
- Figure 58: Europe Industrial Battery Market Volume Share (%), by Country 2024 & 2032
- Figure 59: Asia Pacific Industrial Battery Market Revenue (Million), by Technology 2024 & 2032
- Figure 60: Asia Pacific Industrial Battery Market Volume (K Unit), by Technology 2024 & 2032
- Figure 61: Asia Pacific Industrial Battery Market Revenue Share (%), by Technology 2024 & 2032
- Figure 62: Asia Pacific Industrial Battery Market Volume Share (%), by Technology 2024 & 2032
- Figure 63: Asia Pacific Industrial Battery Market Revenue (Million), by Application 2024 & 2032
- Figure 64: Asia Pacific Industrial Battery Market Volume (K Unit), by Application 2024 & 2032
- Figure 65: Asia Pacific Industrial Battery Market Revenue Share (%), by Application 2024 & 2032
- Figure 66: Asia Pacific Industrial Battery Market Volume Share (%), by Application 2024 & 2032
- Figure 67: Asia Pacific Industrial Battery Market Revenue (Million), by End-User Industry 2024 & 2032
- Figure 68: Asia Pacific Industrial Battery Market Volume (K Unit), by End-User Industry 2024 & 2032
- Figure 69: Asia Pacific Industrial Battery Market Revenue Share (%), by End-User Industry 2024 & 2032
- Figure 70: Asia Pacific Industrial Battery Market Volume Share (%), by End-User Industry 2024 & 2032
- Figure 71: Asia Pacific Industrial Battery Market Revenue (Million), by Country 2024 & 2032
- Figure 72: Asia Pacific Industrial Battery Market Volume (K Unit), by Country 2024 & 2032
- Figure 73: Asia Pacific Industrial Battery Market Revenue Share (%), by Country 2024 & 2032
- Figure 74: Asia Pacific Industrial Battery Market Volume Share (%), by Country 2024 & 2032
- Figure 75: South America Industrial Battery Market Revenue (Million), by Technology 2024 & 2032
- Figure 76: South America Industrial Battery Market Volume (K Unit), by Technology 2024 & 2032
- Figure 77: South America Industrial Battery Market Revenue Share (%), by Technology 2024 & 2032
- Figure 78: South America Industrial Battery Market Volume Share (%), by Technology 2024 & 2032
- Figure 79: South America Industrial Battery Market Revenue (Million), by Application 2024 & 2032
- Figure 80: South America Industrial Battery Market Volume (K Unit), by Application 2024 & 2032
- Figure 81: South America Industrial Battery Market Revenue Share (%), by Application 2024 & 2032
- Figure 82: South America Industrial Battery Market Volume Share (%), by Application 2024 & 2032
- Figure 83: South America Industrial Battery Market Revenue (Million), by End-User Industry 2024 & 2032
- Figure 84: South America Industrial Battery Market Volume (K Unit), by End-User Industry 2024 & 2032
- Figure 85: South America Industrial Battery Market Revenue Share (%), by End-User Industry 2024 & 2032
- Figure 86: South America Industrial Battery Market Volume Share (%), by End-User Industry 2024 & 2032
- Figure 87: South America Industrial Battery Market Revenue (Million), by Country 2024 & 2032
- Figure 88: South America Industrial Battery Market Volume (K Unit), by Country 2024 & 2032
- Figure 89: South America Industrial Battery Market Revenue Share (%), by Country 2024 & 2032
- Figure 90: South America Industrial Battery Market Volume Share (%), by Country 2024 & 2032
- Figure 91: Middle East and Africa Industrial Battery Market Revenue (Million), by Technology 2024 & 2032
- Figure 92: Middle East and Africa Industrial Battery Market Volume (K Unit), by Technology 2024 & 2032
- Figure 93: Middle East and Africa Industrial Battery Market Revenue Share (%), by Technology 2024 & 2032
- Figure 94: Middle East and Africa Industrial Battery Market Volume Share (%), by Technology 2024 & 2032
- Figure 95: Middle East and Africa Industrial Battery Market Revenue (Million), by Application 2024 & 2032
- Figure 96: Middle East and Africa Industrial Battery Market Volume (K Unit), by Application 2024 & 2032
- Figure 97: Middle East and Africa Industrial Battery Market Revenue Share (%), by Application 2024 & 2032
- Figure 98: Middle East and Africa Industrial Battery Market Volume Share (%), by Application 2024 & 2032
- Figure 99: Middle East and Africa Industrial Battery Market Revenue (Million), by End-User Industry 2024 & 2032
- Figure 100: Middle East and Africa Industrial Battery Market Volume (K Unit), by End-User Industry 2024 & 2032
- Figure 101: Middle East and Africa Industrial Battery Market Revenue Share (%), by End-User Industry 2024 & 2032
- Figure 102: Middle East and Africa Industrial Battery Market Volume Share (%), by End-User Industry 2024 & 2032
- Figure 103: Middle East and Africa Industrial Battery Market Revenue (Million), by Country 2024 & 2032
- Figure 104: Middle East and Africa Industrial Battery Market Volume (K Unit), by Country 2024 & 2032
- Figure 105: Middle East and Africa Industrial Battery Market Revenue Share (%), by Country 2024 & 2032
- Figure 106: Middle East and Africa Industrial Battery Market Volume Share (%), by Country 2024 & 2032
List of Tables
- Table 1: Global Industrial Battery Market Revenue Million Forecast, by Region 2019 & 2032
- Table 2: Global Industrial Battery Market Volume K Unit Forecast, by Region 2019 & 2032
- Table 3: Global Industrial Battery Market Revenue Million Forecast, by Technology 2019 & 2032
- Table 4: Global Industrial Battery Market Volume K Unit Forecast, by Technology 2019 & 2032
- Table 5: Global Industrial Battery Market Revenue Million Forecast, by Application 2019 & 2032
- Table 6: Global Industrial Battery Market Volume K Unit Forecast, by Application 2019 & 2032
- Table 7: Global Industrial Battery Market Revenue Million Forecast, by End-User Industry 2019 & 2032
- Table 8: Global Industrial Battery Market Volume K Unit Forecast, by End-User Industry 2019 & 2032
- Table 9: Global Industrial Battery Market Revenue Million Forecast, by Region 2019 & 2032
- Table 10: Global Industrial Battery Market Volume K Unit Forecast, by Region 2019 & 2032
- Table 11: Global Industrial Battery Market Revenue Million Forecast, by Country 2019 & 2032
- Table 12: Global Industrial Battery Market Volume K Unit Forecast, by Country 2019 & 2032
- Table 13: United States Industrial Battery Market Revenue (Million) Forecast, by Application 2019 & 2032
- Table 14: United States Industrial Battery Market Volume (K Unit) Forecast, by Application 2019 & 2032
- Table 15: Canada Industrial Battery Market Revenue (Million) Forecast, by Application 2019 & 2032
- Table 16: Canada Industrial Battery Market Volume (K Unit) Forecast, by Application 2019 & 2032
- Table 17: Mexico Industrial Battery Market Revenue (Million) Forecast, by Application 2019 & 2032
- Table 18: Mexico Industrial Battery Market Volume (K Unit) Forecast, by Application 2019 & 2032
- Table 19: Global Industrial Battery Market Revenue Million Forecast, by Country 2019 & 2032
- Table 20: Global Industrial Battery Market Volume K Unit Forecast, by Country 2019 & 2032
- Table 21: Germany Industrial Battery Market Revenue (Million) Forecast, by Application 2019 & 2032
- Table 22: Germany Industrial Battery Market Volume (K Unit) Forecast, by Application 2019 & 2032
- Table 23: United Kingdom Industrial Battery Market Revenue (Million) Forecast, by Application 2019 & 2032
- Table 24: United Kingdom Industrial Battery Market Volume (K Unit) Forecast, by Application 2019 & 2032
- Table 25: France Industrial Battery Market Revenue (Million) Forecast, by Application 2019 & 2032
- Table 26: France Industrial Battery Market Volume (K Unit) Forecast, by Application 2019 & 2032
- Table 27: Spain Industrial Battery Market Revenue (Million) Forecast, by Application 2019 & 2032
- Table 28: Spain Industrial Battery Market Volume (K Unit) Forecast, by Application 2019 & 2032
- Table 29: Italy Industrial Battery Market Revenue (Million) Forecast, by Application 2019 & 2032
- Table 30: Italy Industrial Battery Market Volume (K Unit) Forecast, by Application 2019 & 2032
- Table 31: Spain Industrial Battery Market Revenue (Million) Forecast, by Application 2019 & 2032
- Table 32: Spain Industrial Battery Market Volume (K Unit) Forecast, by Application 2019 & 2032
- Table 33: Belgium Industrial Battery Market Revenue (Million) Forecast, by Application 2019 & 2032
- Table 34: Belgium Industrial Battery Market Volume (K Unit) Forecast, by Application 2019 & 2032
- Table 35: Netherland Industrial Battery Market Revenue (Million) Forecast, by Application 2019 & 2032
- Table 36: Netherland Industrial Battery Market Volume (K Unit) Forecast, by Application 2019 & 2032
- Table 37: Nordics Industrial Battery Market Revenue (Million) Forecast, by Application 2019 & 2032
- Table 38: Nordics Industrial Battery Market Volume (K Unit) Forecast, by Application 2019 & 2032
- Table 39: Rest of Europe Industrial Battery Market Revenue (Million) Forecast, by Application 2019 & 2032
- Table 40: Rest of Europe Industrial Battery Market Volume (K Unit) Forecast, by Application 2019 & 2032
- Table 41: Global Industrial Battery Market Revenue Million Forecast, by Country 2019 & 2032
- Table 42: Global Industrial Battery Market Volume K Unit Forecast, by Country 2019 & 2032
- Table 43: China Industrial Battery Market Revenue (Million) Forecast, by Application 2019 & 2032
- Table 44: China Industrial Battery Market Volume (K Unit) Forecast, by Application 2019 & 2032
- Table 45: Japan Industrial Battery Market Revenue (Million) Forecast, by Application 2019 & 2032
- Table 46: Japan Industrial Battery Market Volume (K Unit) Forecast, by Application 2019 & 2032
- Table 47: India Industrial Battery Market Revenue (Million) Forecast, by Application 2019 & 2032
- Table 48: India Industrial Battery Market Volume (K Unit) Forecast, by Application 2019 & 2032
- Table 49: South Korea Industrial Battery Market Revenue (Million) Forecast, by Application 2019 & 2032
- Table 50: South Korea Industrial Battery Market Volume (K Unit) Forecast, by Application 2019 & 2032
- Table 51: Southeast Asia Industrial Battery Market Revenue (Million) Forecast, by Application 2019 & 2032
- Table 52: Southeast Asia Industrial Battery Market Volume (K Unit) Forecast, by Application 2019 & 2032
- Table 53: Australia Industrial Battery Market Revenue (Million) Forecast, by Application 2019 & 2032
- Table 54: Australia Industrial Battery Market Volume (K Unit) Forecast, by Application 2019 & 2032
- Table 55: Indonesia Industrial Battery Market Revenue (Million) Forecast, by Application 2019 & 2032
- Table 56: Indonesia Industrial Battery Market Volume (K Unit) Forecast, by Application 2019 & 2032
- Table 57: Phillipes Industrial Battery Market Revenue (Million) Forecast, by Application 2019 & 2032
- Table 58: Phillipes Industrial Battery Market Volume (K Unit) Forecast, by Application 2019 & 2032
- Table 59: Singapore Industrial Battery Market Revenue (Million) Forecast, by Application 2019 & 2032
- Table 60: Singapore Industrial Battery Market Volume (K Unit) Forecast, by Application 2019 & 2032
- Table 61: Thailandc Industrial Battery Market Revenue (Million) Forecast, by Application 2019 & 2032
- Table 62: Thailandc Industrial Battery Market Volume (K Unit) Forecast, by Application 2019 & 2032
- Table 63: Rest of Asia Pacific Industrial Battery Market Revenue (Million) Forecast, by Application 2019 & 2032
- Table 64: Rest of Asia Pacific Industrial Battery Market Volume (K Unit) Forecast, by Application 2019 & 2032
- Table 65: Global Industrial Battery Market Revenue Million Forecast, by Country 2019 & 2032
- Table 66: Global Industrial Battery Market Volume K Unit Forecast, by Country 2019 & 2032
- Table 67: Brazil Industrial Battery Market Revenue (Million) Forecast, by Application 2019 & 2032
- Table 68: Brazil Industrial Battery Market Volume (K Unit) Forecast, by Application 2019 & 2032
- Table 69: Argentina Industrial Battery Market Revenue (Million) Forecast, by Application 2019 & 2032
- Table 70: Argentina Industrial Battery Market Volume (K Unit) Forecast, by Application 2019 & 2032
- Table 71: Peru Industrial Battery Market Revenue (Million) Forecast, by Application 2019 & 2032
- Table 72: Peru Industrial Battery Market Volume (K Unit) Forecast, by Application 2019 & 2032
- Table 73: Chile Industrial Battery Market Revenue (Million) Forecast, by Application 2019 & 2032
- Table 74: Chile Industrial Battery Market Volume (K Unit) Forecast, by Application 2019 & 2032
- Table 75: Colombia Industrial Battery Market Revenue (Million) Forecast, by Application 2019 & 2032
- Table 76: Colombia Industrial Battery Market Volume (K Unit) Forecast, by Application 2019 & 2032
- Table 77: Ecuador Industrial Battery Market Revenue (Million) Forecast, by Application 2019 & 2032
- Table 78: Ecuador Industrial Battery Market Volume (K Unit) Forecast, by Application 2019 & 2032
- Table 79: Venezuela Industrial Battery Market Revenue (Million) Forecast, by Application 2019 & 2032
- Table 80: Venezuela Industrial Battery Market Volume (K Unit) Forecast, by Application 2019 & 2032
- Table 81: Rest of South America Industrial Battery Market Revenue (Million) Forecast, by Application 2019 & 2032
- Table 82: Rest of South America Industrial Battery Market Volume (K Unit) Forecast, by Application 2019 & 2032
- Table 83: Global Industrial Battery Market Revenue Million Forecast, by Country 2019 & 2032
- Table 84: Global Industrial Battery Market Volume K Unit Forecast, by Country 2019 & 2032
- Table 85: United States Industrial Battery Market Revenue (Million) Forecast, by Application 2019 & 2032
- Table 86: United States Industrial Battery Market Volume (K Unit) Forecast, by Application 2019 & 2032
- Table 87: Canada Industrial Battery Market Revenue (Million) Forecast, by Application 2019 & 2032
- Table 88: Canada Industrial Battery Market Volume (K Unit) Forecast, by Application 2019 & 2032
- Table 89: Mexico Industrial Battery Market Revenue (Million) Forecast, by Application 2019 & 2032
- Table 90: Mexico Industrial Battery Market Volume (K Unit) Forecast, by Application 2019 & 2032
- Table 91: Global Industrial Battery Market Revenue Million Forecast, by Country 2019 & 2032
- Table 92: Global Industrial Battery Market Volume K Unit Forecast, by Country 2019 & 2032
- Table 93: United Arab Emirates Industrial Battery Market Revenue (Million) Forecast, by Application 2019 & 2032
- Table 94: United Arab Emirates Industrial Battery Market Volume (K Unit) Forecast, by Application 2019 & 2032
- Table 95: Saudi Arabia Industrial Battery Market Revenue (Million) Forecast, by Application 2019 & 2032
- Table 96: Saudi Arabia Industrial Battery Market Volume (K Unit) Forecast, by Application 2019 & 2032
- Table 97: South Africa Industrial Battery Market Revenue (Million) Forecast, by Application 2019 & 2032
- Table 98: South Africa Industrial Battery Market Volume (K Unit) Forecast, by Application 2019 & 2032
- Table 99: Rest of Middle East and Africa Industrial Battery Market Revenue (Million) Forecast, by Application 2019 & 2032
- Table 100: Rest of Middle East and Africa Industrial Battery Market Volume (K Unit) Forecast, by Application 2019 & 2032
- Table 101: Global Industrial Battery Market Revenue Million Forecast, by Technology 2019 & 2032
- Table 102: Global Industrial Battery Market Volume K Unit Forecast, by Technology 2019 & 2032
- Table 103: Global Industrial Battery Market Revenue Million Forecast, by Application 2019 & 2032
- Table 104: Global Industrial Battery Market Volume K Unit Forecast, by Application 2019 & 2032
- Table 105: Global Industrial Battery Market Revenue Million Forecast, by End-User Industry 2019 & 2032
- Table 106: Global Industrial Battery Market Volume K Unit Forecast, by End-User Industry 2019 & 2032
- Table 107: Global Industrial Battery Market Revenue Million Forecast, by Country 2019 & 2032
- Table 108: Global Industrial Battery Market Volume K Unit Forecast, by Country 2019 & 2032
- Table 109: United States Industrial Battery Market Revenue (Million) Forecast, by Application 2019 & 2032
- Table 110: United States Industrial Battery Market Volume (K Unit) Forecast, by Application 2019 & 2032
- Table 111: Canada Industrial Battery Market Revenue (Million) Forecast, by Application 2019 & 2032
- Table 112: Canada Industrial Battery Market Volume (K Unit) Forecast, by Application 2019 & 2032
- Table 113: Rest of North America Industrial Battery Market Revenue (Million) Forecast, by Application 2019 & 2032
- Table 114: Rest of North America Industrial Battery Market Volume (K Unit) Forecast, by Application 2019 & 2032
- Table 115: Global Industrial Battery Market Revenue Million Forecast, by Technology 2019 & 2032
- Table 116: Global Industrial Battery Market Volume K Unit Forecast, by Technology 2019 & 2032
- Table 117: Global Industrial Battery Market Revenue Million Forecast, by Application 2019 & 2032
- Table 118: Global Industrial Battery Market Volume K Unit Forecast, by Application 2019 & 2032
- Table 119: Global Industrial Battery Market Revenue Million Forecast, by End-User Industry 2019 & 2032
- Table 120: Global Industrial Battery Market Volume K Unit Forecast, by End-User Industry 2019 & 2032
- Table 121: Global Industrial Battery Market Revenue Million Forecast, by Country 2019 & 2032
- Table 122: Global Industrial Battery Market Volume K Unit Forecast, by Country 2019 & 2032
- Table 123: Germany Industrial Battery Market Revenue (Million) Forecast, by Application 2019 & 2032
- Table 124: Germany Industrial Battery Market Volume (K Unit) Forecast, by Application 2019 & 2032
- Table 125: France Industrial Battery Market Revenue (Million) Forecast, by Application 2019 & 2032
- Table 126: France Industrial Battery Market Volume (K Unit) Forecast, by Application 2019 & 2032
- Table 127: United Kingdom Industrial Battery Market Revenue (Million) Forecast, by Application 2019 & 2032
- Table 128: United Kingdom Industrial Battery Market Volume (K Unit) Forecast, by Application 2019 & 2032
- Table 129: Italy Industrial Battery Market Revenue (Million) Forecast, by Application 2019 & 2032
- Table 130: Italy Industrial Battery Market Volume (K Unit) Forecast, by Application 2019 & 2032
- Table 131: Spain Industrial Battery Market Revenue (Million) Forecast, by Application 2019 & 2032
- Table 132: Spain Industrial Battery Market Volume (K Unit) Forecast, by Application 2019 & 2032
- Table 133: Nordic Countries Industrial Battery Market Revenue (Million) Forecast, by Application 2019 & 2032
- Table 134: Nordic Countries Industrial Battery Market Volume (K Unit) Forecast, by Application 2019 & 2032
- Table 135: Turkey Industrial Battery Market Revenue (Million) Forecast, by Application 2019 & 2032
- Table 136: Turkey Industrial Battery Market Volume (K Unit) Forecast, by Application 2019 & 2032
- Table 137: Russia Industrial Battery Market Revenue (Million) Forecast, by Application 2019 & 2032
- Table 138: Russia Industrial Battery Market Volume (K Unit) Forecast, by Application 2019 & 2032
- Table 139: Rest of Europe Industrial Battery Market Revenue (Million) Forecast, by Application 2019 & 2032
- Table 140: Rest of Europe Industrial Battery Market Volume (K Unit) Forecast, by Application 2019 & 2032
- Table 141: Global Industrial Battery Market Revenue Million Forecast, by Technology 2019 & 2032
- Table 142: Global Industrial Battery Market Volume K Unit Forecast, by Technology 2019 & 2032
- Table 143: Global Industrial Battery Market Revenue Million Forecast, by Application 2019 & 2032
- Table 144: Global Industrial Battery Market Volume K Unit Forecast, by Application 2019 & 2032
- Table 145: Global Industrial Battery Market Revenue Million Forecast, by End-User Industry 2019 & 2032
- Table 146: Global Industrial Battery Market Volume K Unit Forecast, by End-User Industry 2019 & 2032
- Table 147: Global Industrial Battery Market Revenue Million Forecast, by Country 2019 & 2032
- Table 148: Global Industrial Battery Market Volume K Unit Forecast, by Country 2019 & 2032
- Table 149: China Industrial Battery Market Revenue (Million) Forecast, by Application 2019 & 2032
- Table 150: China Industrial Battery Market Volume (K Unit) Forecast, by Application 2019 & 2032
- Table 151: Japan Industrial Battery Market Revenue (Million) Forecast, by Application 2019 & 2032
- Table 152: Japan Industrial Battery Market Volume (K Unit) Forecast, by Application 2019 & 2032
- Table 153: India Industrial Battery Market Revenue (Million) Forecast, by Application 2019 & 2032
- Table 154: India Industrial Battery Market Volume (K Unit) Forecast, by Application 2019 & 2032
- Table 155: Australia Industrial Battery Market Revenue (Million) Forecast, by Application 2019 & 2032
- Table 156: Australia Industrial Battery Market Volume (K Unit) Forecast, by Application 2019 & 2032
- Table 157: Malaysis Industrial Battery Market Revenue (Million) Forecast, by Application 2019 & 2032
- Table 158: Malaysis Industrial Battery Market Volume (K Unit) Forecast, by Application 2019 & 2032
- Table 159: Indonesia Industrial Battery Market Revenue (Million) Forecast, by Application 2019 & 2032
- Table 160: Indonesia Industrial Battery Market Volume (K Unit) Forecast, by Application 2019 & 2032
- Table 161: Thailand Industrial Battery Market Revenue (Million) Forecast, by Application 2019 & 2032
- Table 162: Thailand Industrial Battery Market Volume (K Unit) Forecast, by Application 2019 & 2032
- Table 163: Vietnam Industrial Battery Market Revenue (Million) Forecast, by Application 2019 & 2032
- Table 164: Vietnam Industrial Battery Market Volume (K Unit) Forecast, by Application 2019 & 2032
- Table 165: Rest of Asia Pacific Industrial Battery Market Revenue (Million) Forecast, by Application 2019 & 2032
- Table 166: Rest of Asia Pacific Industrial Battery Market Volume (K Unit) Forecast, by Application 2019 & 2032
- Table 167: Global Industrial Battery Market Revenue Million Forecast, by Technology 2019 & 2032
- Table 168: Global Industrial Battery Market Volume K Unit Forecast, by Technology 2019 & 2032
- Table 169: Global Industrial Battery Market Revenue Million Forecast, by Application 2019 & 2032
- Table 170: Global Industrial Battery Market Volume K Unit Forecast, by Application 2019 & 2032
- Table 171: Global Industrial Battery Market Revenue Million Forecast, by End-User Industry 2019 & 2032
- Table 172: Global Industrial Battery Market Volume K Unit Forecast, by End-User Industry 2019 & 2032
- Table 173: Global Industrial Battery Market Revenue Million Forecast, by Country 2019 & 2032
- Table 174: Global Industrial Battery Market Volume K Unit Forecast, by Country 2019 & 2032
- Table 175: Brazil Industrial Battery Market Revenue (Million) Forecast, by Application 2019 & 2032
- Table 176: Brazil Industrial Battery Market Volume (K Unit) Forecast, by Application 2019 & 2032
- Table 177: Argentina Industrial Battery Market Revenue (Million) Forecast, by Application 2019 & 2032
- Table 178: Argentina Industrial Battery Market Volume (K Unit) Forecast, by Application 2019 & 2032
- Table 179: Chile Industrial Battery Market Revenue (Million) Forecast, by Application 2019 & 2032
- Table 180: Chile Industrial Battery Market Volume (K Unit) Forecast, by Application 2019 & 2032
- Table 181: Colombia Industrial Battery Market Revenue (Million) Forecast, by Application 2019 & 2032
- Table 182: Colombia Industrial Battery Market Volume (K Unit) Forecast, by Application 2019 & 2032
- Table 183: Rest of South America Industrial Battery Market Revenue (Million) Forecast, by Application 2019 & 2032
- Table 184: Rest of South America Industrial Battery Market Volume (K Unit) Forecast, by Application 2019 & 2032
- Table 185: Global Industrial Battery Market Revenue Million Forecast, by Technology 2019 & 2032
- Table 186: Global Industrial Battery Market Volume K Unit Forecast, by Technology 2019 & 2032
- Table 187: Global Industrial Battery Market Revenue Million Forecast, by Application 2019 & 2032
- Table 188: Global Industrial Battery Market Volume K Unit Forecast, by Application 2019 & 2032
- Table 189: Global Industrial Battery Market Revenue Million Forecast, by End-User Industry 2019 & 2032
- Table 190: Global Industrial Battery Market Volume K Unit Forecast, by End-User Industry 2019 & 2032
- Table 191: Global Industrial Battery Market Revenue Million Forecast, by Country 2019 & 2032
- Table 192: Global Industrial Battery Market Volume K Unit Forecast, by Country 2019 & 2032
- Table 193: United Arab Emirates Industrial Battery Market Revenue (Million) Forecast, by Application 2019 & 2032
- Table 194: United Arab Emirates Industrial Battery Market Volume (K Unit) Forecast, by Application 2019 & 2032
- Table 195: Saudi Arabia Industrial Battery Market Revenue (Million) Forecast, by Application 2019 & 2032
- Table 196: Saudi Arabia Industrial Battery Market Volume (K Unit) Forecast, by Application 2019 & 2032
- Table 197: Qatar Industrial Battery Market Revenue (Million) Forecast, by Application 2019 & 2032
- Table 198: Qatar Industrial Battery Market Volume (K Unit) Forecast, by Application 2019 & 2032
- Table 199: South Africa Industrial Battery Market Revenue (Million) Forecast, by Application 2019 & 2032
- Table 200: South Africa Industrial Battery Market Volume (K Unit) Forecast, by Application 2019 & 2032
- Table 201: Nigeria Industrial Battery Market Revenue (Million) Forecast, by Application 2019 & 2032
- Table 202: Nigeria Industrial Battery Market Volume (K Unit) Forecast, by Application 2019 & 2032
- Table 203: Egypt Industrial Battery Market Revenue (Million) Forecast, by Application 2019 & 2032
- Table 204: Egypt Industrial Battery Market Volume (K Unit) Forecast, by Application 2019 & 2032
- Table 205: Rest of Middle East and Africa Industrial Battery Market Revenue (Million) Forecast, by Application 2019 & 2032
- Table 206: Rest of Middle East and Africa Industrial Battery Market Volume (K Unit) Forecast, by Application 2019 & 2032
Frequently Asked Questions
1. What is the projected Compound Annual Growth Rate (CAGR) of the Industrial Battery Market?
The projected CAGR is approximately 16.80%.
2. Which companies are prominent players in the Industrial Battery Market?
Key companies in the market include Saft Groupe SA, Leoch International Technology Limited Inc, Enersys, JYC Battery Manufacturer Co Ltd *List Not Exhaustive 6 4 Market Ranking/Share Analysi, Exide Industries Ltd, East Penn Manufacturing Company Inc, GS Yuasa Corporation, C&D Technologies Pvt Ltd, Amar Raja batteries Ltd, Panasonic Corporation.
3. What are the main segments of the Industrial Battery Market?
The market segments include Technology, Application, End-User Industry.
4. Can you provide details about the market size?
The market size is estimated to be USD 37.82 Million as of 2022.
5. What are some drivers contributing to market growth?
4.; Declining Lithium-ion Battery Prices4.; Rising Renewable Energy Integration Worldwide.
6. What are the notable trends driving market growth?
Forklift Application Expected to Dominate the Market.
7. Are there any restraints impacting market growth?
4.; Uncertainty in Raw Material Prices.
8. Can you provide examples of recent developments in the market?
January 2023: Oil & Natural Gas Corporation (ONGC) subsidiary, ONGC Tripura Power Company, signed an agreement with Assam Power Distribution Company Limited (APDCL) for a large-scale battery storage project in Assam. The project is worth USD 245 million, and both companies will form a joint venture (JV) to develop a battery energy storage system (BESS) project with up to 250MW rated power output and 500MWh capacity.
9. What pricing options are available for accessing the report?
Pricing options include single-user, multi-user, and enterprise licenses priced at USD 4750, USD 5250, and USD 8750 respectively.
10. Is the market size provided in terms of value or volume?
The market size is provided in terms of value, measured in Million and volume, measured in K Unit.
11. Are there any specific market keywords associated with the report?
Yes, the market keyword associated with the report is "Industrial Battery Market," which aids in identifying and referencing the specific market segment covered.
12. How do I determine which pricing option suits my needs best?
The pricing options vary based on user requirements and access needs. Individual users may opt for single-user licenses, while businesses requiring broader access may choose multi-user or enterprise licenses for cost-effective access to the report.
13. Are there any additional resources or data provided in the Industrial Battery Market report?
While the report offers comprehensive insights, it's advisable to review the specific contents or supplementary materials provided to ascertain if additional resources or data are available.
14. How can I stay updated on further developments or reports in the Industrial Battery Market?
To stay informed about further developments, trends, and reports in the Industrial Battery Market, consider subscribing to industry newsletters, following relevant companies and organizations, or regularly checking reputable industry news sources and publications.
Methodology
Step 1 - Identification of Relevant Samples Size from Population Database


Step 2 - Approaches for Defining Global Market Size (Value, Volume* & Price*)

Note*: In applicable scenarios
Step 3 - Data Sources
Primary Research
- Web Analytics
- Survey Reports
- Research Institute
- Latest Research Reports
- Opinion Leaders
Secondary Research
- Annual Reports
- White Paper
- Latest Press Release
- Industry Association
- Paid Database
- Investor Presentations

Step 4 - Data Triangulation
Involves using different sources of information in order to increase the validity of a study
These sources are likely to be stakeholders in a program - participants, other researchers, program staff, other community members, and so on.
Then we put all data in single framework & apply various statistical tools to find out the dynamic on the market.
During the analysis stage, feedback from the stakeholder groups would be compared to determine areas of agreement as well as areas of divergence


