

Key Insights
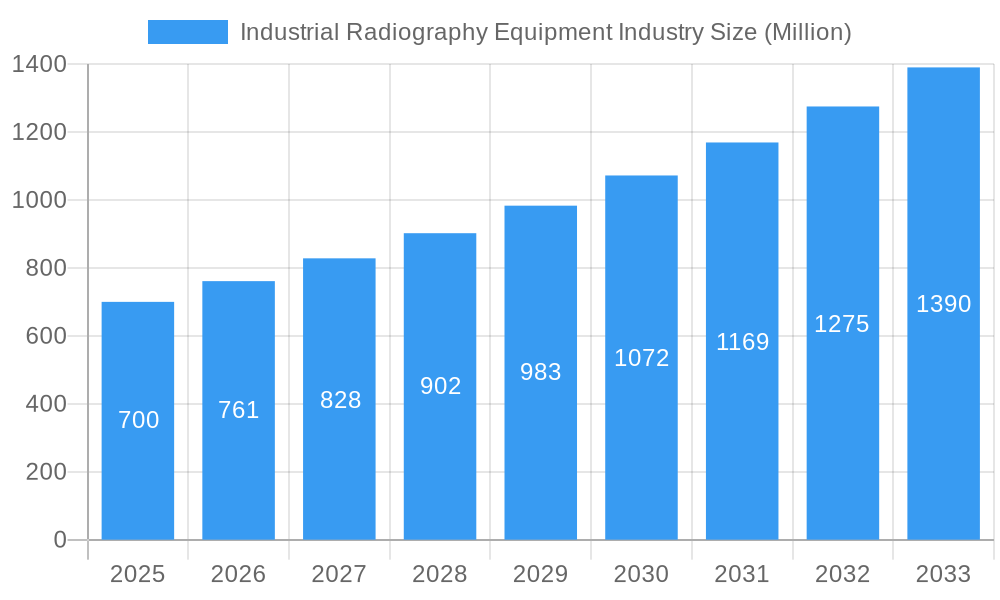
The industrial radiography equipment market is projected to reach $1.35 billion by 2025, exhibiting a Compound Annual Growth Rate (CAGR) of 8.6% from 2025 to 2033. This robust expansion is driven by the escalating demand for non-destructive testing (NDT) across vital sectors including aerospace, automotive, and energy. Stringent regulatory mandates for safety and quality assurance further accelerate market adoption. Innovations in portable and digital radiography systems are enhancing efficiency and image fidelity, while the growing trend towards manufacturing automation and digitalization contributes significantly. Emerging economies' focus on infrastructure development presents substantial opportunities for radiography equipment deployment in construction and pipeline integrity assurance.
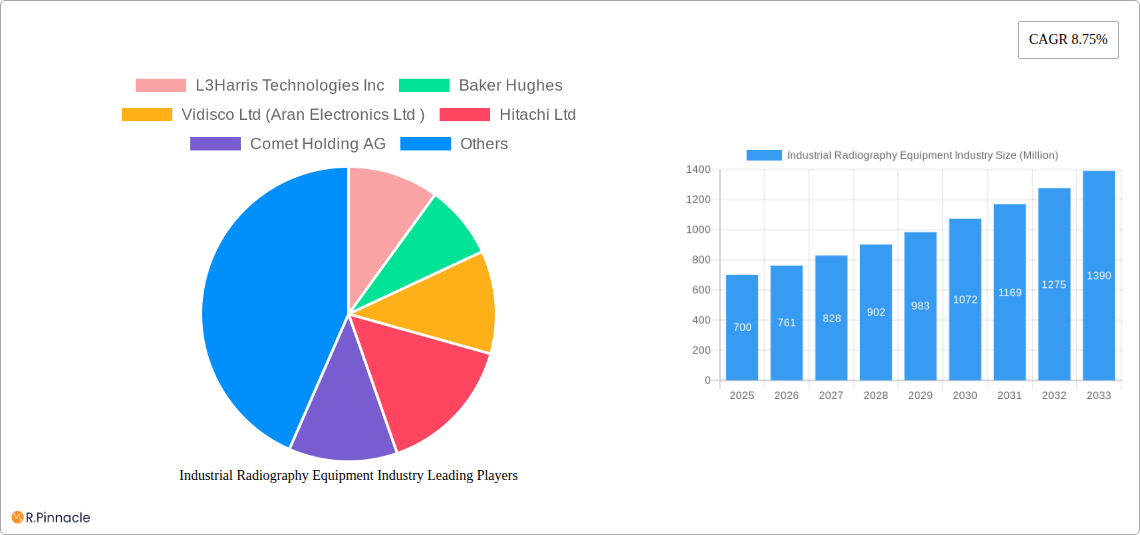
Industrial Radiography Equipment Industry Market Size (In Billion)
Key market restraints include the substantial upfront investment required for advanced technologies such as computed tomography (CT), which may limit adoption by smaller enterprises. Operational complexities and the need for skilled personnel for advanced equipment maintenance can also increase costs. Volatile raw material pricing and supply chain vulnerabilities pose additional challenges. Nevertheless, the industrial radiography equipment market's outlook remains optimistic, fueled by continuous technological advancements, regulatory compliance drivers, and sustained demand from core industries. The market's segmentation by technology (film radiography, computed radiography, direct radiography, computed tomography) and end-user industry (aerospace & defense, petrochemical & gas, energy & power, construction, automotive & transportation, manufacturing) highlights diverse applications and significant growth potential.
Industrial Radiography Equipment Industry Company Market Share
Industrial Radiography Equipment Industry Market Report: 2019-2033
This comprehensive report provides an in-depth analysis of the Industrial Radiography Equipment market, offering invaluable insights for industry professionals, investors, and strategic decision-makers. The report covers the period from 2019 to 2033, with a focus on the forecast period from 2025 to 2033 and a base year of 2025. The market is segmented by technology (Film Radiography, Computed Radiography, Direct Radiography, Computed Tomography) and end-user industry (Aerospace and Defense, Petrochemical and Gas, Energy and Power, Construction, Automotive and Transportation, Manufacturing, Other End-User Industries). The report projects a market value exceeding xx Million by 2033, driven by technological advancements and robust growth across key segments.
Industrial Radiography Equipment Industry Market Structure & Innovation Trends
The Industrial Radiography Equipment market is characterized by a moderately concentrated structure, with several major players holding significant market share. L3Harris Technologies Inc, Baker Hughes, and Fujifilm Corporation are among the leading companies, although precise market share data varies depending on the specific segment and region. The market exhibits dynamic innovation, driven by the need for enhanced image quality, faster processing speeds, and greater portability. Regulatory frameworks, particularly those concerning radiation safety, significantly influence market practices. Product substitutes, while limited, include alternative non-destructive testing (NDT) methods. End-user demographics are diverse, spanning various industries with varying technological needs.
- Market Concentration: Moderately concentrated, with top 5 players holding an estimated xx% market share in 2025.
- Innovation Drivers: Improved image quality, faster processing, portability, AI integration, and reduced radiation exposure.
- Regulatory Landscape: Stringent safety regulations regarding radiation exposure drive adoption of advanced safety features.
- M&A Activity: Significant M&A activity in recent years, with deal values totaling xx Million, indicating market consolidation and strategic expansion.
Industrial Radiography Equipment Industry Market Dynamics & Trends
The Industrial Radiography Equipment market is experiencing robust growth, driven primarily by increasing demand from key end-user industries such as aerospace & defense and energy. The rising adoption of advanced technologies like Computed Tomography (CT) is fueling market expansion. Technological disruptions, particularly advancements in digital radiography and AI-powered image analysis, are reshaping the competitive landscape. Consumer preferences are shifting towards higher resolution, faster processing, and improved user-friendliness. The market is witnessing intense competition among established players and emerging companies. The CAGR during the forecast period is projected to be xx%, with market penetration in key segments experiencing substantial growth.
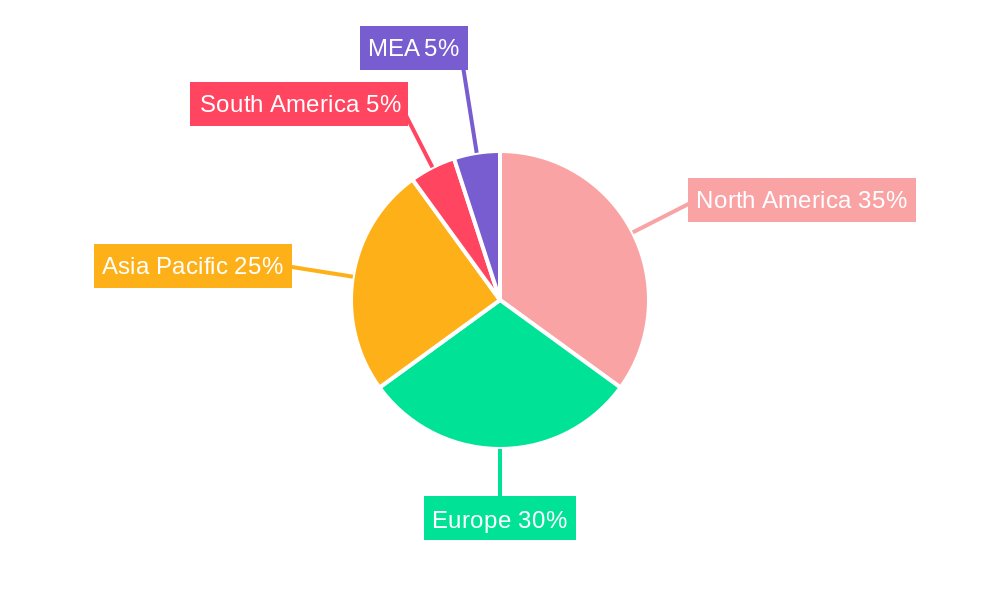
Dominant Regions & Segments in Industrial Radiography Equipment Industry
The North American and European markets currently dominate the Industrial Radiography Equipment industry, driven by strong demand from the aerospace, automotive, and energy sectors. However, the Asia-Pacific region is expected to witness significant growth in the coming years due to expanding industrialization and infrastructure development. Within technology segments, Computed Radiography and Direct Radiography are showing rapid adoption due to their improved efficiency and image quality compared to Film Radiography. Computed Tomography (CT) systems are experiencing significant growth, fueled by their ability to generate detailed 3D images.
Key Drivers:
- North America: Strong regulatory framework, technological advancements, and high spending in the aerospace & defense industry.
- Europe: Growing adoption of advanced technologies and a large established industrial base.
- Asia-Pacific: Rapid industrialization, infrastructure development, and increasing government investment in the energy sector.
Segment Dominance:
- By Technology: Computed Radiography and Direct Radiography are leading segments due to their improved speed and image quality. Computed Tomography is experiencing strong growth due to its ability to create detailed 3D images.
- By End-User Industry: Aerospace and Defense, along with Petrochemical and Gas, are the dominant end-user segments, reflecting their stringent quality control requirements.
Industrial Radiography Equipment Industry Product Innovations
Recent product launches highlight the industry's focus on improving image quality, speed, and ease of use. Canon's Zexirai9 digital X-ray RF system and Nikon Metrology's VOXLS CT systems represent significant advancements in digital radiography and computed tomography, respectively. These innovations offer enhanced functionalities, compact designs, and improved workflow efficiency, addressing key market needs. The integration of AI and machine learning is also enhancing image analysis capabilities and automating processes.
Report Scope & Segmentation Analysis
This report comprehensively segments the Industrial Radiography Equipment market by technology and end-user industry.
By Technology:
- Film Radiography: A mature technology with a declining market share, although it maintains a niche in specific applications. Market size is estimated at xx Million in 2025.
- Computed Radiography: Experiencing consistent growth due to improved efficiency and image quality. Market size is estimated at xx Million in 2025.
- Direct Radiography: A rapidly growing segment benefiting from high-resolution images and reduced processing times. Market size is estimated at xx Million in 2025.
- Computed Tomography: The fastest-growing segment, driven by its advanced 3D imaging capabilities. Market size is estimated at xx Million in 2025.
By End-User Industry: Each industry segment exhibits specific growth rates based on its technological needs and investment capacity.
Key Drivers of Industrial Radiography Equipment Industry Growth
The Industrial Radiography Equipment market is propelled by several factors. Stringent quality control requirements in industries like aerospace and energy drive the adoption of advanced technologies. Government regulations emphasizing safety and efficiency in industrial processes are also stimulating market growth. Technological advancements, especially in digital radiography and CT, are enabling improved image quality, higher speed, and greater automation. Finally, expanding infrastructure projects globally are further augmenting the demand for industrial radiography equipment.
Challenges in the Industrial Radiography Equipment Industry Sector
Despite the growth prospects, the Industrial Radiography Equipment market faces some challenges. High initial investment costs for advanced systems can be a barrier to entry for smaller companies. Stringent safety regulations and associated compliance costs pose operational challenges. Furthermore, intense competition among established players and the emergence of new technologies create a dynamic and sometimes unpredictable market environment. Supply chain disruptions also pose a significant threat to market stability.
Emerging Opportunities in Industrial Radiography Equipment Industry
The integration of AI and machine learning in image analysis offers significant opportunities for improved accuracy and efficiency. The growing adoption of digital radiography and CT in emerging markets presents immense potential for growth. Furthermore, advancements in portable and mobile radiography systems are opening up new applications in diverse settings. The development of more user-friendly and intuitive interfaces is also expected to drive wider adoption across various skill levels.
Leading Players in the Industrial Radiography Equipment Industry Market
- L3Harris Technologies Inc
- Baker Hughes
- Vidisco Ltd (Aran Electronics Ltd)
- Hitachi Ltd
- Comet Holding AG
- Canon Medical Systems Corporation (Canon Inc)
- Rigaku Corporation (Carlyle Group)
- North Star Imaging Inc
- Carestream Health
- Carl Zeiss AG
- Evident Corporation (Bain Capital)
- Hamamatsu Photonics K K
- Durr NDT GmbH & Co Kg
- Teledyne Dalsa Inc (Teledyne Technologies)
- Fujifilm Corporation (Fujifilm Holdings Corporation)
- Nikon Metrology NV (Nikon Corporation)
Key Developments in Industrial Radiography Equipment Industry Industry
- July 2023: Canon Inc. launched the Zexirai9 digital X-ray RF system, a multi-purpose fluoroscopic table with many new functions and a compact design. This launch signifies advancements in digital radiography technology and highlights the ongoing innovation within the industry.
- May 2023: Nikon Metrology announced the launch of its next-generation VOXLS family of X-ray computed tomography (CT) inspection systems. This demonstrates the growing demand for high-resolution 3D imaging capabilities in various industries.
Future Outlook for Industrial Radiography Equipment Industry Market
The Industrial Radiography Equipment market is poised for continued growth, driven by technological advancements and increasing demand from various sectors. The rising adoption of advanced technologies like CT, alongside the ongoing integration of AI and machine learning, will significantly shape the future market landscape. Emerging markets present considerable growth potential, while continuous innovation in product design and functionality will ensure the industry remains at the forefront of non-destructive testing technologies. Strategic partnerships and mergers and acquisitions are expected to play a crucial role in shaping the market's competitive dynamics in the years to come.
Industrial Radiography Equipment Industry Segmentation
-
1. Technology
- 1.1. Film Radiography
- 1.2. Computed Radiography
- 1.3. Direct Radiography
- 1.4. Computed Tomography
-
2. End-User Industry
- 2.1. Aerospace and Defense
- 2.2. Petrochemical and Gas
- 2.3. Energy and Power
- 2.4. Construction
- 2.5. Automotive and Transportation
- 2.6. Manufacturing
- 2.7. Other End-User Industries
Industrial Radiography Equipment Industry Segmentation By Geography
- 1. North America
- 2. Europe
- 3. Asia
- 4. Australia and New Zealand
- 5. Latin America
- 6. Middle East and Africa
Industrial Radiography Equipment Industry Regional Market Share
Geographic Coverage of Industrial Radiography Equipment Industry
Industrial Radiography Equipment Industry REPORT HIGHLIGHTS
| Aspects | Details |
|---|---|
| Study Period | 2020-2034 |
| Base Year | 2025 |
| Estimated Year | 2026 |
| Forecast Period | 2026-2034 |
| Historical Period | 2020-2025 |
| Growth Rate | CAGR of 8.6% from 2020-2034 |
| Segmentation |
|
Table of Contents
- 1. Introduction
- 1.1. Research Scope
- 1.2. Market Segmentation
- 1.3. Research Objective
- 1.4. Definitions and Assumptions
- 2. Executive Summary
- 2.1. Market Snapshot
- 3. Market Dynamics
- 3.1. Market Drivers
- 3.2. Market Restrains
- 3.3. Market Trends
- 3.4. Market Opportunities
- 4. Market Factor Analysis
- 4.1. Porters Five Forces
- 4.1.1. Bargaining Power of Suppliers
- 4.1.2. Bargaining Power of Buyers
- 4.1.3. Threat of New Entrants
- 4.1.4. Threat of Substitutes
- 4.1.5. Competitive Rivalry
- 4.2. PESTEL analysis
- 4.3. BCG Analysis
- 4.3.1. Stars (High Growth, High Market Share)
- 4.3.2. Cash Cows (Low Growth, High Market Share)
- 4.3.3. Question Mark (High Growth, Low Market Share)
- 4.3.4. Dogs (Low Growth, Low Market Share)
- 4.4. Ansoff Matrix Analysis
- 4.5. Supply Chain Analysis
- 4.6. Regulatory Landscape
- 4.7. Current Market Potential and Opportunity Assessment (TAM–SAM–SOM Framework)
- 4.8. PRI Analyst Note
- 4.1. Porters Five Forces
- 5. Market Analysis, Insights and Forecast 2021-2033
- 5.1. Market Analysis, Insights and Forecast - by Technology
- 5.1.1. Film Radiography
- 5.1.2. Computed Radiography
- 5.1.3. Direct Radiography
- 5.1.4. Computed Tomography
- 5.2. Market Analysis, Insights and Forecast - by End-User Industry
- 5.2.1. Aerospace and Defense
- 5.2.2. Petrochemical and Gas
- 5.2.3. Energy and Power
- 5.2.4. Construction
- 5.2.5. Automotive and Transportation
- 5.2.6. Manufacturing
- 5.2.7. Other End-User Industries
- 5.3. Market Analysis, Insights and Forecast - by Region
- 5.3.1. North America
- 5.3.2. Europe
- 5.3.3. Asia
- 5.3.4. Australia and New Zealand
- 5.3.5. Latin America
- 5.3.6. Middle East and Africa
- 5.1. Market Analysis, Insights and Forecast - by Technology
- 6. Global Industrial Radiography Equipment Industry Analysis, Insights and Forecast, 2021-2033
- 6.1. Market Analysis, Insights and Forecast - by Technology
- 6.1.1. Film Radiography
- 6.1.2. Computed Radiography
- 6.1.3. Direct Radiography
- 6.1.4. Computed Tomography
- 6.2. Market Analysis, Insights and Forecast - by End-User Industry
- 6.2.1. Aerospace and Defense
- 6.2.2. Petrochemical and Gas
- 6.2.3. Energy and Power
- 6.2.4. Construction
- 6.2.5. Automotive and Transportation
- 6.2.6. Manufacturing
- 6.2.7. Other End-User Industries
- 6.1. Market Analysis, Insights and Forecast - by Technology
- 7. North America Industrial Radiography Equipment Industry Analysis, Insights and Forecast, 2020-2032
- 7.1. Market Analysis, Insights and Forecast - by Technology
- 7.1.1. Film Radiography
- 7.1.2. Computed Radiography
- 7.1.3. Direct Radiography
- 7.1.4. Computed Tomography
- 7.2. Market Analysis, Insights and Forecast - by End-User Industry
- 7.2.1. Aerospace and Defense
- 7.2.2. Petrochemical and Gas
- 7.2.3. Energy and Power
- 7.2.4. Construction
- 7.2.5. Automotive and Transportation
- 7.2.6. Manufacturing
- 7.2.7. Other End-User Industries
- 7.1. Market Analysis, Insights and Forecast - by Technology
- 8. Europe Industrial Radiography Equipment Industry Analysis, Insights and Forecast, 2020-2032
- 8.1. Market Analysis, Insights and Forecast - by Technology
- 8.1.1. Film Radiography
- 8.1.2. Computed Radiography
- 8.1.3. Direct Radiography
- 8.1.4. Computed Tomography
- 8.2. Market Analysis, Insights and Forecast - by End-User Industry
- 8.2.1. Aerospace and Defense
- 8.2.2. Petrochemical and Gas
- 8.2.3. Energy and Power
- 8.2.4. Construction
- 8.2.5. Automotive and Transportation
- 8.2.6. Manufacturing
- 8.2.7. Other End-User Industries
- 8.1. Market Analysis, Insights and Forecast - by Technology
- 9. Asia Industrial Radiography Equipment Industry Analysis, Insights and Forecast, 2020-2032
- 9.1. Market Analysis, Insights and Forecast - by Technology
- 9.1.1. Film Radiography
- 9.1.2. Computed Radiography
- 9.1.3. Direct Radiography
- 9.1.4. Computed Tomography
- 9.2. Market Analysis, Insights and Forecast - by End-User Industry
- 9.2.1. Aerospace and Defense
- 9.2.2. Petrochemical and Gas
- 9.2.3. Energy and Power
- 9.2.4. Construction
- 9.2.5. Automotive and Transportation
- 9.2.6. Manufacturing
- 9.2.7. Other End-User Industries
- 9.1. Market Analysis, Insights and Forecast - by Technology
- 10. Australia and New Zealand Industrial Radiography Equipment Industry Analysis, Insights and Forecast, 2020-2032
- 10.1. Market Analysis, Insights and Forecast - by Technology
- 10.1.1. Film Radiography
- 10.1.2. Computed Radiography
- 10.1.3. Direct Radiography
- 10.1.4. Computed Tomography
- 10.2. Market Analysis, Insights and Forecast - by End-User Industry
- 10.2.1. Aerospace and Defense
- 10.2.2. Petrochemical and Gas
- 10.2.3. Energy and Power
- 10.2.4. Construction
- 10.2.5. Automotive and Transportation
- 10.2.6. Manufacturing
- 10.2.7. Other End-User Industries
- 10.1. Market Analysis, Insights and Forecast - by Technology
- 11. Latin America Industrial Radiography Equipment Industry Analysis, Insights and Forecast, 2020-2032
- 11.1. Market Analysis, Insights and Forecast - by Technology
- 11.1.1. Film Radiography
- 11.1.2. Computed Radiography
- 11.1.3. Direct Radiography
- 11.1.4. Computed Tomography
- 11.2. Market Analysis, Insights and Forecast - by End-User Industry
- 11.2.1. Aerospace and Defense
- 11.2.2. Petrochemical and Gas
- 11.2.3. Energy and Power
- 11.2.4. Construction
- 11.2.5. Automotive and Transportation
- 11.2.6. Manufacturing
- 11.2.7. Other End-User Industries
- 11.1. Market Analysis, Insights and Forecast - by Technology
- 12. Middle East and Africa Industrial Radiography Equipment Industry Analysis, Insights and Forecast, 2020-2032
- 12.1. Market Analysis, Insights and Forecast - by Technology
- 12.1.1. Film Radiography
- 12.1.2. Computed Radiography
- 12.1.3. Direct Radiography
- 12.1.4. Computed Tomography
- 12.2. Market Analysis, Insights and Forecast - by End-User Industry
- 12.2.1. Aerospace and Defense
- 12.2.2. Petrochemical and Gas
- 12.2.3. Energy and Power
- 12.2.4. Construction
- 12.2.5. Automotive and Transportation
- 12.2.6. Manufacturing
- 12.2.7. Other End-User Industries
- 12.1. Market Analysis, Insights and Forecast - by Technology
- 13. Competitive Analysis
- 13.1. Company Profiles
- 13.1.1 L3Harris Technologies Inc
- 13.1.1.1. Company Overview
- 13.1.1.2. Products
- 13.1.1.3. Company Financials
- 13.1.1.4. SWOT Analysis
- 13.1.2 Baker Hughes
- 13.1.2.1. Company Overview
- 13.1.2.2. Products
- 13.1.2.3. Company Financials
- 13.1.2.4. SWOT Analysis
- 13.1.3 Vidisco Ltd (Aran Electronics Ltd )
- 13.1.3.1. Company Overview
- 13.1.3.2. Products
- 13.1.3.3. Company Financials
- 13.1.3.4. SWOT Analysis
- 13.1.4 Hitachi Ltd
- 13.1.4.1. Company Overview
- 13.1.4.2. Products
- 13.1.4.3. Company Financials
- 13.1.4.4. SWOT Analysis
- 13.1.5 Comet Holding AG
- 13.1.5.1. Company Overview
- 13.1.5.2. Products
- 13.1.5.3. Company Financials
- 13.1.5.4. SWOT Analysis
- 13.1.6 Canon Medical Systems Corporation (Canon Inc )
- 13.1.6.1. Company Overview
- 13.1.6.2. Products
- 13.1.6.3. Company Financials
- 13.1.6.4. SWOT Analysis
- 13.1.7 Rigaku Corporation (Carlyle Group)
- 13.1.7.1. Company Overview
- 13.1.7.2. Products
- 13.1.7.3. Company Financials
- 13.1.7.4. SWOT Analysis
- 13.1.8 North Star Imaging Inc
- 13.1.8.1. Company Overview
- 13.1.8.2. Products
- 13.1.8.3. Company Financials
- 13.1.8.4. SWOT Analysis
- 13.1.9 Carestream Health
- 13.1.9.1. Company Overview
- 13.1.9.2. Products
- 13.1.9.3. Company Financials
- 13.1.9.4. SWOT Analysis
- 13.1.10 Carl Zeiss AG
- 13.1.10.1. Company Overview
- 13.1.10.2. Products
- 13.1.10.3. Company Financials
- 13.1.10.4. SWOT Analysis
- 13.1.11 Evident Corporation (Bain Capital)
- 13.1.11.1. Company Overview
- 13.1.11.2. Products
- 13.1.11.3. Company Financials
- 13.1.11.4. SWOT Analysis
- 13.1.12 Hamamatsu Photonics K K
- 13.1.12.1. Company Overview
- 13.1.12.2. Products
- 13.1.12.3. Company Financials
- 13.1.12.4. SWOT Analysis
- 13.1.13 Durr NDT GmbH & Co Kg
- 13.1.13.1. Company Overview
- 13.1.13.2. Products
- 13.1.13.3. Company Financials
- 13.1.13.4. SWOT Analysis
- 13.1.14 Teledyne Dalsa Inc (Teledyne Technologies)
- 13.1.14.1. Company Overview
- 13.1.14.2. Products
- 13.1.14.3. Company Financials
- 13.1.14.4. SWOT Analysis
- 13.1.15 Fujifilm Corporation (Fujifilm Holdings Corporation)
- 13.1.15.1. Company Overview
- 13.1.15.2. Products
- 13.1.15.3. Company Financials
- 13.1.15.4. SWOT Analysis
- 13.1.16 Nikon Metrology NV (Nikon Corporation)
- 13.1.16.1. Company Overview
- 13.1.16.2. Products
- 13.1.16.3. Company Financials
- 13.1.16.4. SWOT Analysis
- 13.1.1 L3Harris Technologies Inc
- 13.2. Market Entropy
- 13.2.1 Company's Key Areas Served
- 13.2.2 Recent Developments
- 13.3. Company Market Share Analysis 2025
- 13.3.1 Top 5 Companies Market Share Analysis
- 13.3.2 Top 3 Companies Market Share Analysis
- 13.4. List of Potential Customers
- 14. Research Methodology
List of Figures
- Figure 1: Global Industrial Radiography Equipment Industry Revenue Breakdown (billion, %) by Region 2025 & 2033
- Figure 2: Global Industrial Radiography Equipment Industry Volume Breakdown (K Unit, %) by Region 2025 & 2033
- Figure 3: North America Industrial Radiography Equipment Industry Revenue (billion), by Technology 2025 & 2033
- Figure 4: North America Industrial Radiography Equipment Industry Volume (K Unit), by Technology 2025 & 2033
- Figure 5: North America Industrial Radiography Equipment Industry Revenue Share (%), by Technology 2025 & 2033
- Figure 6: North America Industrial Radiography Equipment Industry Volume Share (%), by Technology 2025 & 2033
- Figure 7: North America Industrial Radiography Equipment Industry Revenue (billion), by End-User Industry 2025 & 2033
- Figure 8: North America Industrial Radiography Equipment Industry Volume (K Unit), by End-User Industry 2025 & 2033
- Figure 9: North America Industrial Radiography Equipment Industry Revenue Share (%), by End-User Industry 2025 & 2033
- Figure 10: North America Industrial Radiography Equipment Industry Volume Share (%), by End-User Industry 2025 & 2033
- Figure 11: North America Industrial Radiography Equipment Industry Revenue (billion), by Country 2025 & 2033
- Figure 12: North America Industrial Radiography Equipment Industry Volume (K Unit), by Country 2025 & 2033
- Figure 13: North America Industrial Radiography Equipment Industry Revenue Share (%), by Country 2025 & 2033
- Figure 14: North America Industrial Radiography Equipment Industry Volume Share (%), by Country 2025 & 2033
- Figure 15: Europe Industrial Radiography Equipment Industry Revenue (billion), by Technology 2025 & 2033
- Figure 16: Europe Industrial Radiography Equipment Industry Volume (K Unit), by Technology 2025 & 2033
- Figure 17: Europe Industrial Radiography Equipment Industry Revenue Share (%), by Technology 2025 & 2033
- Figure 18: Europe Industrial Radiography Equipment Industry Volume Share (%), by Technology 2025 & 2033
- Figure 19: Europe Industrial Radiography Equipment Industry Revenue (billion), by End-User Industry 2025 & 2033
- Figure 20: Europe Industrial Radiography Equipment Industry Volume (K Unit), by End-User Industry 2025 & 2033
- Figure 21: Europe Industrial Radiography Equipment Industry Revenue Share (%), by End-User Industry 2025 & 2033
- Figure 22: Europe Industrial Radiography Equipment Industry Volume Share (%), by End-User Industry 2025 & 2033
- Figure 23: Europe Industrial Radiography Equipment Industry Revenue (billion), by Country 2025 & 2033
- Figure 24: Europe Industrial Radiography Equipment Industry Volume (K Unit), by Country 2025 & 2033
- Figure 25: Europe Industrial Radiography Equipment Industry Revenue Share (%), by Country 2025 & 2033
- Figure 26: Europe Industrial Radiography Equipment Industry Volume Share (%), by Country 2025 & 2033
- Figure 27: Asia Industrial Radiography Equipment Industry Revenue (billion), by Technology 2025 & 2033
- Figure 28: Asia Industrial Radiography Equipment Industry Volume (K Unit), by Technology 2025 & 2033
- Figure 29: Asia Industrial Radiography Equipment Industry Revenue Share (%), by Technology 2025 & 2033
- Figure 30: Asia Industrial Radiography Equipment Industry Volume Share (%), by Technology 2025 & 2033
- Figure 31: Asia Industrial Radiography Equipment Industry Revenue (billion), by End-User Industry 2025 & 2033
- Figure 32: Asia Industrial Radiography Equipment Industry Volume (K Unit), by End-User Industry 2025 & 2033
- Figure 33: Asia Industrial Radiography Equipment Industry Revenue Share (%), by End-User Industry 2025 & 2033
- Figure 34: Asia Industrial Radiography Equipment Industry Volume Share (%), by End-User Industry 2025 & 2033
- Figure 35: Asia Industrial Radiography Equipment Industry Revenue (billion), by Country 2025 & 2033
- Figure 36: Asia Industrial Radiography Equipment Industry Volume (K Unit), by Country 2025 & 2033
- Figure 37: Asia Industrial Radiography Equipment Industry Revenue Share (%), by Country 2025 & 2033
- Figure 38: Asia Industrial Radiography Equipment Industry Volume Share (%), by Country 2025 & 2033
- Figure 39: Australia and New Zealand Industrial Radiography Equipment Industry Revenue (billion), by Technology 2025 & 2033
- Figure 40: Australia and New Zealand Industrial Radiography Equipment Industry Volume (K Unit), by Technology 2025 & 2033
- Figure 41: Australia and New Zealand Industrial Radiography Equipment Industry Revenue Share (%), by Technology 2025 & 2033
- Figure 42: Australia and New Zealand Industrial Radiography Equipment Industry Volume Share (%), by Technology 2025 & 2033
- Figure 43: Australia and New Zealand Industrial Radiography Equipment Industry Revenue (billion), by End-User Industry 2025 & 2033
- Figure 44: Australia and New Zealand Industrial Radiography Equipment Industry Volume (K Unit), by End-User Industry 2025 & 2033
- Figure 45: Australia and New Zealand Industrial Radiography Equipment Industry Revenue Share (%), by End-User Industry 2025 & 2033
- Figure 46: Australia and New Zealand Industrial Radiography Equipment Industry Volume Share (%), by End-User Industry 2025 & 2033
- Figure 47: Australia and New Zealand Industrial Radiography Equipment Industry Revenue (billion), by Country 2025 & 2033
- Figure 48: Australia and New Zealand Industrial Radiography Equipment Industry Volume (K Unit), by Country 2025 & 2033
- Figure 49: Australia and New Zealand Industrial Radiography Equipment Industry Revenue Share (%), by Country 2025 & 2033
- Figure 50: Australia and New Zealand Industrial Radiography Equipment Industry Volume Share (%), by Country 2025 & 2033
- Figure 51: Latin America Industrial Radiography Equipment Industry Revenue (billion), by Technology 2025 & 2033
- Figure 52: Latin America Industrial Radiography Equipment Industry Volume (K Unit), by Technology 2025 & 2033
- Figure 53: Latin America Industrial Radiography Equipment Industry Revenue Share (%), by Technology 2025 & 2033
- Figure 54: Latin America Industrial Radiography Equipment Industry Volume Share (%), by Technology 2025 & 2033
- Figure 55: Latin America Industrial Radiography Equipment Industry Revenue (billion), by End-User Industry 2025 & 2033
- Figure 56: Latin America Industrial Radiography Equipment Industry Volume (K Unit), by End-User Industry 2025 & 2033
- Figure 57: Latin America Industrial Radiography Equipment Industry Revenue Share (%), by End-User Industry 2025 & 2033
- Figure 58: Latin America Industrial Radiography Equipment Industry Volume Share (%), by End-User Industry 2025 & 2033
- Figure 59: Latin America Industrial Radiography Equipment Industry Revenue (billion), by Country 2025 & 2033
- Figure 60: Latin America Industrial Radiography Equipment Industry Volume (K Unit), by Country 2025 & 2033
- Figure 61: Latin America Industrial Radiography Equipment Industry Revenue Share (%), by Country 2025 & 2033
- Figure 62: Latin America Industrial Radiography Equipment Industry Volume Share (%), by Country 2025 & 2033
- Figure 63: Middle East and Africa Industrial Radiography Equipment Industry Revenue (billion), by Technology 2025 & 2033
- Figure 64: Middle East and Africa Industrial Radiography Equipment Industry Volume (K Unit), by Technology 2025 & 2033
- Figure 65: Middle East and Africa Industrial Radiography Equipment Industry Revenue Share (%), by Technology 2025 & 2033
- Figure 66: Middle East and Africa Industrial Radiography Equipment Industry Volume Share (%), by Technology 2025 & 2033
- Figure 67: Middle East and Africa Industrial Radiography Equipment Industry Revenue (billion), by End-User Industry 2025 & 2033
- Figure 68: Middle East and Africa Industrial Radiography Equipment Industry Volume (K Unit), by End-User Industry 2025 & 2033
- Figure 69: Middle East and Africa Industrial Radiography Equipment Industry Revenue Share (%), by End-User Industry 2025 & 2033
- Figure 70: Middle East and Africa Industrial Radiography Equipment Industry Volume Share (%), by End-User Industry 2025 & 2033
- Figure 71: Middle East and Africa Industrial Radiography Equipment Industry Revenue (billion), by Country 2025 & 2033
- Figure 72: Middle East and Africa Industrial Radiography Equipment Industry Volume (K Unit), by Country 2025 & 2033
- Figure 73: Middle East and Africa Industrial Radiography Equipment Industry Revenue Share (%), by Country 2025 & 2033
- Figure 74: Middle East and Africa Industrial Radiography Equipment Industry Volume Share (%), by Country 2025 & 2033
List of Tables
- Table 1: Global Industrial Radiography Equipment Industry Revenue billion Forecast, by Technology 2020 & 2033
- Table 2: Global Industrial Radiography Equipment Industry Volume K Unit Forecast, by Technology 2020 & 2033
- Table 3: Global Industrial Radiography Equipment Industry Revenue billion Forecast, by End-User Industry 2020 & 2033
- Table 4: Global Industrial Radiography Equipment Industry Volume K Unit Forecast, by End-User Industry 2020 & 2033
- Table 5: Global Industrial Radiography Equipment Industry Revenue billion Forecast, by Region 2020 & 2033
- Table 6: Global Industrial Radiography Equipment Industry Volume K Unit Forecast, by Region 2020 & 2033
- Table 7: Global Industrial Radiography Equipment Industry Revenue billion Forecast, by Technology 2020 & 2033
- Table 8: Global Industrial Radiography Equipment Industry Volume K Unit Forecast, by Technology 2020 & 2033
- Table 9: Global Industrial Radiography Equipment Industry Revenue billion Forecast, by End-User Industry 2020 & 2033
- Table 10: Global Industrial Radiography Equipment Industry Volume K Unit Forecast, by End-User Industry 2020 & 2033
- Table 11: Global Industrial Radiography Equipment Industry Revenue billion Forecast, by Country 2020 & 2033
- Table 12: Global Industrial Radiography Equipment Industry Volume K Unit Forecast, by Country 2020 & 2033
- Table 13: Global Industrial Radiography Equipment Industry Revenue billion Forecast, by Technology 2020 & 2033
- Table 14: Global Industrial Radiography Equipment Industry Volume K Unit Forecast, by Technology 2020 & 2033
- Table 15: Global Industrial Radiography Equipment Industry Revenue billion Forecast, by End-User Industry 2020 & 2033
- Table 16: Global Industrial Radiography Equipment Industry Volume K Unit Forecast, by End-User Industry 2020 & 2033
- Table 17: Global Industrial Radiography Equipment Industry Revenue billion Forecast, by Country 2020 & 2033
- Table 18: Global Industrial Radiography Equipment Industry Volume K Unit Forecast, by Country 2020 & 2033
- Table 19: Global Industrial Radiography Equipment Industry Revenue billion Forecast, by Technology 2020 & 2033
- Table 20: Global Industrial Radiography Equipment Industry Volume K Unit Forecast, by Technology 2020 & 2033
- Table 21: Global Industrial Radiography Equipment Industry Revenue billion Forecast, by End-User Industry 2020 & 2033
- Table 22: Global Industrial Radiography Equipment Industry Volume K Unit Forecast, by End-User Industry 2020 & 2033
- Table 23: Global Industrial Radiography Equipment Industry Revenue billion Forecast, by Country 2020 & 2033
- Table 24: Global Industrial Radiography Equipment Industry Volume K Unit Forecast, by Country 2020 & 2033
- Table 25: Global Industrial Radiography Equipment Industry Revenue billion Forecast, by Technology 2020 & 2033
- Table 26: Global Industrial Radiography Equipment Industry Volume K Unit Forecast, by Technology 2020 & 2033
- Table 27: Global Industrial Radiography Equipment Industry Revenue billion Forecast, by End-User Industry 2020 & 2033
- Table 28: Global Industrial Radiography Equipment Industry Volume K Unit Forecast, by End-User Industry 2020 & 2033
- Table 29: Global Industrial Radiography Equipment Industry Revenue billion Forecast, by Country 2020 & 2033
- Table 30: Global Industrial Radiography Equipment Industry Volume K Unit Forecast, by Country 2020 & 2033
- Table 31: Global Industrial Radiography Equipment Industry Revenue billion Forecast, by Technology 2020 & 2033
- Table 32: Global Industrial Radiography Equipment Industry Volume K Unit Forecast, by Technology 2020 & 2033
- Table 33: Global Industrial Radiography Equipment Industry Revenue billion Forecast, by End-User Industry 2020 & 2033
- Table 34: Global Industrial Radiography Equipment Industry Volume K Unit Forecast, by End-User Industry 2020 & 2033
- Table 35: Global Industrial Radiography Equipment Industry Revenue billion Forecast, by Country 2020 & 2033
- Table 36: Global Industrial Radiography Equipment Industry Volume K Unit Forecast, by Country 2020 & 2033
- Table 37: Global Industrial Radiography Equipment Industry Revenue billion Forecast, by Technology 2020 & 2033
- Table 38: Global Industrial Radiography Equipment Industry Volume K Unit Forecast, by Technology 2020 & 2033
- Table 39: Global Industrial Radiography Equipment Industry Revenue billion Forecast, by End-User Industry 2020 & 2033
- Table 40: Global Industrial Radiography Equipment Industry Volume K Unit Forecast, by End-User Industry 2020 & 2033
- Table 41: Global Industrial Radiography Equipment Industry Revenue billion Forecast, by Country 2020 & 2033
- Table 42: Global Industrial Radiography Equipment Industry Volume K Unit Forecast, by Country 2020 & 2033
Frequently Asked Questions
1. What is the projected Compound Annual Growth Rate (CAGR) of the Industrial Radiography Equipment Industry?
The projected CAGR is approximately 8.6%.
2. Which companies are prominent players in the Industrial Radiography Equipment Industry?
Key companies in the market include L3Harris Technologies Inc, Baker Hughes, Vidisco Ltd (Aran Electronics Ltd ), Hitachi Ltd, Comet Holding AG, Canon Medical Systems Corporation (Canon Inc ), Rigaku Corporation (Carlyle Group), North Star Imaging Inc, Carestream Health, Carl Zeiss AG, Evident Corporation (Bain Capital), Hamamatsu Photonics K K, Durr NDT GmbH & Co Kg, Teledyne Dalsa Inc (Teledyne Technologies), Fujifilm Corporation (Fujifilm Holdings Corporation), Nikon Metrology NV (Nikon Corporation).
3. What are the main segments of the Industrial Radiography Equipment Industry?
The market segments include Technology, End-User Industry.
4. Can you provide details about the market size?
The market size is estimated to be USD 1.35 billion as of 2022.
5. What are some drivers contributing to market growth?
Rising Demand From Automotive and Aerospace Industry; Augmented Accuracy of Inspection With the Integration of Advanced Software.
6. What are the notable trends driving market growth?
Aerospace and Defense to be the Largest End User.
7. Are there any restraints impacting market growth?
High Risk of Radiation Since it uses Gamma Rays. X-Rays; High Deployment Costs.
8. Can you provide examples of recent developments in the market?
July 2023: Canon Inc. launched the Zexirai9 digital X-ray RF system, a multi-purpose fluoroscopic table with many new functions and a compact design. Zexirai9 is a new digital X-ray RF system equipped with Canon's flat panel detector (FPD) and a newly developed image processing technology; the system has been developed in consultation with medical staff, referring physicians, and engineers.
9. What pricing options are available for accessing the report?
Pricing options include single-user, multi-user, and enterprise licenses priced at USD 4750, USD 5250, and USD 8750 respectively.
10. Is the market size provided in terms of value or volume?
The market size is provided in terms of value, measured in billion and volume, measured in K Unit.
11. Are there any specific market keywords associated with the report?
Yes, the market keyword associated with the report is "Industrial Radiography Equipment Industry," which aids in identifying and referencing the specific market segment covered.
12. How do I determine which pricing option suits my needs best?
The pricing options vary based on user requirements and access needs. Individual users may opt for single-user licenses, while businesses requiring broader access may choose multi-user or enterprise licenses for cost-effective access to the report.
13. Are there any additional resources or data provided in the Industrial Radiography Equipment Industry report?
While the report offers comprehensive insights, it's advisable to review the specific contents or supplementary materials provided to ascertain if additional resources or data are available.
14. How can I stay updated on further developments or reports in the Industrial Radiography Equipment Industry?
To stay informed about further developments, trends, and reports in the Industrial Radiography Equipment Industry, consider subscribing to industry newsletters, following relevant companies and organizations, or regularly checking reputable industry news sources and publications.
Methodology
Step 1 - Identification of Relevant Samples Size from Population Database


Step 2 - Approaches for Defining Global Market Size (Value, Volume* & Price*)

Note*: In applicable scenarios
Step 3 - Data Sources
Primary Research
- Web Analytics
- Survey Reports
- Research Institute
- Latest Research Reports
- Opinion Leaders
Secondary Research
- Annual Reports
- White Paper
- Latest Press Release
- Industry Association
- Paid Database
- Investor Presentations

Step 4 - Data Triangulation
Involves using different sources of information in order to increase the validity of a study
These sources are likely to be stakeholders in a program - participants, other researchers, program staff, other community members, and so on.
Then we put all data in single framework & apply various statistical tools to find out the dynamic on the market.
During the analysis stage, feedback from the stakeholder groups would be compared to determine areas of agreement as well as areas of divergence