
Key Insights
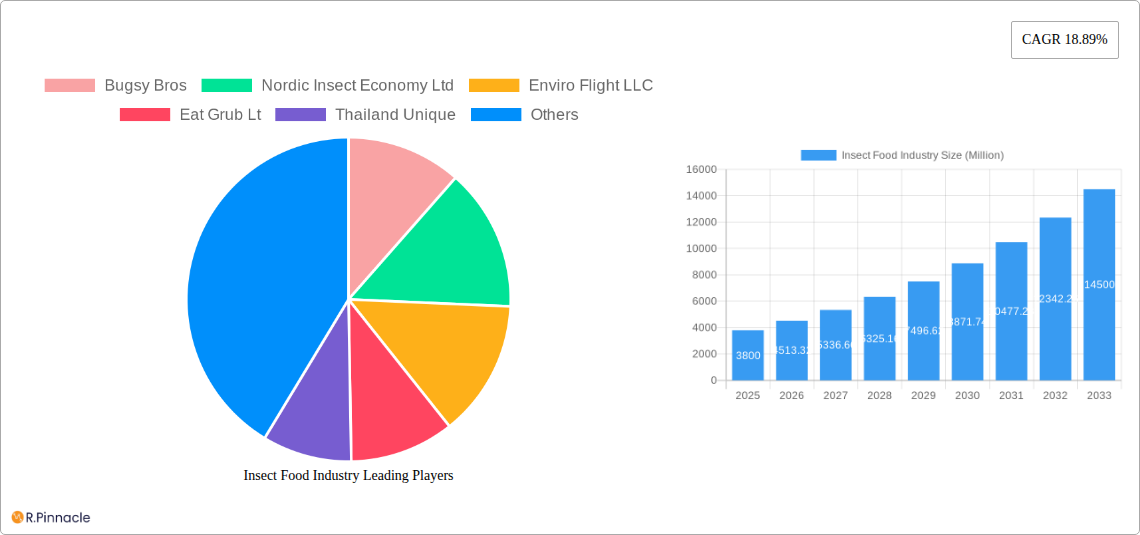
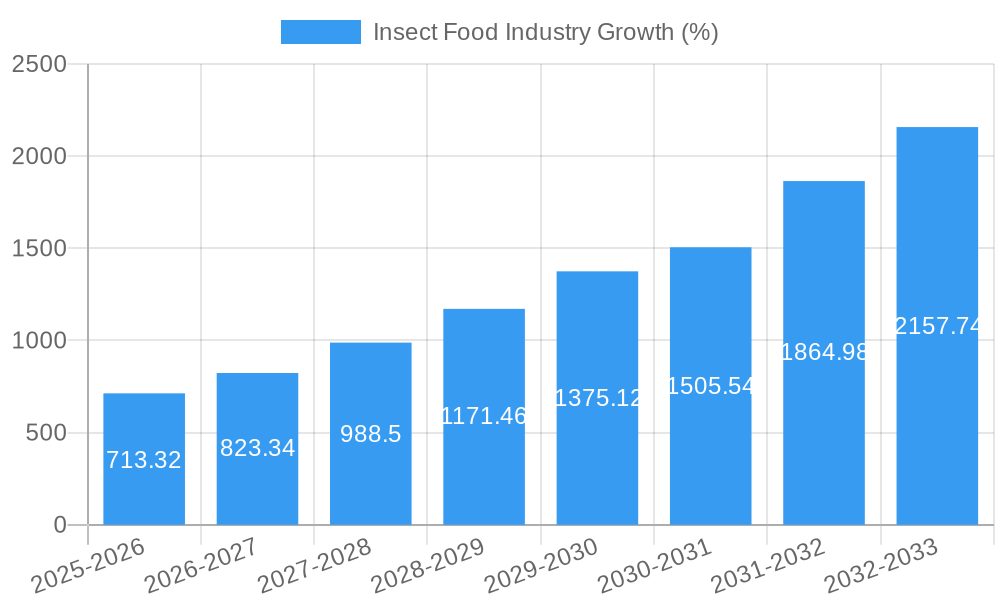
The global insect food market, valued at $3.80 billion in 2025, is experiencing robust growth, projected to expand at a compound annual growth rate (CAGR) of 18.89% from 2025 to 2033. This surge is driven by several key factors. Increasing consumer awareness of the environmental benefits of entomophagy (insect consumption), coupled with the rising demand for sustainable and alternative protein sources, is a primary driver. Insect farming requires significantly less land, water, and feed compared to traditional livestock, making it an attractive option for environmentally conscious consumers. Furthermore, the high protein content, essential amino acids, and micronutrients present in insects are fueling their appeal as a nutritious and healthy food source. Growing concerns about food security and the need for innovative protein solutions to feed a burgeoning global population are also contributing to market expansion. Technological advancements in insect farming and processing are further enhancing efficiency and scalability, making insect-based products more readily available and affordable. Specific product types like insect flours and whole insects are gaining traction, while beetle-based products dominate the insect type segment, benefiting from their ease of cultivation and versatility in various applications.
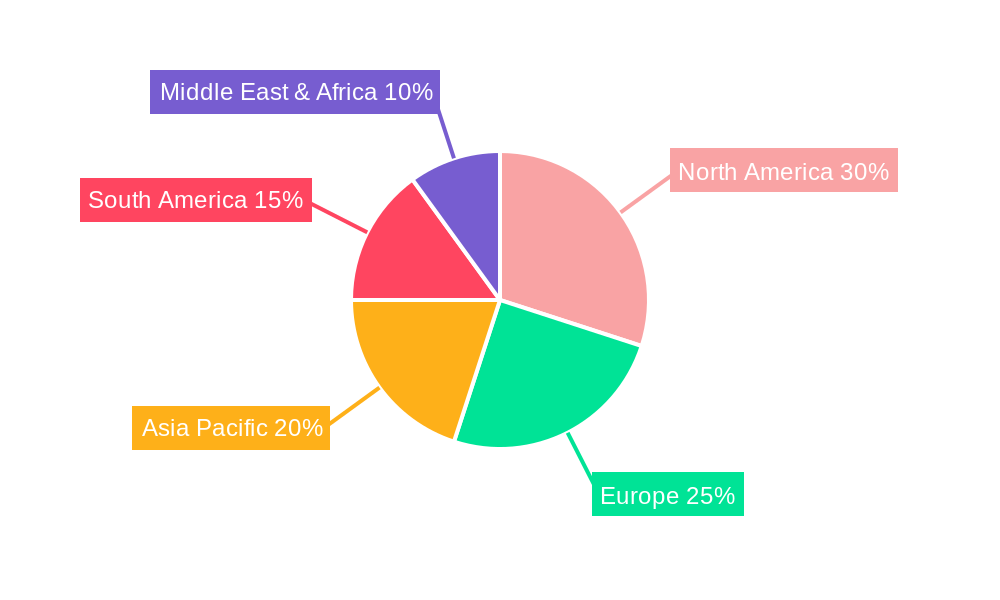
The market's segmentation reveals significant opportunities. While beetles currently hold the largest market share among insect types, other insect species like caterpillars and Hymenoptera (ants, bees, wasps) are showing promising growth potential. Similarly, the "as an ingredient" segment within product type is expanding rapidly, highlighting the increasing adoption of insect-based ingredients in food processing. Geographical distribution sees North America and Europe as leading regions, driven by strong consumer acceptance and regulatory frameworks supporting insect farming. However, the Asia-Pacific region is poised for substantial growth, given its large population and increasing demand for alternative protein solutions. Despite these positive trends, challenges such as overcoming consumer perception barriers (related to cultural acceptance of insect consumption) and establishing robust regulatory frameworks in certain regions remain crucial factors influencing market growth. Addressing these challenges will be vital to unlock the full potential of the insect food market.
Insect Food Industry: A Comprehensive Market Report (2019-2033)
This comprehensive report provides an in-depth analysis of the burgeoning insect food industry, projecting a market value exceeding $XX Million by 2033. Leveraging data from 2019-2024 (Historical Period), with 2025 as the base and estimated year, this report offers crucial insights for industry professionals, investors, and stakeholders seeking to navigate this rapidly evolving sector. The forecast period spans 2025-2033.
Insect Food Industry Market Structure & Innovation Trends
This section analyzes the market's competitive landscape, highlighting key innovation drivers and regulatory influences shaping the industry's trajectory. We examine market concentration, exploring the market share held by leading players such as Bugsy Bros, Nordic Insect Economy Ltd, Enviro Flight LLC, Eat Grub Ltd, Thailand Unique, Exo Inc, Proti-Farm, Entomo Farms Ltd, Deli Bugs Ltd, and Kreca Ento-Feed BV. The report delves into the impact of mergers and acquisitions (M&A) activities, quantifying deal values where possible (e.g., a recent M&A deal in the sector valued at $XX Million). The analysis also covers:
- Market Concentration: Assessing the dominance of key players and the overall level of competition.
- Innovation Drivers: Identifying technological advancements, consumer demand shifts, and regulatory changes fueling innovation.
- Regulatory Frameworks: Examining the evolving regulatory landscape and its impact on market growth and product development.
- Product Substitutes: Analyzing alternative protein sources and their competitive threat to insect-based foods.
- End-User Demographics: Profiling the key consumer segments driving demand for insect-based products.
- M&A Activity: Evaluating the frequency and financial implications of mergers and acquisitions within the industry.
Insect Food Industry Market Dynamics & Trends
This section provides a detailed examination of the market's growth trajectory, driven by factors such as increasing consumer awareness of sustainable food sources, rising demand for alternative proteins, and advancements in insect farming technologies. The report analyzes the Compound Annual Growth Rate (CAGR) and market penetration rates for different product segments. We explore:
- Market Growth Drivers: Analyzing factors such as rising consumer demand for sustainable and ethical food sources, increasing awareness of the nutritional benefits of insects, and technological advancements in insect farming.
- Technological Disruptions: Assessing the impact of emerging technologies on production efficiency, processing methods, and product development.
- Consumer Preferences: Examining evolving consumer attitudes toward insect-based foods and their impact on market demand.
- Competitive Dynamics: Analyzing the competitive landscape, including market share, pricing strategies, and product differentiation tactics employed by key players.
Dominant Regions & Segments in Insect Food Industry
This section identifies the leading geographical regions and product segments within the insect food market. We analyze key drivers of dominance for each, including economic policies, infrastructure development, and consumer acceptance.
- Leading Regions: [Detailed analysis of dominant regions, including factors contributing to their success. Examples may include specific countries in Europe, North America, or Asia, based on market size and growth rates.]
- Dominant Insect Types: Detailed analysis of market share and growth potential for Beetles, Caterpillar, Hymenoptera, Orthoptera, Tree Bugs, and Other Insect Types. [Specific examples of dominant insect types and reasons for their popularity will be included.]
- Dominant Product Types: Detailed analysis of market share and growth potential for “As a Whole” and “Raw: As a Ingredient” product types. [Specific examples and reasons for their prevalence will be included.]
- Key Drivers:
- Economic Policies: Government support for sustainable agriculture and alternative protein sources.
- Infrastructure: Availability of processing facilities, distribution networks, and research infrastructure.
Insect Food Industry Product Innovations
This section showcases recent advancements in insect-based food products, highlighting innovative applications and competitive advantages. We explore the role of technological trends in shaping product development and market acceptance. The analysis emphasizes the increasing diversity of insect-based products beyond basic flours and powders, including ready-to-eat snacks, protein bars, and other food items.
Report Scope & Segmentation Analysis
This report segments the insect food market across various parameters to offer a granular view of market dynamics.
Insect Type: Beetles, Caterpillar, Hymenoptera, Orthoptera, Tree Bugs, Other Insect Types. [Growth projections, market sizes, and competitive dynamics for each segment will be provided.]
Product Type: As a Whole, Raw: As a Ingredient. [Growth projections, market sizes, and competitive dynamics for each segment will be provided.]
Key Drivers of Insect Food Industry Growth
Several factors contribute to the growth of the insect food industry. These include increasing awareness of environmental sustainability, the nutritional benefits of insects, technological advancements in insect farming, and supportive government policies promoting alternative protein sources. For example, the rising global population and the need for sustainable food systems are creating a strong demand for alternative protein sources, thus increasing interest in insect-based foods. Further, innovations in insect farming are enabling large-scale production, making insect-based products more widely available and affordable.
Challenges in the Insect Food Industry Sector
Despite its growth potential, the insect food industry faces challenges, including consumer acceptance, regulatory hurdles in some markets, and supply chain complexities. The establishment of clear food safety regulations and overcoming consumer perceptions are crucial for sustainable industry growth. The cost of insect farming and processing can also present challenges to wider market adoption.
Emerging Opportunities in Insect Food Industry
The insect food industry offers various emerging opportunities, including the development of new products, expansion into new markets, and advancements in processing technologies. Opportunities exist in developing value-added products, such as insect-based protein supplements and snacks, and penetrating new consumer markets through targeted marketing and educational campaigns.
Leading Players in the Insect Food Industry Market
- Bugsy Bros
- Nordic Insect Economy Ltd
- Enviro Flight LLC
- Eat Grub Ltd
- Thailand Unique
- Exo Inc
- Proti-Farm
- Entomo Farms Ltd
- Deli Bugs Ltd
- Kreca Ento-Feed BV
Key Developments in Insect Food Industry
- September 2022: Lotte Confectionery and Aspire Food Group signed an MOU to cooperate on protein alternatives and edible insects.
- September 2022: InnovaFeed raised USD 250 Million to expand its black soldier fly production facility.
- April 2022: The ValuSect consortium provided EUR 460,000 (USD 496,600) in services to 18 edible insect enterprises.
Future Outlook for Insect Food Industry Market
The insect food industry exhibits significant growth potential. Continued innovation in insect farming and processing technologies, coupled with increasing consumer acceptance and supportive regulatory frameworks, will drive market expansion in the coming years. Strategic partnerships and investments are expected to further accelerate industry growth and broaden the availability of insect-based food products.
Insect Food Industry Segmentation
- 1. Production Analysis
- 2. Consumption Analysis
- 3. Import Market Analysis (Value & Volume)
- 4. Export Market Analysis (Value & Volume)
- 5. Price Trend Analysis
Insect Food Industry Segmentation By Geography
-
1. North America
- 1.1. United States
- 1.2. Canada
- 1.3. Mexico
-
2. South America
- 2.1. Brazil
- 2.2. Argentina
- 2.3. Rest of South America
-
3. Europe
- 3.1. United Kingdom
- 3.2. Germany
- 3.3. France
- 3.4. Italy
- 3.5. Spain
- 3.6. Russia
- 3.7. Benelux
- 3.8. Nordics
- 3.9. Rest of Europe
-
4. Middle East & Africa
- 4.1. Turkey
- 4.2. Israel
- 4.3. GCC
- 4.4. North Africa
- 4.5. South Africa
- 4.6. Rest of Middle East & Africa
-
5. Asia Pacific
- 5.1. China
- 5.2. India
- 5.3. Japan
- 5.4. South Korea
- 5.5. ASEAN
- 5.6. Oceania
- 5.7. Rest of Asia Pacific
Insect Food Industry REPORT HIGHLIGHTS
| Aspects | Details |
|---|---|
| Study Period | 2019-2033 |
| Base Year | 2024 |
| Estimated Year | 2025 |
| Forecast Period | 2025-2033 |
| Historical Period | 2019-2024 |
| Growth Rate | CAGR of 18.89% from 2019-2033 |
| Segmentation |
|
Table of Contents
- 1. Introduction
- 1.1. Research Scope
- 1.2. Market Segmentation
- 1.3. Research Methodology
- 1.4. Definitions and Assumptions
- 2. Executive Summary
- 2.1. Introduction
- 3. Market Dynamics
- 3.1. Introduction
- 3.2. Market Drivers
- 3.2.1. Decreasing Per Capita Arable Land; Increased Demand for Food
- 3.3. Market Restrains
- 3.3.1. High Initial Investments; Requirement of Precision Agriculture
- 3.4. Market Trends
- 3.4.1. Easy Availability and High Protein Content in The Edible Insects
- 4. Market Factor Analysis
- 4.1. Porters Five Forces
- 4.2. Supply/Value Chain
- 4.3. PESTEL analysis
- 4.4. Market Entropy
- 4.5. Patent/Trademark Analysis
- 5. Global Insect Food Industry Analysis, Insights and Forecast, 2019-2031
- 5.1. Market Analysis, Insights and Forecast - by Production Analysis
- 5.2. Market Analysis, Insights and Forecast - by Consumption Analysis
- 5.3. Market Analysis, Insights and Forecast - by Import Market Analysis (Value & Volume)
- 5.4. Market Analysis, Insights and Forecast - by Export Market Analysis (Value & Volume)
- 5.5. Market Analysis, Insights and Forecast - by Price Trend Analysis
- 5.6. Market Analysis, Insights and Forecast - by Region
- 5.6.1. North America
- 5.6.2. South America
- 5.6.3. Europe
- 5.6.4. Middle East & Africa
- 5.6.5. Asia Pacific
- 5.1. Market Analysis, Insights and Forecast - by Production Analysis
- 6. North America Insect Food Industry Analysis, Insights and Forecast, 2019-2031
- 6.1. Market Analysis, Insights and Forecast - by Production Analysis
- 6.2. Market Analysis, Insights and Forecast - by Consumption Analysis
- 6.3. Market Analysis, Insights and Forecast - by Import Market Analysis (Value & Volume)
- 6.4. Market Analysis, Insights and Forecast - by Export Market Analysis (Value & Volume)
- 6.5. Market Analysis, Insights and Forecast - by Price Trend Analysis
- 6.1. Market Analysis, Insights and Forecast - by Production Analysis
- 7. South America Insect Food Industry Analysis, Insights and Forecast, 2019-2031
- 7.1. Market Analysis, Insights and Forecast - by Production Analysis
- 7.2. Market Analysis, Insights and Forecast - by Consumption Analysis
- 7.3. Market Analysis, Insights and Forecast - by Import Market Analysis (Value & Volume)
- 7.4. Market Analysis, Insights and Forecast - by Export Market Analysis (Value & Volume)
- 7.5. Market Analysis, Insights and Forecast - by Price Trend Analysis
- 7.1. Market Analysis, Insights and Forecast - by Production Analysis
- 8. Europe Insect Food Industry Analysis, Insights and Forecast, 2019-2031
- 8.1. Market Analysis, Insights and Forecast - by Production Analysis
- 8.2. Market Analysis, Insights and Forecast - by Consumption Analysis
- 8.3. Market Analysis, Insights and Forecast - by Import Market Analysis (Value & Volume)
- 8.4. Market Analysis, Insights and Forecast - by Export Market Analysis (Value & Volume)
- 8.5. Market Analysis, Insights and Forecast - by Price Trend Analysis
- 8.1. Market Analysis, Insights and Forecast - by Production Analysis
- 9. Middle East & Africa Insect Food Industry Analysis, Insights and Forecast, 2019-2031
- 9.1. Market Analysis, Insights and Forecast - by Production Analysis
- 9.2. Market Analysis, Insights and Forecast - by Consumption Analysis
- 9.3. Market Analysis, Insights and Forecast - by Import Market Analysis (Value & Volume)
- 9.4. Market Analysis, Insights and Forecast - by Export Market Analysis (Value & Volume)
- 9.5. Market Analysis, Insights and Forecast - by Price Trend Analysis
- 9.1. Market Analysis, Insights and Forecast - by Production Analysis
- 10. Asia Pacific Insect Food Industry Analysis, Insights and Forecast, 2019-2031
- 10.1. Market Analysis, Insights and Forecast - by Production Analysis
- 10.2. Market Analysis, Insights and Forecast - by Consumption Analysis
- 10.3. Market Analysis, Insights and Forecast - by Import Market Analysis (Value & Volume)
- 10.4. Market Analysis, Insights and Forecast - by Export Market Analysis (Value & Volume)
- 10.5. Market Analysis, Insights and Forecast - by Price Trend Analysis
- 10.1. Market Analysis, Insights and Forecast - by Production Analysis
- 11. North America Insect Food Industry Analysis, Insights and Forecast, 2019-2031
- 11.1. Market Analysis, Insights and Forecast - By Country/Sub-region
- 11.1.1 United States
- 11.1.2 Canada
- 11.1.3 Mexico
- 11.1.4 Rest of North America
- 12. Europe Insect Food Industry Analysis, Insights and Forecast, 2019-2031
- 12.1. Market Analysis, Insights and Forecast - By Country/Sub-region
- 12.1.1 Germany
- 12.1.2 United Kingdom
- 12.1.3 France
- 12.1.4 Russia
- 12.1.5 Poland
- 12.1.6 Rest of Europe
- 13. Asia Pacific Insect Food Industry Analysis, Insights and Forecast, 2019-2031
- 13.1. Market Analysis, Insights and Forecast - By Country/Sub-region
- 13.1.1 China
- 13.1.2 Japan
- 13.1.3 Thailand
- 13.1.4 Rest of Asia Pacific
- 14. South America Insect Food Industry Analysis, Insights and Forecast, 2019-2031
- 14.1. Market Analysis, Insights and Forecast - By Country/Sub-region
- 14.1.1 Brazil
- 14.1.2 Argentina
- 14.1.3 Rest of South America
- 15. Middle East Insect Food Industry Analysis, Insights and Forecast, 2019-2031
- 15.1. Market Analysis, Insights and Forecast - By Country/Sub-region
- 15.1.1.
- 16. South Africa Insect Food Industry Analysis, Insights and Forecast, 2019-2031
- 16.1. Market Analysis, Insights and Forecast - By Country/Sub-region
- 16.1.1. Rest of Middle East
- 17. Competitive Analysis
- 17.1. Global Market Share Analysis 2024
- 17.2. Company Profiles
- 17.2.1 Bugsy Bros
- 17.2.1.1. Overview
- 17.2.1.2. Products
- 17.2.1.3. SWOT Analysis
- 17.2.1.4. Recent Developments
- 17.2.1.5. Financials (Based on Availability)
- 17.2.2 Nordic Insect Economy Ltd
- 17.2.2.1. Overview
- 17.2.2.2. Products
- 17.2.2.3. SWOT Analysis
- 17.2.2.4. Recent Developments
- 17.2.2.5. Financials (Based on Availability)
- 17.2.3 Enviro Flight LLC
- 17.2.3.1. Overview
- 17.2.3.2. Products
- 17.2.3.3. SWOT Analysis
- 17.2.3.4. Recent Developments
- 17.2.3.5. Financials (Based on Availability)
- 17.2.4 Eat Grub Lt
- 17.2.4.1. Overview
- 17.2.4.2. Products
- 17.2.4.3. SWOT Analysis
- 17.2.4.4. Recent Developments
- 17.2.4.5. Financials (Based on Availability)
- 17.2.5 Thailand Unique
- 17.2.5.1. Overview
- 17.2.5.2. Products
- 17.2.5.3. SWOT Analysis
- 17.2.5.4. Recent Developments
- 17.2.5.5. Financials (Based on Availability)
- 17.2.6 Exo Inc
- 17.2.6.1. Overview
- 17.2.6.2. Products
- 17.2.6.3. SWOT Analysis
- 17.2.6.4. Recent Developments
- 17.2.6.5. Financials (Based on Availability)
- 17.2.7 Proti - Farm
- 17.2.7.1. Overview
- 17.2.7.2. Products
- 17.2.7.3. SWOT Analysis
- 17.2.7.4. Recent Developments
- 17.2.7.5. Financials (Based on Availability)
- 17.2.8 Entomo Farms Ltd
- 17.2.8.1. Overview
- 17.2.8.2. Products
- 17.2.8.3. SWOT Analysis
- 17.2.8.4. Recent Developments
- 17.2.8.5. Financials (Based on Availability)
- 17.2.9 Deli Bugs Ltd
- 17.2.9.1. Overview
- 17.2.9.2. Products
- 17.2.9.3. SWOT Analysis
- 17.2.9.4. Recent Developments
- 17.2.9.5. Financials (Based on Availability)
- 17.2.10 Kreca Ento - Feed BV
- 17.2.10.1. Overview
- 17.2.10.2. Products
- 17.2.10.3. SWOT Analysis
- 17.2.10.4. Recent Developments
- 17.2.10.5. Financials (Based on Availability)
- 17.2.1 Bugsy Bros
List of Figures
- Figure 1: Global Insect Food Industry Revenue Breakdown (Million, %) by Region 2024 & 2032
- Figure 2: North America Insect Food Industry Revenue (Million), by Country 2024 & 2032
- Figure 3: North America Insect Food Industry Revenue Share (%), by Country 2024 & 2032
- Figure 4: Europe Insect Food Industry Revenue (Million), by Country 2024 & 2032
- Figure 5: Europe Insect Food Industry Revenue Share (%), by Country 2024 & 2032
- Figure 6: Asia Pacific Insect Food Industry Revenue (Million), by Country 2024 & 2032
- Figure 7: Asia Pacific Insect Food Industry Revenue Share (%), by Country 2024 & 2032
- Figure 8: South America Insect Food Industry Revenue (Million), by Country 2024 & 2032
- Figure 9: South America Insect Food Industry Revenue Share (%), by Country 2024 & 2032
- Figure 10: Middle East Insect Food Industry Revenue (Million), by Country 2024 & 2032
- Figure 11: Middle East Insect Food Industry Revenue Share (%), by Country 2024 & 2032
- Figure 12: South Africa Insect Food Industry Revenue (Million), by Country 2024 & 2032
- Figure 13: South Africa Insect Food Industry Revenue Share (%), by Country 2024 & 2032
- Figure 14: North America Insect Food Industry Revenue (Million), by Production Analysis 2024 & 2032
- Figure 15: North America Insect Food Industry Revenue Share (%), by Production Analysis 2024 & 2032
- Figure 16: North America Insect Food Industry Revenue (Million), by Consumption Analysis 2024 & 2032
- Figure 17: North America Insect Food Industry Revenue Share (%), by Consumption Analysis 2024 & 2032
- Figure 18: North America Insect Food Industry Revenue (Million), by Import Market Analysis (Value & Volume) 2024 & 2032
- Figure 19: North America Insect Food Industry Revenue Share (%), by Import Market Analysis (Value & Volume) 2024 & 2032
- Figure 20: North America Insect Food Industry Revenue (Million), by Export Market Analysis (Value & Volume) 2024 & 2032
- Figure 21: North America Insect Food Industry Revenue Share (%), by Export Market Analysis (Value & Volume) 2024 & 2032
- Figure 22: North America Insect Food Industry Revenue (Million), by Price Trend Analysis 2024 & 2032
- Figure 23: North America Insect Food Industry Revenue Share (%), by Price Trend Analysis 2024 & 2032
- Figure 24: North America Insect Food Industry Revenue (Million), by Country 2024 & 2032
- Figure 25: North America Insect Food Industry Revenue Share (%), by Country 2024 & 2032
- Figure 26: South America Insect Food Industry Revenue (Million), by Production Analysis 2024 & 2032
- Figure 27: South America Insect Food Industry Revenue Share (%), by Production Analysis 2024 & 2032
- Figure 28: South America Insect Food Industry Revenue (Million), by Consumption Analysis 2024 & 2032
- Figure 29: South America Insect Food Industry Revenue Share (%), by Consumption Analysis 2024 & 2032
- Figure 30: South America Insect Food Industry Revenue (Million), by Import Market Analysis (Value & Volume) 2024 & 2032
- Figure 31: South America Insect Food Industry Revenue Share (%), by Import Market Analysis (Value & Volume) 2024 & 2032
- Figure 32: South America Insect Food Industry Revenue (Million), by Export Market Analysis (Value & Volume) 2024 & 2032
- Figure 33: South America Insect Food Industry Revenue Share (%), by Export Market Analysis (Value & Volume) 2024 & 2032
- Figure 34: South America Insect Food Industry Revenue (Million), by Price Trend Analysis 2024 & 2032
- Figure 35: South America Insect Food Industry Revenue Share (%), by Price Trend Analysis 2024 & 2032
- Figure 36: South America Insect Food Industry Revenue (Million), by Country 2024 & 2032
- Figure 37: South America Insect Food Industry Revenue Share (%), by Country 2024 & 2032
- Figure 38: Europe Insect Food Industry Revenue (Million), by Production Analysis 2024 & 2032
- Figure 39: Europe Insect Food Industry Revenue Share (%), by Production Analysis 2024 & 2032
- Figure 40: Europe Insect Food Industry Revenue (Million), by Consumption Analysis 2024 & 2032
- Figure 41: Europe Insect Food Industry Revenue Share (%), by Consumption Analysis 2024 & 2032
- Figure 42: Europe Insect Food Industry Revenue (Million), by Import Market Analysis (Value & Volume) 2024 & 2032
- Figure 43: Europe Insect Food Industry Revenue Share (%), by Import Market Analysis (Value & Volume) 2024 & 2032
- Figure 44: Europe Insect Food Industry Revenue (Million), by Export Market Analysis (Value & Volume) 2024 & 2032
- Figure 45: Europe Insect Food Industry Revenue Share (%), by Export Market Analysis (Value & Volume) 2024 & 2032
- Figure 46: Europe Insect Food Industry Revenue (Million), by Price Trend Analysis 2024 & 2032
- Figure 47: Europe Insect Food Industry Revenue Share (%), by Price Trend Analysis 2024 & 2032
- Figure 48: Europe Insect Food Industry Revenue (Million), by Country 2024 & 2032
- Figure 49: Europe Insect Food Industry Revenue Share (%), by Country 2024 & 2032
- Figure 50: Middle East & Africa Insect Food Industry Revenue (Million), by Production Analysis 2024 & 2032
- Figure 51: Middle East & Africa Insect Food Industry Revenue Share (%), by Production Analysis 2024 & 2032
- Figure 52: Middle East & Africa Insect Food Industry Revenue (Million), by Consumption Analysis 2024 & 2032
- Figure 53: Middle East & Africa Insect Food Industry Revenue Share (%), by Consumption Analysis 2024 & 2032
- Figure 54: Middle East & Africa Insect Food Industry Revenue (Million), by Import Market Analysis (Value & Volume) 2024 & 2032
- Figure 55: Middle East & Africa Insect Food Industry Revenue Share (%), by Import Market Analysis (Value & Volume) 2024 & 2032
- Figure 56: Middle East & Africa Insect Food Industry Revenue (Million), by Export Market Analysis (Value & Volume) 2024 & 2032
- Figure 57: Middle East & Africa Insect Food Industry Revenue Share (%), by Export Market Analysis (Value & Volume) 2024 & 2032
- Figure 58: Middle East & Africa Insect Food Industry Revenue (Million), by Price Trend Analysis 2024 & 2032
- Figure 59: Middle East & Africa Insect Food Industry Revenue Share (%), by Price Trend Analysis 2024 & 2032
- Figure 60: Middle East & Africa Insect Food Industry Revenue (Million), by Country 2024 & 2032
- Figure 61: Middle East & Africa Insect Food Industry Revenue Share (%), by Country 2024 & 2032
- Figure 62: Asia Pacific Insect Food Industry Revenue (Million), by Production Analysis 2024 & 2032
- Figure 63: Asia Pacific Insect Food Industry Revenue Share (%), by Production Analysis 2024 & 2032
- Figure 64: Asia Pacific Insect Food Industry Revenue (Million), by Consumption Analysis 2024 & 2032
- Figure 65: Asia Pacific Insect Food Industry Revenue Share (%), by Consumption Analysis 2024 & 2032
- Figure 66: Asia Pacific Insect Food Industry Revenue (Million), by Import Market Analysis (Value & Volume) 2024 & 2032
- Figure 67: Asia Pacific Insect Food Industry Revenue Share (%), by Import Market Analysis (Value & Volume) 2024 & 2032
- Figure 68: Asia Pacific Insect Food Industry Revenue (Million), by Export Market Analysis (Value & Volume) 2024 & 2032
- Figure 69: Asia Pacific Insect Food Industry Revenue Share (%), by Export Market Analysis (Value & Volume) 2024 & 2032
- Figure 70: Asia Pacific Insect Food Industry Revenue (Million), by Price Trend Analysis 2024 & 2032
- Figure 71: Asia Pacific Insect Food Industry Revenue Share (%), by Price Trend Analysis 2024 & 2032
- Figure 72: Asia Pacific Insect Food Industry Revenue (Million), by Country 2024 & 2032
- Figure 73: Asia Pacific Insect Food Industry Revenue Share (%), by Country 2024 & 2032
List of Tables
- Table 1: Global Insect Food Industry Revenue Million Forecast, by Region 2019 & 2032
- Table 2: Global Insect Food Industry Revenue Million Forecast, by Production Analysis 2019 & 2032
- Table 3: Global Insect Food Industry Revenue Million Forecast, by Consumption Analysis 2019 & 2032
- Table 4: Global Insect Food Industry Revenue Million Forecast, by Import Market Analysis (Value & Volume) 2019 & 2032
- Table 5: Global Insect Food Industry Revenue Million Forecast, by Export Market Analysis (Value & Volume) 2019 & 2032
- Table 6: Global Insect Food Industry Revenue Million Forecast, by Price Trend Analysis 2019 & 2032
- Table 7: Global Insect Food Industry Revenue Million Forecast, by Region 2019 & 2032
- Table 8: Global Insect Food Industry Revenue Million Forecast, by Country 2019 & 2032
- Table 9: United States Insect Food Industry Revenue (Million) Forecast, by Application 2019 & 2032
- Table 10: Canada Insect Food Industry Revenue (Million) Forecast, by Application 2019 & 2032
- Table 11: Mexico Insect Food Industry Revenue (Million) Forecast, by Application 2019 & 2032
- Table 12: Rest of North America Insect Food Industry Revenue (Million) Forecast, by Application 2019 & 2032
- Table 13: Global Insect Food Industry Revenue Million Forecast, by Country 2019 & 2032
- Table 14: Germany Insect Food Industry Revenue (Million) Forecast, by Application 2019 & 2032
- Table 15: United Kingdom Insect Food Industry Revenue (Million) Forecast, by Application 2019 & 2032
- Table 16: France Insect Food Industry Revenue (Million) Forecast, by Application 2019 & 2032
- Table 17: Russia Insect Food Industry Revenue (Million) Forecast, by Application 2019 & 2032
- Table 18: Poland Insect Food Industry Revenue (Million) Forecast, by Application 2019 & 2032
- Table 19: Rest of Europe Insect Food Industry Revenue (Million) Forecast, by Application 2019 & 2032
- Table 20: Global Insect Food Industry Revenue Million Forecast, by Country 2019 & 2032
- Table 21: China Insect Food Industry Revenue (Million) Forecast, by Application 2019 & 2032
- Table 22: Japan Insect Food Industry Revenue (Million) Forecast, by Application 2019 & 2032
- Table 23: Thailand Insect Food Industry Revenue (Million) Forecast, by Application 2019 & 2032
- Table 24: Rest of Asia Pacific Insect Food Industry Revenue (Million) Forecast, by Application 2019 & 2032
- Table 25: Global Insect Food Industry Revenue Million Forecast, by Country 2019 & 2032
- Table 26: Brazil Insect Food Industry Revenue (Million) Forecast, by Application 2019 & 2032
- Table 27: Argentina Insect Food Industry Revenue (Million) Forecast, by Application 2019 & 2032
- Table 28: Rest of South America Insect Food Industry Revenue (Million) Forecast, by Application 2019 & 2032
- Table 29: Global Insect Food Industry Revenue Million Forecast, by Country 2019 & 2032
- Table 30: Insect Food Industry Revenue (Million) Forecast, by Application 2019 & 2032
- Table 31: Global Insect Food Industry Revenue Million Forecast, by Country 2019 & 2032
- Table 32: Rest of Middle East Insect Food Industry Revenue (Million) Forecast, by Application 2019 & 2032
- Table 33: Global Insect Food Industry Revenue Million Forecast, by Production Analysis 2019 & 2032
- Table 34: Global Insect Food Industry Revenue Million Forecast, by Consumption Analysis 2019 & 2032
- Table 35: Global Insect Food Industry Revenue Million Forecast, by Import Market Analysis (Value & Volume) 2019 & 2032
- Table 36: Global Insect Food Industry Revenue Million Forecast, by Export Market Analysis (Value & Volume) 2019 & 2032
- Table 37: Global Insect Food Industry Revenue Million Forecast, by Price Trend Analysis 2019 & 2032
- Table 38: Global Insect Food Industry Revenue Million Forecast, by Country 2019 & 2032
- Table 39: United States Insect Food Industry Revenue (Million) Forecast, by Application 2019 & 2032
- Table 40: Canada Insect Food Industry Revenue (Million) Forecast, by Application 2019 & 2032
- Table 41: Mexico Insect Food Industry Revenue (Million) Forecast, by Application 2019 & 2032
- Table 42: Global Insect Food Industry Revenue Million Forecast, by Production Analysis 2019 & 2032
- Table 43: Global Insect Food Industry Revenue Million Forecast, by Consumption Analysis 2019 & 2032
- Table 44: Global Insect Food Industry Revenue Million Forecast, by Import Market Analysis (Value & Volume) 2019 & 2032
- Table 45: Global Insect Food Industry Revenue Million Forecast, by Export Market Analysis (Value & Volume) 2019 & 2032
- Table 46: Global Insect Food Industry Revenue Million Forecast, by Price Trend Analysis 2019 & 2032
- Table 47: Global Insect Food Industry Revenue Million Forecast, by Country 2019 & 2032
- Table 48: Brazil Insect Food Industry Revenue (Million) Forecast, by Application 2019 & 2032
- Table 49: Argentina Insect Food Industry Revenue (Million) Forecast, by Application 2019 & 2032
- Table 50: Rest of South America Insect Food Industry Revenue (Million) Forecast, by Application 2019 & 2032
- Table 51: Global Insect Food Industry Revenue Million Forecast, by Production Analysis 2019 & 2032
- Table 52: Global Insect Food Industry Revenue Million Forecast, by Consumption Analysis 2019 & 2032
- Table 53: Global Insect Food Industry Revenue Million Forecast, by Import Market Analysis (Value & Volume) 2019 & 2032
- Table 54: Global Insect Food Industry Revenue Million Forecast, by Export Market Analysis (Value & Volume) 2019 & 2032
- Table 55: Global Insect Food Industry Revenue Million Forecast, by Price Trend Analysis 2019 & 2032
- Table 56: Global Insect Food Industry Revenue Million Forecast, by Country 2019 & 2032
- Table 57: United Kingdom Insect Food Industry Revenue (Million) Forecast, by Application 2019 & 2032
- Table 58: Germany Insect Food Industry Revenue (Million) Forecast, by Application 2019 & 2032
- Table 59: France Insect Food Industry Revenue (Million) Forecast, by Application 2019 & 2032
- Table 60: Italy Insect Food Industry Revenue (Million) Forecast, by Application 2019 & 2032
- Table 61: Spain Insect Food Industry Revenue (Million) Forecast, by Application 2019 & 2032
- Table 62: Russia Insect Food Industry Revenue (Million) Forecast, by Application 2019 & 2032
- Table 63: Benelux Insect Food Industry Revenue (Million) Forecast, by Application 2019 & 2032
- Table 64: Nordics Insect Food Industry Revenue (Million) Forecast, by Application 2019 & 2032
- Table 65: Rest of Europe Insect Food Industry Revenue (Million) Forecast, by Application 2019 & 2032
- Table 66: Global Insect Food Industry Revenue Million Forecast, by Production Analysis 2019 & 2032
- Table 67: Global Insect Food Industry Revenue Million Forecast, by Consumption Analysis 2019 & 2032
- Table 68: Global Insect Food Industry Revenue Million Forecast, by Import Market Analysis (Value & Volume) 2019 & 2032
- Table 69: Global Insect Food Industry Revenue Million Forecast, by Export Market Analysis (Value & Volume) 2019 & 2032
- Table 70: Global Insect Food Industry Revenue Million Forecast, by Price Trend Analysis 2019 & 2032
- Table 71: Global Insect Food Industry Revenue Million Forecast, by Country 2019 & 2032
- Table 72: Turkey Insect Food Industry Revenue (Million) Forecast, by Application 2019 & 2032
- Table 73: Israel Insect Food Industry Revenue (Million) Forecast, by Application 2019 & 2032
- Table 74: GCC Insect Food Industry Revenue (Million) Forecast, by Application 2019 & 2032
- Table 75: North Africa Insect Food Industry Revenue (Million) Forecast, by Application 2019 & 2032
- Table 76: South Africa Insect Food Industry Revenue (Million) Forecast, by Application 2019 & 2032
- Table 77: Rest of Middle East & Africa Insect Food Industry Revenue (Million) Forecast, by Application 2019 & 2032
- Table 78: Global Insect Food Industry Revenue Million Forecast, by Production Analysis 2019 & 2032
- Table 79: Global Insect Food Industry Revenue Million Forecast, by Consumption Analysis 2019 & 2032
- Table 80: Global Insect Food Industry Revenue Million Forecast, by Import Market Analysis (Value & Volume) 2019 & 2032
- Table 81: Global Insect Food Industry Revenue Million Forecast, by Export Market Analysis (Value & Volume) 2019 & 2032
- Table 82: Global Insect Food Industry Revenue Million Forecast, by Price Trend Analysis 2019 & 2032
- Table 83: Global Insect Food Industry Revenue Million Forecast, by Country 2019 & 2032
- Table 84: China Insect Food Industry Revenue (Million) Forecast, by Application 2019 & 2032
- Table 85: India Insect Food Industry Revenue (Million) Forecast, by Application 2019 & 2032
- Table 86: Japan Insect Food Industry Revenue (Million) Forecast, by Application 2019 & 2032
- Table 87: South Korea Insect Food Industry Revenue (Million) Forecast, by Application 2019 & 2032
- Table 88: ASEAN Insect Food Industry Revenue (Million) Forecast, by Application 2019 & 2032
- Table 89: Oceania Insect Food Industry Revenue (Million) Forecast, by Application 2019 & 2032
- Table 90: Rest of Asia Pacific Insect Food Industry Revenue (Million) Forecast, by Application 2019 & 2032
Frequently Asked Questions
1. What is the projected Compound Annual Growth Rate (CAGR) of the Insect Food Industry?
The projected CAGR is approximately 18.89%.
2. Which companies are prominent players in the Insect Food Industry?
Key companies in the market include Bugsy Bros, Nordic Insect Economy Ltd, Enviro Flight LLC, Eat Grub Lt, Thailand Unique, Exo Inc, Proti - Farm, Entomo Farms Ltd, Deli Bugs Ltd, Kreca Ento - Feed BV.
3. What are the main segments of the Insect Food Industry?
The market segments include Production Analysis, Consumption Analysis, Import Market Analysis (Value & Volume), Export Market Analysis (Value & Volume), Price Trend Analysis.
4. Can you provide details about the market size?
The market size is estimated to be USD 3.80 Million as of 2022.
5. What are some drivers contributing to market growth?
Decreasing Per Capita Arable Land; Increased Demand for Food.
6. What are the notable trends driving market growth?
Easy Availability and High Protein Content in The Edible Insects.
7. Are there any restraints impacting market growth?
High Initial Investments; Requirement of Precision Agriculture.
8. Can you provide examples of recent developments in the market?
September 2022: Lotte Confectionery, a leading South Korean snack and ice cream maker, signed a memorandum of understanding (MOU) with Aspire Food Group, a Canadian firm renowned for its advanced insect agriculture and food technology, to cooperate in areas of protein alternatives and edible insects.
9. What pricing options are available for accessing the report?
Pricing options include single-user, multi-user, and enterprise licenses priced at USD 4750, USD 5250, and USD 8750 respectively.
10. Is the market size provided in terms of value or volume?
The market size is provided in terms of value, measured in Million.
11. Are there any specific market keywords associated with the report?
Yes, the market keyword associated with the report is "Insect Food Industry," which aids in identifying and referencing the specific market segment covered.
12. How do I determine which pricing option suits my needs best?
The pricing options vary based on user requirements and access needs. Individual users may opt for single-user licenses, while businesses requiring broader access may choose multi-user or enterprise licenses for cost-effective access to the report.
13. Are there any additional resources or data provided in the Insect Food Industry report?
While the report offers comprehensive insights, it's advisable to review the specific contents or supplementary materials provided to ascertain if additional resources or data are available.
14. How can I stay updated on further developments or reports in the Insect Food Industry?
To stay informed about further developments, trends, and reports in the Insect Food Industry, consider subscribing to industry newsletters, following relevant companies and organizations, or regularly checking reputable industry news sources and publications.
Methodology
Step 1 - Identification of Relevant Samples Size from Population Database


Step 2 - Approaches for Defining Global Market Size (Value, Volume* & Price*)

Note*: In applicable scenarios
Step 3 - Data Sources
Primary Research
- Web Analytics
- Survey Reports
- Research Institute
- Latest Research Reports
- Opinion Leaders
Secondary Research
- Annual Reports
- White Paper
- Latest Press Release
- Industry Association
- Paid Database
- Investor Presentations

Step 4 - Data Triangulation
Involves using different sources of information in order to increase the validity of a study
These sources are likely to be stakeholders in a program - participants, other researchers, program staff, other community members, and so on.
Then we put all data in single framework & apply various statistical tools to find out the dynamic on the market.
During the analysis stage, feedback from the stakeholder groups would be compared to determine areas of agreement as well as areas of divergence


