
Key Insights
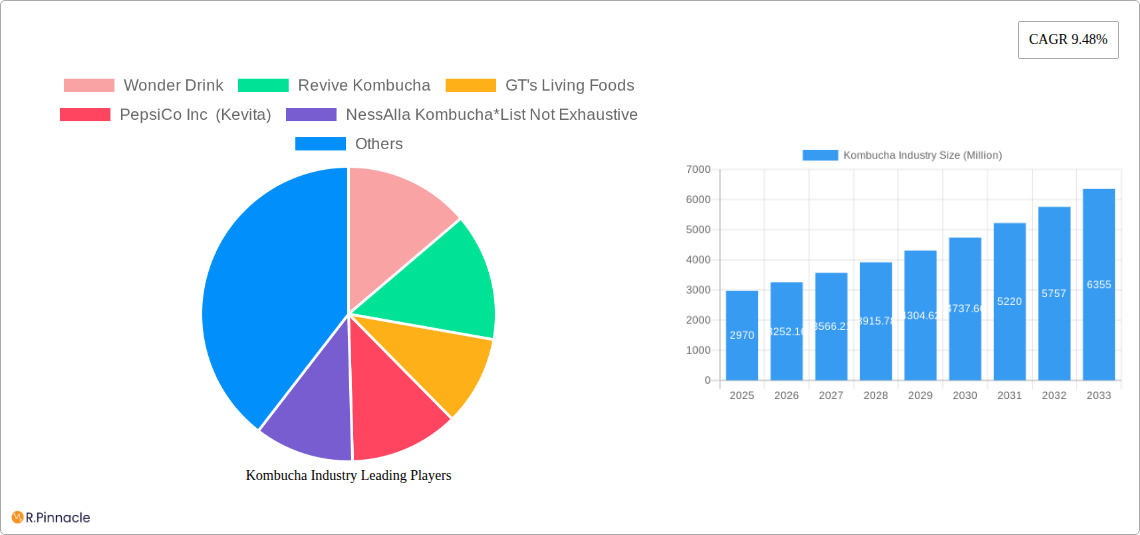
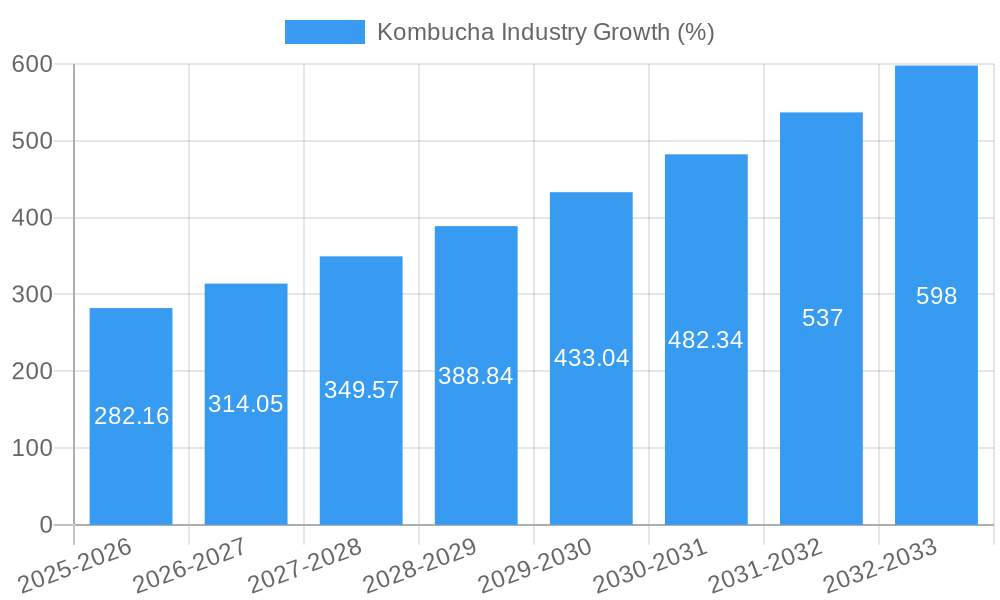
The global kombucha market, valued at $2.97 billion in 2025, is experiencing robust growth, projected to expand at a compound annual growth rate (CAGR) of 9.48% from 2025 to 2033. This expansion is driven by increasing consumer awareness of health and wellness, a rising preference for functional beverages with probiotic benefits, and the growing popularity of fermented foods and drinks. The demand for healthier alternatives to sugary sodas and juices fuels this market, particularly among millennials and Gen Z consumers who are actively seeking out natural and organic products. Furthermore, innovation within the industry, encompassing new flavors, convenient packaging formats, and the expansion into various distribution channels, significantly contributes to market growth. The increasing availability of kombucha in supermarkets, convenience stores, and online retailers enhances accessibility for consumers.
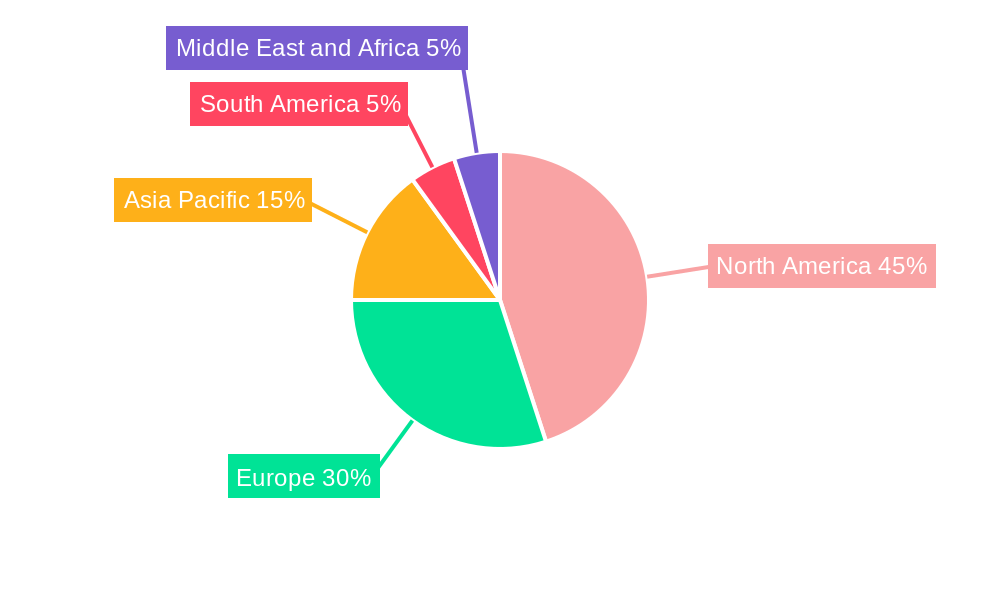
Segment-wise, the flavored kombucha segment commands a significant market share due to its diverse taste profiles appealing to a broader consumer base. Online retailers are witnessing rapid growth as a distribution channel, facilitating increased market penetration and customer reach. While North America currently holds the largest market share, regions like Asia-Pacific are exhibiting considerable growth potential driven by increasing disposable incomes and changing consumer preferences. However, challenges such as the relatively higher price point compared to traditional soft drinks and potential concerns regarding sugar content pose some restraints to market growth. Nonetheless, the overall outlook for the kombucha market remains positive, with significant opportunities for both established players and new entrants. Strategic partnerships, product diversification, and targeted marketing campaigns are key strategies for success within this competitive yet rapidly expanding market.
Kombucha Industry Market Report: 2019-2033
This comprehensive report provides an in-depth analysis of the global Kombucha industry, offering invaluable insights for industry professionals, investors, and stakeholders. With a study period spanning 2019-2033, a base year of 2025, and a forecast period of 2025-2033, this report presents a detailed overview of market dynamics, trends, and future projections. The global Kombucha market is expected to reach xx Million by 2033, exhibiting a robust CAGR of xx% during the forecast period.
Kombucha Industry Market Structure & Innovation Trends
The Kombucha market exhibits a moderately concentrated structure, with key players like Wonder Drink, Revive Kombucha, GT's Living Foods, PepsiCo Inc (Kevita), NessAlla Kombucha, Brew Dr Kombucha, Makana Beverages Inc, Hain Celestial, Humm Kombucha LLC, and Health-Ade commanding significant market share. However, the presence of numerous smaller players indicates a dynamic and competitive landscape. Innovation is driven by consumer demand for novel flavors, functional benefits (probiotics, antioxidants), and convenient formats. Regulatory frameworks vary across regions, impacting production and labeling requirements. The emergence of "instant kombucha" and kombucha-based mixers signify significant product innovation. Mergers and acquisitions (M&A) activity has been moderate, with deal values averaging xx Million in recent years. Key M&A activities include [Insert specific M&A examples if available, otherwise, state "Specific M&A details unavailable"]. Market share data for leading players is detailed in the full report.
Kombucha Industry Market Dynamics & Trends
The Kombucha market is experiencing significant growth, fueled by rising consumer awareness of health and wellness, increasing demand for functional beverages, and the growing popularity of fermented products. Technological advancements in production and packaging are enhancing efficiency and product quality. Consumer preferences are shifting towards organic, low-sugar, and unique flavor profiles. The competitive landscape is characterized by intense rivalry among established players and emerging brands, driving innovation and price competition. Market penetration is highest in developed countries, but significant growth potential exists in emerging markets. The report provides a detailed analysis of these factors, including specific CAGR figures and market penetration rates by region and segment.
Dominant Regions & Segments in Kombucha Industry
The North American market currently holds the dominant position in global Kombucha consumption, driven by high consumer disposable income, increased awareness of health benefits, and extensive distribution channels. Within the segments:
- By Type: Flavored Kombucha holds the largest market share, exceeding Original/Regular kombucha due to its appeal to a wider consumer base seeking diverse taste experiences.
- By Distribution Channel: Supermarkets/Hypermarkets represent the largest distribution channel, attributed to their extensive reach and consumer familiarity. However, online retailers are experiencing the highest growth rate, driven by the expanding e-commerce market and consumer convenience.
Key drivers for regional dominance include strong economic performance, well-developed retail infrastructure, and favorable regulatory environments. The detailed analysis of each region and segment in the report presents the specific market size, CAGR, and market share.
Kombucha Industry Product Innovations
Recent product innovations include the launch of novel flavors (e.g., Brew Dr.'s Just Peachy), the introduction of convenient formats like "instant kombucha," and the expansion into new product categories such as kombucha-based cocktail mixers (Health-Ade Mixers). These innovations leverage technological advancements in fermentation processes and packaging to cater to evolving consumer preferences and expand market reach. The focus is on delivering enhanced taste experiences, functional benefits, and convenient consumption options.
Report Scope & Segmentation Analysis
This report segments the Kombucha market by:
- Type: Original/Regular, Flavored. The Flavored segment exhibits higher growth projections due to consumer demand for diverse taste profiles.
- Distribution Channel: Supermarkets/Hypermarkets, Specialist Stores, Convenience Stores, Online Retailers, Other Distribution Channels. The online retail segment is expected to show the most significant growth over the forecast period.
Each segment's growth projections, market sizes, and competitive dynamics are detailed in the full report.
Key Drivers of Kombucha Industry Growth
The Kombucha industry's growth is driven by several key factors: the rising health and wellness trend, increased consumer awareness of probiotics and antioxidants, the growing popularity of functional beverages, and the development of innovative product formats and flavors. Government support for the food and beverage industry in several countries and technological advancements in production methods also contribute to market growth.
Challenges in the Kombucha Industry Sector
Challenges include intense competition, fluctuating raw material prices, stringent regulatory requirements regarding labeling and production standards, and potential supply chain disruptions. These factors can influence production costs and market accessibility, impacting overall profitability.
Emerging Opportunities in Kombucha Industry
Emerging opportunities include expanding into new geographic markets (particularly in developing countries), developing innovative product formats (e.g., ready-to-drink cocktails, infused waters), and focusing on premium and organic products to cater to growing consumer demand for high-quality, health-conscious beverages. Exploring new flavor profiles and functional benefits, and leveraging digital marketing strategies will also create opportunities.
Leading Players in the Kombucha Industry Market
- Wonder Drink
- Revive Kombucha
- GT's Living Foods
- PepsiCo Inc (Kevita)
- NessAlla Kombucha
- Brew Dr Kombucha
- Makana Beverages Inc
- Hain Celestial
- Humm Kombucha LLC
- Health-Ade
Key Developments in Kombucha Industry
- February 2022: Brew Dr. launched Just Peachy, a peach-flavored kombucha.
- February 2022: Superfoods Company launched an "instant kombucha" formula.
- March 2021: Health-Ade Kombucha launched Health-Ade Mixers, a line of kombucha-based cocktail bases.
Future Outlook for Kombucha Industry Market
The Kombucha market is poised for sustained growth driven by increasing consumer demand for healthy and functional beverages. Strategic opportunities lie in product innovation, expansion into new markets, and the adoption of sustainable practices. The market's future potential is significant, with continued growth expected across various segments and regions.
Kombucha Industry Segmentation
-
1. Type
- 1.1. Original/Regular
- 1.2. Flavored
-
2. Distribution Channel
- 2.1. Supermarkets/Hypermarkets
- 2.2. Specialist Stores
- 2.3. Convenience Stores
- 2.4. Online Retailers
- 2.5. Other Distribution Channel
Kombucha Industry Segmentation By Geography
-
1. North America
- 1.1. United States
- 1.2. Canada
- 1.3. Mexico
- 1.4. Rest of North America
-
2. Europe
- 2.1. Spain
- 2.2. United Kingdom
- 2.3. Germany
- 2.4. France
- 2.5. Italy
- 2.6. Russia
- 2.7. Rest of Europe
-
3. Asia Pacific
- 3.1. China
- 3.2. Japan
- 3.3. India
- 3.4. Australia
- 3.5. Rest of Asia Pacific
-
4. South America
- 4.1. Brazil
- 4.2. Argentina
- 4.3. Rest of South America
-
5. Middle East and Africa
- 5.1. South Africa
- 5.2. Saudi Arabia
- 5.3. Rest of Middle East and Africa
Kombucha Industry REPORT HIGHLIGHTS
| Aspects | Details |
|---|---|
| Study Period | 2019-2033 |
| Base Year | 2024 |
| Estimated Year | 2025 |
| Forecast Period | 2025-2033 |
| Historical Period | 2019-2024 |
| Growth Rate | CAGR of 9.48% from 2019-2033 |
| Segmentation |
|
Table of Contents
- 1. Introduction
- 1.1. Research Scope
- 1.2. Market Segmentation
- 1.3. Research Methodology
- 1.4. Definitions and Assumptions
- 2. Executive Summary
- 2.1. Introduction
- 3. Market Dynamics
- 3.1. Introduction
- 3.2. Market Drivers
- 3.2.1. Increasing application of Gelatin in healthcare and pharmaceutical sector
- 3.3. Market Restrains
- 3.3.1. Rising demand for clean label products
- 3.4. Market Trends
- 3.4.1. Rising Health Awareness Among Consumers
- 4. Market Factor Analysis
- 4.1. Porters Five Forces
- 4.2. Supply/Value Chain
- 4.3. PESTEL analysis
- 4.4. Market Entropy
- 4.5. Patent/Trademark Analysis
- 5. Global Kombucha Industry Analysis, Insights and Forecast, 2019-2031
- 5.1. Market Analysis, Insights and Forecast - by Type
- 5.1.1. Original/Regular
- 5.1.2. Flavored
- 5.2. Market Analysis, Insights and Forecast - by Distribution Channel
- 5.2.1. Supermarkets/Hypermarkets
- 5.2.2. Specialist Stores
- 5.2.3. Convenience Stores
- 5.2.4. Online Retailers
- 5.2.5. Other Distribution Channel
- 5.3. Market Analysis, Insights and Forecast - by Region
- 5.3.1. North America
- 5.3.2. Europe
- 5.3.3. Asia Pacific
- 5.3.4. South America
- 5.3.5. Middle East and Africa
- 5.1. Market Analysis, Insights and Forecast - by Type
- 6. North America Kombucha Industry Analysis, Insights and Forecast, 2019-2031
- 6.1. Market Analysis, Insights and Forecast - by Type
- 6.1.1. Original/Regular
- 6.1.2. Flavored
- 6.2. Market Analysis, Insights and Forecast - by Distribution Channel
- 6.2.1. Supermarkets/Hypermarkets
- 6.2.2. Specialist Stores
- 6.2.3. Convenience Stores
- 6.2.4. Online Retailers
- 6.2.5. Other Distribution Channel
- 6.1. Market Analysis, Insights and Forecast - by Type
- 7. Europe Kombucha Industry Analysis, Insights and Forecast, 2019-2031
- 7.1. Market Analysis, Insights and Forecast - by Type
- 7.1.1. Original/Regular
- 7.1.2. Flavored
- 7.2. Market Analysis, Insights and Forecast - by Distribution Channel
- 7.2.1. Supermarkets/Hypermarkets
- 7.2.2. Specialist Stores
- 7.2.3. Convenience Stores
- 7.2.4. Online Retailers
- 7.2.5. Other Distribution Channel
- 7.1. Market Analysis, Insights and Forecast - by Type
- 8. Asia Pacific Kombucha Industry Analysis, Insights and Forecast, 2019-2031
- 8.1. Market Analysis, Insights and Forecast - by Type
- 8.1.1. Original/Regular
- 8.1.2. Flavored
- 8.2. Market Analysis, Insights and Forecast - by Distribution Channel
- 8.2.1. Supermarkets/Hypermarkets
- 8.2.2. Specialist Stores
- 8.2.3. Convenience Stores
- 8.2.4. Online Retailers
- 8.2.5. Other Distribution Channel
- 8.1. Market Analysis, Insights and Forecast - by Type
- 9. South America Kombucha Industry Analysis, Insights and Forecast, 2019-2031
- 9.1. Market Analysis, Insights and Forecast - by Type
- 9.1.1. Original/Regular
- 9.1.2. Flavored
- 9.2. Market Analysis, Insights and Forecast - by Distribution Channel
- 9.2.1. Supermarkets/Hypermarkets
- 9.2.2. Specialist Stores
- 9.2.3. Convenience Stores
- 9.2.4. Online Retailers
- 9.2.5. Other Distribution Channel
- 9.1. Market Analysis, Insights and Forecast - by Type
- 10. Middle East and Africa Kombucha Industry Analysis, Insights and Forecast, 2019-2031
- 10.1. Market Analysis, Insights and Forecast - by Type
- 10.1.1. Original/Regular
- 10.1.2. Flavored
- 10.2. Market Analysis, Insights and Forecast - by Distribution Channel
- 10.2.1. Supermarkets/Hypermarkets
- 10.2.2. Specialist Stores
- 10.2.3. Convenience Stores
- 10.2.4. Online Retailers
- 10.2.5. Other Distribution Channel
- 10.1. Market Analysis, Insights and Forecast - by Type
- 11. North America Kombucha Industry Analysis, Insights and Forecast, 2019-2031
- 11.1. Market Analysis, Insights and Forecast - By Country/Sub-region
- 11.1.1 United States
- 11.1.2 Canada
- 11.1.3 Mexico
- 11.1.4 Rest of North America
- 12. Europe Kombucha Industry Analysis, Insights and Forecast, 2019-2031
- 12.1. Market Analysis, Insights and Forecast - By Country/Sub-region
- 12.1.1 Spain
- 12.1.2 United Kingdom
- 12.1.3 Germany
- 12.1.4 France
- 12.1.5 Italy
- 12.1.6 Russia
- 12.1.7 Rest of Europe
- 13. Asia Pacific Kombucha Industry Analysis, Insights and Forecast, 2019-2031
- 13.1. Market Analysis, Insights and Forecast - By Country/Sub-region
- 13.1.1 China
- 13.1.2 Japan
- 13.1.3 India
- 13.1.4 Australia
- 13.1.5 Rest of Asia Pacific
- 14. South America Kombucha Industry Analysis, Insights and Forecast, 2019-2031
- 14.1. Market Analysis, Insights and Forecast - By Country/Sub-region
- 14.1.1 Brazil
- 14.1.2 Argentina
- 14.1.3 Rest of South America
- 15. Middle East and Africa Kombucha Industry Analysis, Insights and Forecast, 2019-2031
- 15.1. Market Analysis, Insights and Forecast - By Country/Sub-region
- 15.1.1 South Africa
- 15.1.2 Saudi Arabia
- 15.1.3 Rest of Middle East and Africa
- 16. Competitive Analysis
- 16.1. Global Market Share Analysis 2024
- 16.2. Company Profiles
- 16.2.1 Wonder Drink
- 16.2.1.1. Overview
- 16.2.1.2. Products
- 16.2.1.3. SWOT Analysis
- 16.2.1.4. Recent Developments
- 16.2.1.5. Financials (Based on Availability)
- 16.2.2 Revive Kombucha
- 16.2.2.1. Overview
- 16.2.2.2. Products
- 16.2.2.3. SWOT Analysis
- 16.2.2.4. Recent Developments
- 16.2.2.5. Financials (Based on Availability)
- 16.2.3 GT's Living Foods
- 16.2.3.1. Overview
- 16.2.3.2. Products
- 16.2.3.3. SWOT Analysis
- 16.2.3.4. Recent Developments
- 16.2.3.5. Financials (Based on Availability)
- 16.2.4 PepsiCo Inc (Kevita)
- 16.2.4.1. Overview
- 16.2.4.2. Products
- 16.2.4.3. SWOT Analysis
- 16.2.4.4. Recent Developments
- 16.2.4.5. Financials (Based on Availability)
- 16.2.5 NessAlla Kombucha*List Not Exhaustive
- 16.2.5.1. Overview
- 16.2.5.2. Products
- 16.2.5.3. SWOT Analysis
- 16.2.5.4. Recent Developments
- 16.2.5.5. Financials (Based on Availability)
- 16.2.6 Brew Dr Kombucha
- 16.2.6.1. Overview
- 16.2.6.2. Products
- 16.2.6.3. SWOT Analysis
- 16.2.6.4. Recent Developments
- 16.2.6.5. Financials (Based on Availability)
- 16.2.7 Makana Beverages Inc
- 16.2.7.1. Overview
- 16.2.7.2. Products
- 16.2.7.3. SWOT Analysis
- 16.2.7.4. Recent Developments
- 16.2.7.5. Financials (Based on Availability)
- 16.2.8 Hain Celestial
- 16.2.8.1. Overview
- 16.2.8.2. Products
- 16.2.8.3. SWOT Analysis
- 16.2.8.4. Recent Developments
- 16.2.8.5. Financials (Based on Availability)
- 16.2.9 Humm Kombucha LLC
- 16.2.9.1. Overview
- 16.2.9.2. Products
- 16.2.9.3. SWOT Analysis
- 16.2.9.4. Recent Developments
- 16.2.9.5. Financials (Based on Availability)
- 16.2.10 Health-Ade
- 16.2.10.1. Overview
- 16.2.10.2. Products
- 16.2.10.3. SWOT Analysis
- 16.2.10.4. Recent Developments
- 16.2.10.5. Financials (Based on Availability)
- 16.2.1 Wonder Drink
List of Figures
- Figure 1: Global Kombucha Industry Revenue Breakdown (Million, %) by Region 2024 & 2032
- Figure 2: North America Kombucha Industry Revenue (Million), by Country 2024 & 2032
- Figure 3: North America Kombucha Industry Revenue Share (%), by Country 2024 & 2032
- Figure 4: Europe Kombucha Industry Revenue (Million), by Country 2024 & 2032
- Figure 5: Europe Kombucha Industry Revenue Share (%), by Country 2024 & 2032
- Figure 6: Asia Pacific Kombucha Industry Revenue (Million), by Country 2024 & 2032
- Figure 7: Asia Pacific Kombucha Industry Revenue Share (%), by Country 2024 & 2032
- Figure 8: South America Kombucha Industry Revenue (Million), by Country 2024 & 2032
- Figure 9: South America Kombucha Industry Revenue Share (%), by Country 2024 & 2032
- Figure 10: Middle East and Africa Kombucha Industry Revenue (Million), by Country 2024 & 2032
- Figure 11: Middle East and Africa Kombucha Industry Revenue Share (%), by Country 2024 & 2032
- Figure 12: North America Kombucha Industry Revenue (Million), by Type 2024 & 2032
- Figure 13: North America Kombucha Industry Revenue Share (%), by Type 2024 & 2032
- Figure 14: North America Kombucha Industry Revenue (Million), by Distribution Channel 2024 & 2032
- Figure 15: North America Kombucha Industry Revenue Share (%), by Distribution Channel 2024 & 2032
- Figure 16: North America Kombucha Industry Revenue (Million), by Country 2024 & 2032
- Figure 17: North America Kombucha Industry Revenue Share (%), by Country 2024 & 2032
- Figure 18: Europe Kombucha Industry Revenue (Million), by Type 2024 & 2032
- Figure 19: Europe Kombucha Industry Revenue Share (%), by Type 2024 & 2032
- Figure 20: Europe Kombucha Industry Revenue (Million), by Distribution Channel 2024 & 2032
- Figure 21: Europe Kombucha Industry Revenue Share (%), by Distribution Channel 2024 & 2032
- Figure 22: Europe Kombucha Industry Revenue (Million), by Country 2024 & 2032
- Figure 23: Europe Kombucha Industry Revenue Share (%), by Country 2024 & 2032
- Figure 24: Asia Pacific Kombucha Industry Revenue (Million), by Type 2024 & 2032
- Figure 25: Asia Pacific Kombucha Industry Revenue Share (%), by Type 2024 & 2032
- Figure 26: Asia Pacific Kombucha Industry Revenue (Million), by Distribution Channel 2024 & 2032
- Figure 27: Asia Pacific Kombucha Industry Revenue Share (%), by Distribution Channel 2024 & 2032
- Figure 28: Asia Pacific Kombucha Industry Revenue (Million), by Country 2024 & 2032
- Figure 29: Asia Pacific Kombucha Industry Revenue Share (%), by Country 2024 & 2032
- Figure 30: South America Kombucha Industry Revenue (Million), by Type 2024 & 2032
- Figure 31: South America Kombucha Industry Revenue Share (%), by Type 2024 & 2032
- Figure 32: South America Kombucha Industry Revenue (Million), by Distribution Channel 2024 & 2032
- Figure 33: South America Kombucha Industry Revenue Share (%), by Distribution Channel 2024 & 2032
- Figure 34: South America Kombucha Industry Revenue (Million), by Country 2024 & 2032
- Figure 35: South America Kombucha Industry Revenue Share (%), by Country 2024 & 2032
- Figure 36: Middle East and Africa Kombucha Industry Revenue (Million), by Type 2024 & 2032
- Figure 37: Middle East and Africa Kombucha Industry Revenue Share (%), by Type 2024 & 2032
- Figure 38: Middle East and Africa Kombucha Industry Revenue (Million), by Distribution Channel 2024 & 2032
- Figure 39: Middle East and Africa Kombucha Industry Revenue Share (%), by Distribution Channel 2024 & 2032
- Figure 40: Middle East and Africa Kombucha Industry Revenue (Million), by Country 2024 & 2032
- Figure 41: Middle East and Africa Kombucha Industry Revenue Share (%), by Country 2024 & 2032
List of Tables
- Table 1: Global Kombucha Industry Revenue Million Forecast, by Region 2019 & 2032
- Table 2: Global Kombucha Industry Revenue Million Forecast, by Type 2019 & 2032
- Table 3: Global Kombucha Industry Revenue Million Forecast, by Distribution Channel 2019 & 2032
- Table 4: Global Kombucha Industry Revenue Million Forecast, by Region 2019 & 2032
- Table 5: Global Kombucha Industry Revenue Million Forecast, by Country 2019 & 2032
- Table 6: United States Kombucha Industry Revenue (Million) Forecast, by Application 2019 & 2032
- Table 7: Canada Kombucha Industry Revenue (Million) Forecast, by Application 2019 & 2032
- Table 8: Mexico Kombucha Industry Revenue (Million) Forecast, by Application 2019 & 2032
- Table 9: Rest of North America Kombucha Industry Revenue (Million) Forecast, by Application 2019 & 2032
- Table 10: Global Kombucha Industry Revenue Million Forecast, by Country 2019 & 2032
- Table 11: Spain Kombucha Industry Revenue (Million) Forecast, by Application 2019 & 2032
- Table 12: United Kingdom Kombucha Industry Revenue (Million) Forecast, by Application 2019 & 2032
- Table 13: Germany Kombucha Industry Revenue (Million) Forecast, by Application 2019 & 2032
- Table 14: France Kombucha Industry Revenue (Million) Forecast, by Application 2019 & 2032
- Table 15: Italy Kombucha Industry Revenue (Million) Forecast, by Application 2019 & 2032
- Table 16: Russia Kombucha Industry Revenue (Million) Forecast, by Application 2019 & 2032
- Table 17: Rest of Europe Kombucha Industry Revenue (Million) Forecast, by Application 2019 & 2032
- Table 18: Global Kombucha Industry Revenue Million Forecast, by Country 2019 & 2032
- Table 19: China Kombucha Industry Revenue (Million) Forecast, by Application 2019 & 2032
- Table 20: Japan Kombucha Industry Revenue (Million) Forecast, by Application 2019 & 2032
- Table 21: India Kombucha Industry Revenue (Million) Forecast, by Application 2019 & 2032
- Table 22: Australia Kombucha Industry Revenue (Million) Forecast, by Application 2019 & 2032
- Table 23: Rest of Asia Pacific Kombucha Industry Revenue (Million) Forecast, by Application 2019 & 2032
- Table 24: Global Kombucha Industry Revenue Million Forecast, by Country 2019 & 2032
- Table 25: Brazil Kombucha Industry Revenue (Million) Forecast, by Application 2019 & 2032
- Table 26: Argentina Kombucha Industry Revenue (Million) Forecast, by Application 2019 & 2032
- Table 27: Rest of South America Kombucha Industry Revenue (Million) Forecast, by Application 2019 & 2032
- Table 28: Global Kombucha Industry Revenue Million Forecast, by Country 2019 & 2032
- Table 29: South Africa Kombucha Industry Revenue (Million) Forecast, by Application 2019 & 2032
- Table 30: Saudi Arabia Kombucha Industry Revenue (Million) Forecast, by Application 2019 & 2032
- Table 31: Rest of Middle East and Africa Kombucha Industry Revenue (Million) Forecast, by Application 2019 & 2032
- Table 32: Global Kombucha Industry Revenue Million Forecast, by Type 2019 & 2032
- Table 33: Global Kombucha Industry Revenue Million Forecast, by Distribution Channel 2019 & 2032
- Table 34: Global Kombucha Industry Revenue Million Forecast, by Country 2019 & 2032
- Table 35: United States Kombucha Industry Revenue (Million) Forecast, by Application 2019 & 2032
- Table 36: Canada Kombucha Industry Revenue (Million) Forecast, by Application 2019 & 2032
- Table 37: Mexico Kombucha Industry Revenue (Million) Forecast, by Application 2019 & 2032
- Table 38: Rest of North America Kombucha Industry Revenue (Million) Forecast, by Application 2019 & 2032
- Table 39: Global Kombucha Industry Revenue Million Forecast, by Type 2019 & 2032
- Table 40: Global Kombucha Industry Revenue Million Forecast, by Distribution Channel 2019 & 2032
- Table 41: Global Kombucha Industry Revenue Million Forecast, by Country 2019 & 2032
- Table 42: Spain Kombucha Industry Revenue (Million) Forecast, by Application 2019 & 2032
- Table 43: United Kingdom Kombucha Industry Revenue (Million) Forecast, by Application 2019 & 2032
- Table 44: Germany Kombucha Industry Revenue (Million) Forecast, by Application 2019 & 2032
- Table 45: France Kombucha Industry Revenue (Million) Forecast, by Application 2019 & 2032
- Table 46: Italy Kombucha Industry Revenue (Million) Forecast, by Application 2019 & 2032
- Table 47: Russia Kombucha Industry Revenue (Million) Forecast, by Application 2019 & 2032
- Table 48: Rest of Europe Kombucha Industry Revenue (Million) Forecast, by Application 2019 & 2032
- Table 49: Global Kombucha Industry Revenue Million Forecast, by Type 2019 & 2032
- Table 50: Global Kombucha Industry Revenue Million Forecast, by Distribution Channel 2019 & 2032
- Table 51: Global Kombucha Industry Revenue Million Forecast, by Country 2019 & 2032
- Table 52: China Kombucha Industry Revenue (Million) Forecast, by Application 2019 & 2032
- Table 53: Japan Kombucha Industry Revenue (Million) Forecast, by Application 2019 & 2032
- Table 54: India Kombucha Industry Revenue (Million) Forecast, by Application 2019 & 2032
- Table 55: Australia Kombucha Industry Revenue (Million) Forecast, by Application 2019 & 2032
- Table 56: Rest of Asia Pacific Kombucha Industry Revenue (Million) Forecast, by Application 2019 & 2032
- Table 57: Global Kombucha Industry Revenue Million Forecast, by Type 2019 & 2032
- Table 58: Global Kombucha Industry Revenue Million Forecast, by Distribution Channel 2019 & 2032
- Table 59: Global Kombucha Industry Revenue Million Forecast, by Country 2019 & 2032
- Table 60: Brazil Kombucha Industry Revenue (Million) Forecast, by Application 2019 & 2032
- Table 61: Argentina Kombucha Industry Revenue (Million) Forecast, by Application 2019 & 2032
- Table 62: Rest of South America Kombucha Industry Revenue (Million) Forecast, by Application 2019 & 2032
- Table 63: Global Kombucha Industry Revenue Million Forecast, by Type 2019 & 2032
- Table 64: Global Kombucha Industry Revenue Million Forecast, by Distribution Channel 2019 & 2032
- Table 65: Global Kombucha Industry Revenue Million Forecast, by Country 2019 & 2032
- Table 66: South Africa Kombucha Industry Revenue (Million) Forecast, by Application 2019 & 2032
- Table 67: Saudi Arabia Kombucha Industry Revenue (Million) Forecast, by Application 2019 & 2032
- Table 68: Rest of Middle East and Africa Kombucha Industry Revenue (Million) Forecast, by Application 2019 & 2032
Frequently Asked Questions
1. What is the projected Compound Annual Growth Rate (CAGR) of the Kombucha Industry?
The projected CAGR is approximately 9.48%.
2. Which companies are prominent players in the Kombucha Industry?
Key companies in the market include Wonder Drink, Revive Kombucha, GT's Living Foods, PepsiCo Inc (Kevita), NessAlla Kombucha*List Not Exhaustive, Brew Dr Kombucha, Makana Beverages Inc, Hain Celestial, Humm Kombucha LLC, Health-Ade.
3. What are the main segments of the Kombucha Industry?
The market segments include Type, Distribution Channel.
4. Can you provide details about the market size?
The market size is estimated to be USD 2.97 Million as of 2022.
5. What are some drivers contributing to market growth?
Increasing application of Gelatin in healthcare and pharmaceutical sector.
6. What are the notable trends driving market growth?
Rising Health Awareness Among Consumers.
7. Are there any restraints impacting market growth?
Rising demand for clean label products.
8. Can you provide examples of recent developments in the market?
February 2022: Brew Dr. launched their first-ever peach-flavored kombucha, Just Peachy. It is made with high-quality loose-leaf green tea and then blends in five varieties of organic peaches. The result is a delicious balance of sweet, ripe, and tart flavors, with hints of honey and summer flowers.
9. What pricing options are available for accessing the report?
Pricing options include single-user, multi-user, and enterprise licenses priced at USD 4750, USD 5250, and USD 8750 respectively.
10. Is the market size provided in terms of value or volume?
The market size is provided in terms of value, measured in Million.
11. Are there any specific market keywords associated with the report?
Yes, the market keyword associated with the report is "Kombucha Industry," which aids in identifying and referencing the specific market segment covered.
12. How do I determine which pricing option suits my needs best?
The pricing options vary based on user requirements and access needs. Individual users may opt for single-user licenses, while businesses requiring broader access may choose multi-user or enterprise licenses for cost-effective access to the report.
13. Are there any additional resources or data provided in the Kombucha Industry report?
While the report offers comprehensive insights, it's advisable to review the specific contents or supplementary materials provided to ascertain if additional resources or data are available.
14. How can I stay updated on further developments or reports in the Kombucha Industry?
To stay informed about further developments, trends, and reports in the Kombucha Industry, consider subscribing to industry newsletters, following relevant companies and organizations, or regularly checking reputable industry news sources and publications.
Methodology
Step 1 - Identification of Relevant Samples Size from Population Database


Step 2 - Approaches for Defining Global Market Size (Value, Volume* & Price*)

Note*: In applicable scenarios
Step 3 - Data Sources
Primary Research
- Web Analytics
- Survey Reports
- Research Institute
- Latest Research Reports
- Opinion Leaders
Secondary Research
- Annual Reports
- White Paper
- Latest Press Release
- Industry Association
- Paid Database
- Investor Presentations

Step 4 - Data Triangulation
Involves using different sources of information in order to increase the validity of a study
These sources are likely to be stakeholders in a program - participants, other researchers, program staff, other community members, and so on.
Then we put all data in single framework & apply various statistical tools to find out the dynamic on the market.
During the analysis stage, feedback from the stakeholder groups would be compared to determine areas of agreement as well as areas of divergence


