
Key Insights
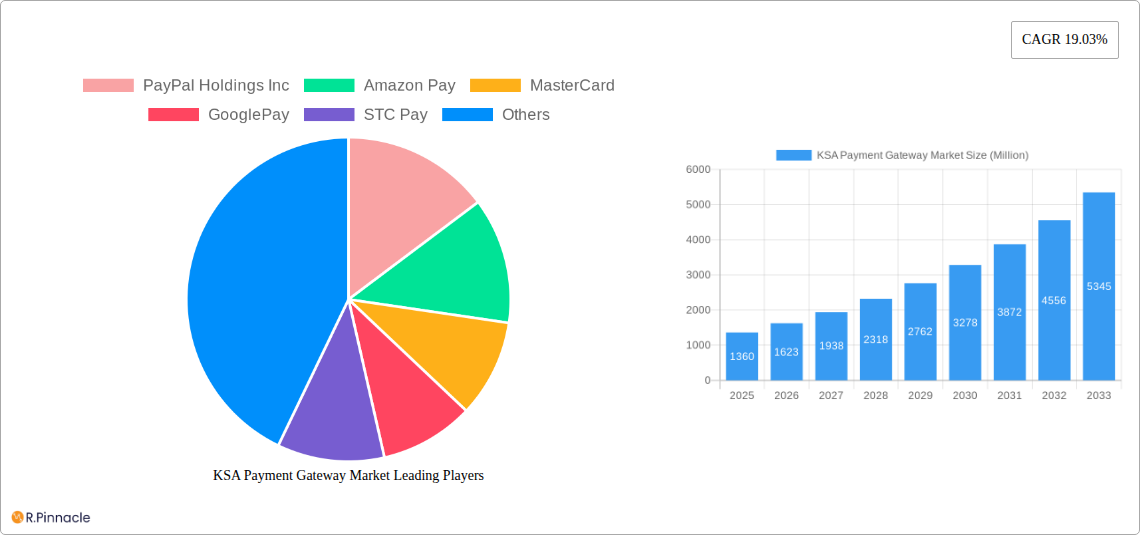
The Kingdom of Saudi Arabia (KSA) payment gateway market is experiencing robust growth, projected to reach a market size of $1.36 billion in 2025, exhibiting a Compound Annual Growth Rate (CAGR) of 19.03%. This expansion is fueled by several key factors. The rapid adoption of e-commerce and digital transactions within the KSA, driven by a young and tech-savvy population, is a significant driver. Government initiatives promoting digital transformation and financial inclusion are also accelerating market penetration. Increased smartphone penetration and reliable internet connectivity are creating a fertile ground for online payments, further bolstering the growth of payment gateways. Furthermore, the rising preference for contactless and cashless transactions, particularly amplified by the global pandemic, is significantly influencing consumer behavior and driving demand for secure and convenient online payment solutions. Competition is fierce, with established international players like PayPal, Amazon Pay, and MasterCard alongside prominent regional players such as STC Pay, PayTabs, and HyperPay vying for market share. The market is also witnessing innovation in areas such as mobile payment solutions and the integration of advanced security features to enhance trust and confidence amongst users. Challenges remain, however, including maintaining robust cybersecurity measures to mitigate fraud and ensuring regulatory compliance within the evolving financial technology landscape.
Looking ahead to 2033, the KSA payment gateway market is poised for continued expansion, driven by the ongoing digitalization of the economy and the government’s Vision 2030 initiative, which aims to diversify the economy and promote technological advancements. This sustained growth will likely attract further investment and innovation, leading to the emergence of new players and the evolution of existing payment solutions. Factors such as improved financial literacy, the expansion of digital infrastructure, and the increasing acceptance of online payments across various sectors will contribute significantly to market growth. The focus will likely shift towards enhancing user experience, improving interoperability between different payment systems, and leveraging emerging technologies such as artificial intelligence and blockchain to enhance security and efficiency. The competitive landscape will remain dynamic, demanding continuous innovation and adaptation from existing and new market entrants.
KSA Payment Gateway Market Report: 2019-2033
This comprehensive report provides an in-depth analysis of the Kingdom of Saudi Arabia (KSA) payment gateway market, covering the historical period (2019-2024), base year (2025), and forecast period (2025-2033). It offers actionable insights for industry professionals, investors, and businesses operating within or planning to enter this dynamic market. The report utilizes data from the latest industry trends, including key partnerships and market developments, to provide a robust forecast and analysis of the KSA payment gateway market's growth trajectory. The projected market value is expected to reach xx Million by 2033.
KSA Payment Gateway Market Structure & Innovation Trends
This section analyzes the KSA payment gateway market's structure, focusing on market concentration, innovation drivers, regulatory frameworks, and competitive dynamics. We examine the roles of key players such as PayPal Holdings Inc, Amazon Pay, MasterCard, Google Pay, STC Pay, Akurateco, Telr Saudi Arabia, PayTabs, Hyper Pay, and Moyasar Financial Company (list not exhaustive), assessing their market share and influence. The analysis includes an examination of mergers and acquisitions (M&A) activities within the sector, quantifying deal values where available (xx Million). The report also explores the impact of regulatory frameworks on market innovation and competition, highlighting the influence of the Saudi Arabian Monetary Authority (SAMA). Further, the analysis delves into the prevalence of product substitutes and the evolving demographics of end-users within the KSA market.
- Market Concentration: Analysis of market share held by major players.
- Innovation Drivers: Examination of technological advancements, regulatory changes, and consumer demands driving innovation.
- Regulatory Frameworks: Assessment of SAMA's influence and its impact on market operations.
- M&A Activities: Review of significant M&A deals and their implications for market structure (e.g., deal values of xx Million).
- Product Substitutes: Analysis of alternative payment methods and their impact on the market.
- End-User Demographics: Evaluation of the changing user base and its effect on market demand.

KSA Payment Gateway Market Dynamics & Trends
This section explores the key dynamics shaping the KSA payment gateway market's growth trajectory. We examine factors driving market expansion, including the increasing adoption of e-commerce, the rising penetration of smartphones, and the government's initiatives to promote digital payments. The analysis also considers technological disruptions, such as the emergence of new payment technologies and the growing importance of mobile wallets. Further, the report analyzes consumer preferences, including the shift towards contactless payments and the demand for secure and convenient payment options. Competitive dynamics are also investigated, with a focus on market share fluctuations, strategic alliances, and pricing strategies. Key metrics, such as the compound annual growth rate (CAGR) and market penetration rate, are presented to illustrate market trends. The projected CAGR for the forecast period is estimated at xx%.
Dominant Regions & Segments in KSA Payment Gateway Market
This section identifies the leading regions and segments within the KSA payment gateway market. The analysis highlights the factors contributing to the dominance of specific regions or segments, including economic policies, infrastructure development, and consumer behavior.
- Key Drivers of Dominance:
- Economic Policies: Government initiatives supporting digital payments.
- Infrastructure: Availability of robust internet and mobile network infrastructure.
- Consumer Behavior: Adoption rates of digital payment methods among different demographics.
A detailed analysis of the dominant region/segment will follow, examining its unique characteristics and market dynamics.
KSA Payment Gateway Market Product Innovations
This section summarizes recent product developments, focusing on technological advancements and their impact on market competitiveness. The analysis emphasizes the adoption of innovative technologies like biometrics, AI-driven fraud detection, and the integration of various payment methods within single platforms. The report highlights how these innovations address market needs and offer competitive advantages for providers.
Report Scope & Segmentation Analysis
This report segments the KSA payment gateway market based on various parameters, including payment type, transaction value, industry vertical, and deployment type. Each segment's growth projections, market size, and competitive landscape are analyzed separately. Further granular details on each segment will be available in the full report.
Key Drivers of KSA Payment Gateway Market Growth
The growth of the KSA payment gateway market is fueled by several factors. The increasing adoption of e-commerce and digital transactions, driven by government initiatives promoting a cashless economy, is a significant driver. Furthermore, advancements in payment technologies and the expansion of mobile and internet penetration significantly contribute to market expansion. Regulatory support and supportive government policies also play a vital role in fostering growth.
Challenges in the KSA Payment Gateway Market Sector
Despite the significant growth potential, the KSA payment gateway market faces several challenges. These include regulatory complexities, the need for enhanced security measures to mitigate fraud risks, and intense competition among established and emerging players. These factors can potentially impact market growth and profitability.
Emerging Opportunities in KSA Payment Gateway Market
Despite the challenges, several opportunities exist for growth in the KSA payment gateway market. The expansion of fintech solutions, the increasing adoption of mobile payments, and the rise of Buy Now, Pay Later (BNPL) services present lucrative opportunities for market players. Additionally, the increasing demand for secure and user-friendly payment gateways presents growth potential for innovative solutions.
Leading Players in the KSA Payment Gateway Market
- PayPal Holdings Inc
- Amazon Pay
- MasterCard
- Google Pay
- STC Pay
- Akurateco
- Telr Saudi Arabia
- PayTabs
- Hyper Pay
- Moyasar Financial Company
Key Developments in KSA Payment Gateway Market Industry
- September 2024: barq partners with Mastercard to offer enhanced payment acceptance solutions. This collaboration is expected to significantly boost barq's market share and strengthen Mastercard's presence in the KSA market.
- February 2024: Mastercard's partnership with Loop expands access to advanced credit card offerings and innovative payment solutions, furthering financial inclusion and driving market growth.
Future Outlook for KSA Payment Gateway Market
The KSA payment gateway market is poised for continued growth, driven by increasing digitalization, government support for financial technology, and a rising young population embracing digital payments. Strategic partnerships, technological innovations, and the expansion of e-commerce will further fuel market expansion in the coming years. The market is anticipated to experience substantial growth and present significant opportunities for businesses to capitalize on the ongoing digital transformation in the Kingdom.
KSA Payment Gateway Market Segmentation
-
1. Type
- 1.1. Hosted
- 1.2. Non-hosted
-
2. Enterprise
- 2.1. Small and Medium Enterprise (SME)
- 2.2. Large Enterprise
-
3. End User
- 3.1. Travel
- 3.2. Retail
- 3.3. BFSI
- 3.4. Media and Entertainment
- 3.5. Other End Users
KSA Payment Gateway Market Segmentation By Geography
-
1. North America
- 1.1. United States
- 1.2. Canada
- 1.3. Mexico
-
2. South America
- 2.1. Brazil
- 2.2. Argentina
- 2.3. Rest of South America
-
3. Europe
- 3.1. United Kingdom
- 3.2. Germany
- 3.3. France
- 3.4. Italy
- 3.5. Spain
- 3.6. Russia
- 3.7. Benelux
- 3.8. Nordics
- 3.9. Rest of Europe
-
4. Middle East & Africa
- 4.1. Turkey
- 4.2. Israel
- 4.3. GCC
- 4.4. North Africa
- 4.5. South Africa
- 4.6. Rest of Middle East & Africa
-
5. Asia Pacific
- 5.1. China
- 5.2. India
- 5.3. Japan
- 5.4. South Korea
- 5.5. ASEAN
- 5.6. Oceania
- 5.7. Rest of Asia Pacific

KSA Payment Gateway Market REPORT HIGHLIGHTS
| Aspects | Details |
|---|---|
| Study Period | 2019-2033 |
| Base Year | 2024 |
| Estimated Year | 2025 |
| Forecast Period | 2025-2033 |
| Historical Period | 2019-2024 |
| Growth Rate | CAGR of 19.03% from 2019-2033 |
| Segmentation |
|
Table of Contents
- 1. Introduction
- 1.1. Research Scope
- 1.2. Market Segmentation
- 1.3. Research Methodology
- 1.4. Definitions and Assumptions
- 2. Executive Summary
- 2.1. Introduction
- 3. Market Dynamics
- 3.1. Introduction
- 3.2. Market Drivers
- 3.2.1. Increased E-commerce Sales and High Internet Penetration Rate; Increased Demand for Mobile-based Payments; Growing Adoption of Payment Gateways in Retail
- 3.3. Market Restrains
- 3.3.1. Increased E-commerce Sales and High Internet Penetration Rate; Increased Demand for Mobile-based Payments; Growing Adoption of Payment Gateways in Retail
- 3.4. Market Trends
- 3.4.1. Increased E-commerce Sales and High Internet Penetration Rate
- 4. Market Factor Analysis
- 4.1. Porters Five Forces
- 4.2. Supply/Value Chain
- 4.3. PESTEL analysis
- 4.4. Market Entropy
- 4.5. Patent/Trademark Analysis
- 5. Global KSA Payment Gateway Market Analysis, Insights and Forecast, 2019-2031
- 5.1. Market Analysis, Insights and Forecast - by Type
- 5.1.1. Hosted
- 5.1.2. Non-hosted
- 5.2. Market Analysis, Insights and Forecast - by Enterprise
- 5.2.1. Small and Medium Enterprise (SME)
- 5.2.2. Large Enterprise
- 5.3. Market Analysis, Insights and Forecast - by End User
- 5.3.1. Travel
- 5.3.2. Retail
- 5.3.3. BFSI
- 5.3.4. Media and Entertainment
- 5.3.5. Other End Users
- 5.4. Market Analysis, Insights and Forecast - by Region
- 5.4.1. North America
- 5.4.2. South America
- 5.4.3. Europe
- 5.4.4. Middle East & Africa
- 5.4.5. Asia Pacific
- 5.1. Market Analysis, Insights and Forecast - by Type
- 6. North America KSA Payment Gateway Market Analysis, Insights and Forecast, 2019-2031
- 6.1. Market Analysis, Insights and Forecast - by Type
- 6.1.1. Hosted
- 6.1.2. Non-hosted
- 6.2. Market Analysis, Insights and Forecast - by Enterprise
- 6.2.1. Small and Medium Enterprise (SME)
- 6.2.2. Large Enterprise
- 6.3. Market Analysis, Insights and Forecast - by End User
- 6.3.1. Travel
- 6.3.2. Retail
- 6.3.3. BFSI
- 6.3.4. Media and Entertainment
- 6.3.5. Other End Users
- 6.1. Market Analysis, Insights and Forecast - by Type
- 7. South America KSA Payment Gateway Market Analysis, Insights and Forecast, 2019-2031
- 7.1. Market Analysis, Insights and Forecast - by Type
- 7.1.1. Hosted
- 7.1.2. Non-hosted
- 7.2. Market Analysis, Insights and Forecast - by Enterprise
- 7.2.1. Small and Medium Enterprise (SME)
- 7.2.2. Large Enterprise
- 7.3. Market Analysis, Insights and Forecast - by End User
- 7.3.1. Travel
- 7.3.2. Retail
- 7.3.3. BFSI
- 7.3.4. Media and Entertainment
- 7.3.5. Other End Users
- 7.1. Market Analysis, Insights and Forecast - by Type
- 8. Europe KSA Payment Gateway Market Analysis, Insights and Forecast, 2019-2031
- 8.1. Market Analysis, Insights and Forecast - by Type
- 8.1.1. Hosted
- 8.1.2. Non-hosted
- 8.2. Market Analysis, Insights and Forecast - by Enterprise
- 8.2.1. Small and Medium Enterprise (SME)
- 8.2.2. Large Enterprise
- 8.3. Market Analysis, Insights and Forecast - by End User
- 8.3.1. Travel
- 8.3.2. Retail
- 8.3.3. BFSI
- 8.3.4. Media and Entertainment
- 8.3.5. Other End Users
- 8.1. Market Analysis, Insights and Forecast - by Type
- 9. Middle East & Africa KSA Payment Gateway Market Analysis, Insights and Forecast, 2019-2031
- 9.1. Market Analysis, Insights and Forecast - by Type
- 9.1.1. Hosted
- 9.1.2. Non-hosted
- 9.2. Market Analysis, Insights and Forecast - by Enterprise
- 9.2.1. Small and Medium Enterprise (SME)
- 9.2.2. Large Enterprise
- 9.3. Market Analysis, Insights and Forecast - by End User
- 9.3.1. Travel
- 9.3.2. Retail
- 9.3.3. BFSI
- 9.3.4. Media and Entertainment
- 9.3.5. Other End Users
- 9.1. Market Analysis, Insights and Forecast - by Type
- 10. Asia Pacific KSA Payment Gateway Market Analysis, Insights and Forecast, 2019-2031
- 10.1. Market Analysis, Insights and Forecast - by Type
- 10.1.1. Hosted
- 10.1.2. Non-hosted
- 10.2. Market Analysis, Insights and Forecast - by Enterprise
- 10.2.1. Small and Medium Enterprise (SME)
- 10.2.2. Large Enterprise
- 10.3. Market Analysis, Insights and Forecast - by End User
- 10.3.1. Travel
- 10.3.2. Retail
- 10.3.3. BFSI
- 10.3.4. Media and Entertainment
- 10.3.5. Other End Users
- 10.1. Market Analysis, Insights and Forecast - by Type
- 11. Competitive Analysis
- 11.1. Global Market Share Analysis 2024
- 11.2. Company Profiles
- 11.2.1 PayPal Holdings Inc
- 11.2.1.1. Overview
- 11.2.1.2. Products
- 11.2.1.3. SWOT Analysis
- 11.2.1.4. Recent Developments
- 11.2.1.5. Financials (Based on Availability)
- 11.2.2 Amazon Pay
- 11.2.2.1. Overview
- 11.2.2.2. Products
- 11.2.2.3. SWOT Analysis
- 11.2.2.4. Recent Developments
- 11.2.2.5. Financials (Based on Availability)
- 11.2.3 MasterCard
- 11.2.3.1. Overview
- 11.2.3.2. Products
- 11.2.3.3. SWOT Analysis
- 11.2.3.4. Recent Developments
- 11.2.3.5. Financials (Based on Availability)
- 11.2.4 GooglePay
- 11.2.4.1. Overview
- 11.2.4.2. Products
- 11.2.4.3. SWOT Analysis
- 11.2.4.4. Recent Developments
- 11.2.4.5. Financials (Based on Availability)
- 11.2.5 STC Pay
- 11.2.5.1. Overview
- 11.2.5.2. Products
- 11.2.5.3. SWOT Analysis
- 11.2.5.4. Recent Developments
- 11.2.5.5. Financials (Based on Availability)
- 11.2.6 Akurateco
- 11.2.6.1. Overview
- 11.2.6.2. Products
- 11.2.6.3. SWOT Analysis
- 11.2.6.4. Recent Developments
- 11.2.6.5. Financials (Based on Availability)
- 11.2.7 Telr Saudi Arabia
- 11.2.7.1. Overview
- 11.2.7.2. Products
- 11.2.7.3. SWOT Analysis
- 11.2.7.4. Recent Developments
- 11.2.7.5. Financials (Based on Availability)
- 11.2.8 PayTabs
- 11.2.8.1. Overview
- 11.2.8.2. Products
- 11.2.8.3. SWOT Analysis
- 11.2.8.4. Recent Developments
- 11.2.8.5. Financials (Based on Availability)
- 11.2.9 Hyper Pay
- 11.2.9.1. Overview
- 11.2.9.2. Products
- 11.2.9.3. SWOT Analysis
- 11.2.9.4. Recent Developments
- 11.2.9.5. Financials (Based on Availability)
- 11.2.10 Moyasar Financial Company*List Not Exhaustive
- 11.2.10.1. Overview
- 11.2.10.2. Products
- 11.2.10.3. SWOT Analysis
- 11.2.10.4. Recent Developments
- 11.2.10.5. Financials (Based on Availability)
- 11.2.1 PayPal Holdings Inc
List of Figures
- Figure 1: Global KSA Payment Gateway Market Revenue Breakdown (Million, %) by Region 2024 & 2032
- Figure 2: Global KSA Payment Gateway Market Volume Breakdown (Billion, %) by Region 2024 & 2032
- Figure 3: North America KSA Payment Gateway Market Revenue (Million), by Type 2024 & 2032
- Figure 4: North America KSA Payment Gateway Market Volume (Billion), by Type 2024 & 2032
- Figure 5: North America KSA Payment Gateway Market Revenue Share (%), by Type 2024 & 2032
- Figure 6: North America KSA Payment Gateway Market Volume Share (%), by Type 2024 & 2032
- Figure 7: North America KSA Payment Gateway Market Revenue (Million), by Enterprise 2024 & 2032
- Figure 8: North America KSA Payment Gateway Market Volume (Billion), by Enterprise 2024 & 2032
- Figure 9: North America KSA Payment Gateway Market Revenue Share (%), by Enterprise 2024 & 2032
- Figure 10: North America KSA Payment Gateway Market Volume Share (%), by Enterprise 2024 & 2032
- Figure 11: North America KSA Payment Gateway Market Revenue (Million), by End User 2024 & 2032
- Figure 12: North America KSA Payment Gateway Market Volume (Billion), by End User 2024 & 2032
- Figure 13: North America KSA Payment Gateway Market Revenue Share (%), by End User 2024 & 2032
- Figure 14: North America KSA Payment Gateway Market Volume Share (%), by End User 2024 & 2032
- Figure 15: North America KSA Payment Gateway Market Revenue (Million), by Country 2024 & 2032
- Figure 16: North America KSA Payment Gateway Market Volume (Billion), by Country 2024 & 2032
- Figure 17: North America KSA Payment Gateway Market Revenue Share (%), by Country 2024 & 2032
- Figure 18: North America KSA Payment Gateway Market Volume Share (%), by Country 2024 & 2032
- Figure 19: South America KSA Payment Gateway Market Revenue (Million), by Type 2024 & 2032
- Figure 20: South America KSA Payment Gateway Market Volume (Billion), by Type 2024 & 2032
- Figure 21: South America KSA Payment Gateway Market Revenue Share (%), by Type 2024 & 2032
- Figure 22: South America KSA Payment Gateway Market Volume Share (%), by Type 2024 & 2032
- Figure 23: South America KSA Payment Gateway Market Revenue (Million), by Enterprise 2024 & 2032
- Figure 24: South America KSA Payment Gateway Market Volume (Billion), by Enterprise 2024 & 2032
- Figure 25: South America KSA Payment Gateway Market Revenue Share (%), by Enterprise 2024 & 2032
- Figure 26: South America KSA Payment Gateway Market Volume Share (%), by Enterprise 2024 & 2032
- Figure 27: South America KSA Payment Gateway Market Revenue (Million), by End User 2024 & 2032
- Figure 28: South America KSA Payment Gateway Market Volume (Billion), by End User 2024 & 2032
- Figure 29: South America KSA Payment Gateway Market Revenue Share (%), by End User 2024 & 2032
- Figure 30: South America KSA Payment Gateway Market Volume Share (%), by End User 2024 & 2032
- Figure 31: South America KSA Payment Gateway Market Revenue (Million), by Country 2024 & 2032
- Figure 32: South America KSA Payment Gateway Market Volume (Billion), by Country 2024 & 2032
- Figure 33: South America KSA Payment Gateway Market Revenue Share (%), by Country 2024 & 2032
- Figure 34: South America KSA Payment Gateway Market Volume Share (%), by Country 2024 & 2032
- Figure 35: Europe KSA Payment Gateway Market Revenue (Million), by Type 2024 & 2032
- Figure 36: Europe KSA Payment Gateway Market Volume (Billion), by Type 2024 & 2032
- Figure 37: Europe KSA Payment Gateway Market Revenue Share (%), by Type 2024 & 2032
- Figure 38: Europe KSA Payment Gateway Market Volume Share (%), by Type 2024 & 2032
- Figure 39: Europe KSA Payment Gateway Market Revenue (Million), by Enterprise 2024 & 2032
- Figure 40: Europe KSA Payment Gateway Market Volume (Billion), by Enterprise 2024 & 2032
- Figure 41: Europe KSA Payment Gateway Market Revenue Share (%), by Enterprise 2024 & 2032
- Figure 42: Europe KSA Payment Gateway Market Volume Share (%), by Enterprise 2024 & 2032
- Figure 43: Europe KSA Payment Gateway Market Revenue (Million), by End User 2024 & 2032
- Figure 44: Europe KSA Payment Gateway Market Volume (Billion), by End User 2024 & 2032
- Figure 45: Europe KSA Payment Gateway Market Revenue Share (%), by End User 2024 & 2032
- Figure 46: Europe KSA Payment Gateway Market Volume Share (%), by End User 2024 & 2032
- Figure 47: Europe KSA Payment Gateway Market Revenue (Million), by Country 2024 & 2032
- Figure 48: Europe KSA Payment Gateway Market Volume (Billion), by Country 2024 & 2032
- Figure 49: Europe KSA Payment Gateway Market Revenue Share (%), by Country 2024 & 2032
- Figure 50: Europe KSA Payment Gateway Market Volume Share (%), by Country 2024 & 2032
- Figure 51: Middle East & Africa KSA Payment Gateway Market Revenue (Million), by Type 2024 & 2032
- Figure 52: Middle East & Africa KSA Payment Gateway Market Volume (Billion), by Type 2024 & 2032
- Figure 53: Middle East & Africa KSA Payment Gateway Market Revenue Share (%), by Type 2024 & 2032
- Figure 54: Middle East & Africa KSA Payment Gateway Market Volume Share (%), by Type 2024 & 2032
- Figure 55: Middle East & Africa KSA Payment Gateway Market Revenue (Million), by Enterprise 2024 & 2032
- Figure 56: Middle East & Africa KSA Payment Gateway Market Volume (Billion), by Enterprise 2024 & 2032
- Figure 57: Middle East & Africa KSA Payment Gateway Market Revenue Share (%), by Enterprise 2024 & 2032
- Figure 58: Middle East & Africa KSA Payment Gateway Market Volume Share (%), by Enterprise 2024 & 2032
- Figure 59: Middle East & Africa KSA Payment Gateway Market Revenue (Million), by End User 2024 & 2032
- Figure 60: Middle East & Africa KSA Payment Gateway Market Volume (Billion), by End User 2024 & 2032
- Figure 61: Middle East & Africa KSA Payment Gateway Market Revenue Share (%), by End User 2024 & 2032
- Figure 62: Middle East & Africa KSA Payment Gateway Market Volume Share (%), by End User 2024 & 2032
- Figure 63: Middle East & Africa KSA Payment Gateway Market Revenue (Million), by Country 2024 & 2032
- Figure 64: Middle East & Africa KSA Payment Gateway Market Volume (Billion), by Country 2024 & 2032
- Figure 65: Middle East & Africa KSA Payment Gateway Market Revenue Share (%), by Country 2024 & 2032
- Figure 66: Middle East & Africa KSA Payment Gateway Market Volume Share (%), by Country 2024 & 2032
- Figure 67: Asia Pacific KSA Payment Gateway Market Revenue (Million), by Type 2024 & 2032
- Figure 68: Asia Pacific KSA Payment Gateway Market Volume (Billion), by Type 2024 & 2032
- Figure 69: Asia Pacific KSA Payment Gateway Market Revenue Share (%), by Type 2024 & 2032
- Figure 70: Asia Pacific KSA Payment Gateway Market Volume Share (%), by Type 2024 & 2032
- Figure 71: Asia Pacific KSA Payment Gateway Market Revenue (Million), by Enterprise 2024 & 2032
- Figure 72: Asia Pacific KSA Payment Gateway Market Volume (Billion), by Enterprise 2024 & 2032
- Figure 73: Asia Pacific KSA Payment Gateway Market Revenue Share (%), by Enterprise 2024 & 2032
- Figure 74: Asia Pacific KSA Payment Gateway Market Volume Share (%), by Enterprise 2024 & 2032
- Figure 75: Asia Pacific KSA Payment Gateway Market Revenue (Million), by End User 2024 & 2032
- Figure 76: Asia Pacific KSA Payment Gateway Market Volume (Billion), by End User 2024 & 2032
- Figure 77: Asia Pacific KSA Payment Gateway Market Revenue Share (%), by End User 2024 & 2032
- Figure 78: Asia Pacific KSA Payment Gateway Market Volume Share (%), by End User 2024 & 2032
- Figure 79: Asia Pacific KSA Payment Gateway Market Revenue (Million), by Country 2024 & 2032
- Figure 80: Asia Pacific KSA Payment Gateway Market Volume (Billion), by Country 2024 & 2032
- Figure 81: Asia Pacific KSA Payment Gateway Market Revenue Share (%), by Country 2024 & 2032
- Figure 82: Asia Pacific KSA Payment Gateway Market Volume Share (%), by Country 2024 & 2032
List of Tables
- Table 1: Global KSA Payment Gateway Market Revenue Million Forecast, by Region 2019 & 2032
- Table 2: Global KSA Payment Gateway Market Volume Billion Forecast, by Region 2019 & 2032
- Table 3: Global KSA Payment Gateway Market Revenue Million Forecast, by Type 2019 & 2032
- Table 4: Global KSA Payment Gateway Market Volume Billion Forecast, by Type 2019 & 2032
- Table 5: Global KSA Payment Gateway Market Revenue Million Forecast, by Enterprise 2019 & 2032
- Table 6: Global KSA Payment Gateway Market Volume Billion Forecast, by Enterprise 2019 & 2032
- Table 7: Global KSA Payment Gateway Market Revenue Million Forecast, by End User 2019 & 2032
- Table 8: Global KSA Payment Gateway Market Volume Billion Forecast, by End User 2019 & 2032
- Table 9: Global KSA Payment Gateway Market Revenue Million Forecast, by Region 2019 & 2032
- Table 10: Global KSA Payment Gateway Market Volume Billion Forecast, by Region 2019 & 2032
- Table 11: Global KSA Payment Gateway Market Revenue Million Forecast, by Type 2019 & 2032
- Table 12: Global KSA Payment Gateway Market Volume Billion Forecast, by Type 2019 & 2032
- Table 13: Global KSA Payment Gateway Market Revenue Million Forecast, by Enterprise 2019 & 2032
- Table 14: Global KSA Payment Gateway Market Volume Billion Forecast, by Enterprise 2019 & 2032
- Table 15: Global KSA Payment Gateway Market Revenue Million Forecast, by End User 2019 & 2032
- Table 16: Global KSA Payment Gateway Market Volume Billion Forecast, by End User 2019 & 2032
- Table 17: Global KSA Payment Gateway Market Revenue Million Forecast, by Country 2019 & 2032
- Table 18: Global KSA Payment Gateway Market Volume Billion Forecast, by Country 2019 & 2032
- Table 19: United States KSA Payment Gateway Market Revenue (Million) Forecast, by Application 2019 & 2032
- Table 20: United States KSA Payment Gateway Market Volume (Billion) Forecast, by Application 2019 & 2032
- Table 21: Canada KSA Payment Gateway Market Revenue (Million) Forecast, by Application 2019 & 2032
- Table 22: Canada KSA Payment Gateway Market Volume (Billion) Forecast, by Application 2019 & 2032
- Table 23: Mexico KSA Payment Gateway Market Revenue (Million) Forecast, by Application 2019 & 2032
- Table 24: Mexico KSA Payment Gateway Market Volume (Billion) Forecast, by Application 2019 & 2032
- Table 25: Global KSA Payment Gateway Market Revenue Million Forecast, by Type 2019 & 2032
- Table 26: Global KSA Payment Gateway Market Volume Billion Forecast, by Type 2019 & 2032
- Table 27: Global KSA Payment Gateway Market Revenue Million Forecast, by Enterprise 2019 & 2032
- Table 28: Global KSA Payment Gateway Market Volume Billion Forecast, by Enterprise 2019 & 2032
- Table 29: Global KSA Payment Gateway Market Revenue Million Forecast, by End User 2019 & 2032
- Table 30: Global KSA Payment Gateway Market Volume Billion Forecast, by End User 2019 & 2032
- Table 31: Global KSA Payment Gateway Market Revenue Million Forecast, by Country 2019 & 2032
- Table 32: Global KSA Payment Gateway Market Volume Billion Forecast, by Country 2019 & 2032
- Table 33: Brazil KSA Payment Gateway Market Revenue (Million) Forecast, by Application 2019 & 2032
- Table 34: Brazil KSA Payment Gateway Market Volume (Billion) Forecast, by Application 2019 & 2032
- Table 35: Argentina KSA Payment Gateway Market Revenue (Million) Forecast, by Application 2019 & 2032
- Table 36: Argentina KSA Payment Gateway Market Volume (Billion) Forecast, by Application 2019 & 2032
- Table 37: Rest of South America KSA Payment Gateway Market Revenue (Million) Forecast, by Application 2019 & 2032
- Table 38: Rest of South America KSA Payment Gateway Market Volume (Billion) Forecast, by Application 2019 & 2032
- Table 39: Global KSA Payment Gateway Market Revenue Million Forecast, by Type 2019 & 2032
- Table 40: Global KSA Payment Gateway Market Volume Billion Forecast, by Type 2019 & 2032
- Table 41: Global KSA Payment Gateway Market Revenue Million Forecast, by Enterprise 2019 & 2032
- Table 42: Global KSA Payment Gateway Market Volume Billion Forecast, by Enterprise 2019 & 2032
- Table 43: Global KSA Payment Gateway Market Revenue Million Forecast, by End User 2019 & 2032
- Table 44: Global KSA Payment Gateway Market Volume Billion Forecast, by End User 2019 & 2032
- Table 45: Global KSA Payment Gateway Market Revenue Million Forecast, by Country 2019 & 2032
- Table 46: Global KSA Payment Gateway Market Volume Billion Forecast, by Country 2019 & 2032
- Table 47: United Kingdom KSA Payment Gateway Market Revenue (Million) Forecast, by Application 2019 & 2032
- Table 48: United Kingdom KSA Payment Gateway Market Volume (Billion) Forecast, by Application 2019 & 2032
- Table 49: Germany KSA Payment Gateway Market Revenue (Million) Forecast, by Application 2019 & 2032
- Table 50: Germany KSA Payment Gateway Market Volume (Billion) Forecast, by Application 2019 & 2032
- Table 51: France KSA Payment Gateway Market Revenue (Million) Forecast, by Application 2019 & 2032
- Table 52: France KSA Payment Gateway Market Volume (Billion) Forecast, by Application 2019 & 2032
- Table 53: Italy KSA Payment Gateway Market Revenue (Million) Forecast, by Application 2019 & 2032
- Table 54: Italy KSA Payment Gateway Market Volume (Billion) Forecast, by Application 2019 & 2032
- Table 55: Spain KSA Payment Gateway Market Revenue (Million) Forecast, by Application 2019 & 2032
- Table 56: Spain KSA Payment Gateway Market Volume (Billion) Forecast, by Application 2019 & 2032
- Table 57: Russia KSA Payment Gateway Market Revenue (Million) Forecast, by Application 2019 & 2032
- Table 58: Russia KSA Payment Gateway Market Volume (Billion) Forecast, by Application 2019 & 2032
- Table 59: Benelux KSA Payment Gateway Market Revenue (Million) Forecast, by Application 2019 & 2032
- Table 60: Benelux KSA Payment Gateway Market Volume (Billion) Forecast, by Application 2019 & 2032
- Table 61: Nordics KSA Payment Gateway Market Revenue (Million) Forecast, by Application 2019 & 2032
- Table 62: Nordics KSA Payment Gateway Market Volume (Billion) Forecast, by Application 2019 & 2032
- Table 63: Rest of Europe KSA Payment Gateway Market Revenue (Million) Forecast, by Application 2019 & 2032
- Table 64: Rest of Europe KSA Payment Gateway Market Volume (Billion) Forecast, by Application 2019 & 2032
- Table 65: Global KSA Payment Gateway Market Revenue Million Forecast, by Type 2019 & 2032
- Table 66: Global KSA Payment Gateway Market Volume Billion Forecast, by Type 2019 & 2032
- Table 67: Global KSA Payment Gateway Market Revenue Million Forecast, by Enterprise 2019 & 2032
- Table 68: Global KSA Payment Gateway Market Volume Billion Forecast, by Enterprise 2019 & 2032
- Table 69: Global KSA Payment Gateway Market Revenue Million Forecast, by End User 2019 & 2032
- Table 70: Global KSA Payment Gateway Market Volume Billion Forecast, by End User 2019 & 2032
- Table 71: Global KSA Payment Gateway Market Revenue Million Forecast, by Country 2019 & 2032
- Table 72: Global KSA Payment Gateway Market Volume Billion Forecast, by Country 2019 & 2032
- Table 73: Turkey KSA Payment Gateway Market Revenue (Million) Forecast, by Application 2019 & 2032
- Table 74: Turkey KSA Payment Gateway Market Volume (Billion) Forecast, by Application 2019 & 2032
- Table 75: Israel KSA Payment Gateway Market Revenue (Million) Forecast, by Application 2019 & 2032
- Table 76: Israel KSA Payment Gateway Market Volume (Billion) Forecast, by Application 2019 & 2032
- Table 77: GCC KSA Payment Gateway Market Revenue (Million) Forecast, by Application 2019 & 2032
- Table 78: GCC KSA Payment Gateway Market Volume (Billion) Forecast, by Application 2019 & 2032
- Table 79: North Africa KSA Payment Gateway Market Revenue (Million) Forecast, by Application 2019 & 2032
- Table 80: North Africa KSA Payment Gateway Market Volume (Billion) Forecast, by Application 2019 & 2032
- Table 81: South Africa KSA Payment Gateway Market Revenue (Million) Forecast, by Application 2019 & 2032
- Table 82: South Africa KSA Payment Gateway Market Volume (Billion) Forecast, by Application 2019 & 2032
- Table 83: Rest of Middle East & Africa KSA Payment Gateway Market Revenue (Million) Forecast, by Application 2019 & 2032
- Table 84: Rest of Middle East & Africa KSA Payment Gateway Market Volume (Billion) Forecast, by Application 2019 & 2032
- Table 85: Global KSA Payment Gateway Market Revenue Million Forecast, by Type 2019 & 2032
- Table 86: Global KSA Payment Gateway Market Volume Billion Forecast, by Type 2019 & 2032
- Table 87: Global KSA Payment Gateway Market Revenue Million Forecast, by Enterprise 2019 & 2032
- Table 88: Global KSA Payment Gateway Market Volume Billion Forecast, by Enterprise 2019 & 2032
- Table 89: Global KSA Payment Gateway Market Revenue Million Forecast, by End User 2019 & 2032
- Table 90: Global KSA Payment Gateway Market Volume Billion Forecast, by End User 2019 & 2032
- Table 91: Global KSA Payment Gateway Market Revenue Million Forecast, by Country 2019 & 2032
- Table 92: Global KSA Payment Gateway Market Volume Billion Forecast, by Country 2019 & 2032
- Table 93: China KSA Payment Gateway Market Revenue (Million) Forecast, by Application 2019 & 2032
- Table 94: China KSA Payment Gateway Market Volume (Billion) Forecast, by Application 2019 & 2032
- Table 95: India KSA Payment Gateway Market Revenue (Million) Forecast, by Application 2019 & 2032
- Table 96: India KSA Payment Gateway Market Volume (Billion) Forecast, by Application 2019 & 2032
- Table 97: Japan KSA Payment Gateway Market Revenue (Million) Forecast, by Application 2019 & 2032
- Table 98: Japan KSA Payment Gateway Market Volume (Billion) Forecast, by Application 2019 & 2032
- Table 99: South Korea KSA Payment Gateway Market Revenue (Million) Forecast, by Application 2019 & 2032
- Table 100: South Korea KSA Payment Gateway Market Volume (Billion) Forecast, by Application 2019 & 2032
- Table 101: ASEAN KSA Payment Gateway Market Revenue (Million) Forecast, by Application 2019 & 2032
- Table 102: ASEAN KSA Payment Gateway Market Volume (Billion) Forecast, by Application 2019 & 2032
- Table 103: Oceania KSA Payment Gateway Market Revenue (Million) Forecast, by Application 2019 & 2032
- Table 104: Oceania KSA Payment Gateway Market Volume (Billion) Forecast, by Application 2019 & 2032
- Table 105: Rest of Asia Pacific KSA Payment Gateway Market Revenue (Million) Forecast, by Application 2019 & 2032
- Table 106: Rest of Asia Pacific KSA Payment Gateway Market Volume (Billion) Forecast, by Application 2019 & 2032
Frequently Asked Questions
1. What is the projected Compound Annual Growth Rate (CAGR) of the KSA Payment Gateway Market?
The projected CAGR is approximately 19.03%.
2. Which companies are prominent players in the KSA Payment Gateway Market?
Key companies in the market include PayPal Holdings Inc, Amazon Pay, MasterCard, GooglePay, STC Pay, Akurateco, Telr Saudi Arabia, PayTabs, Hyper Pay, Moyasar Financial Company*List Not Exhaustive.
3. What are the main segments of the KSA Payment Gateway Market?
The market segments include Type, Enterprise, End User.
4. Can you provide details about the market size?
The market size is estimated to be USD 1.36 Million as of 2022.
5. What are some drivers contributing to market growth?
Increased E-commerce Sales and High Internet Penetration Rate; Increased Demand for Mobile-based Payments; Growing Adoption of Payment Gateways in Retail.
6. What are the notable trends driving market growth?
Increased E-commerce Sales and High Internet Penetration Rate.
7. Are there any restraints impacting market growth?
Increased E-commerce Sales and High Internet Penetration Rate; Increased Demand for Mobile-based Payments; Growing Adoption of Payment Gateways in Retail.
8. Can you provide examples of recent developments in the market?
September 2024: barq, a financial services startup from Saudi Arabia, joined forces with Mastercard. This collaboration aims to provide barq's customers with top-tier payment acceptance solutions via the Mastercard Gateway. Through this strategic partnership, barq will harness the technology of Mastercard Gateway, enhancing its offerings to merchants and consumers across the Kingdom.February 2024: Mastercard teamed up with Loop, a digital payments technology firm licensed by SAMA, to provide businesses and consumers in the Kingdom with enhanced access to advanced credit card offerings and innovative payment solutions. Through this collaboration, Loop will broaden its portfolio and elevate its range of products and services by harnessing Mastercard's technology and expertise.
9. What pricing options are available for accessing the report?
Pricing options include single-user, multi-user, and enterprise licenses priced at USD 3800, USD 4500, and USD 5800 respectively.
10. Is the market size provided in terms of value or volume?
The market size is provided in terms of value, measured in Million and volume, measured in Billion.
11. Are there any specific market keywords associated with the report?
Yes, the market keyword associated with the report is "KSA Payment Gateway Market," which aids in identifying and referencing the specific market segment covered.
12. How do I determine which pricing option suits my needs best?
The pricing options vary based on user requirements and access needs. Individual users may opt for single-user licenses, while businesses requiring broader access may choose multi-user or enterprise licenses for cost-effective access to the report.
13. Are there any additional resources or data provided in the KSA Payment Gateway Market report?
While the report offers comprehensive insights, it's advisable to review the specific contents or supplementary materials provided to ascertain if additional resources or data are available.
14. How can I stay updated on further developments or reports in the KSA Payment Gateway Market?
To stay informed about further developments, trends, and reports in the KSA Payment Gateway Market, consider subscribing to industry newsletters, following relevant companies and organizations, or regularly checking reputable industry news sources and publications.
Methodology
Step 1 - Identification of Relevant Samples Size from Population Database


Step 2 - Approaches for Defining Global Market Size (Value, Volume* & Price*)

Note*: In applicable scenarios
Step 3 - Data Sources
Primary Research
- Web Analytics
- Survey Reports
- Research Institute
- Latest Research Reports
- Opinion Leaders
Secondary Research
- Annual Reports
- White Paper
- Latest Press Release
- Industry Association
- Paid Database
- Investor Presentations

Step 4 - Data Triangulation
Involves using different sources of information in order to increase the validity of a study
These sources are likely to be stakeholders in a program - participants, other researchers, program staff, other community members, and so on.
Then we put all data in single framework & apply various statistical tools to find out the dynamic on the market.
During the analysis stage, feedback from the stakeholder groups would be compared to determine areas of agreement as well as areas of divergence


