
Key Insights
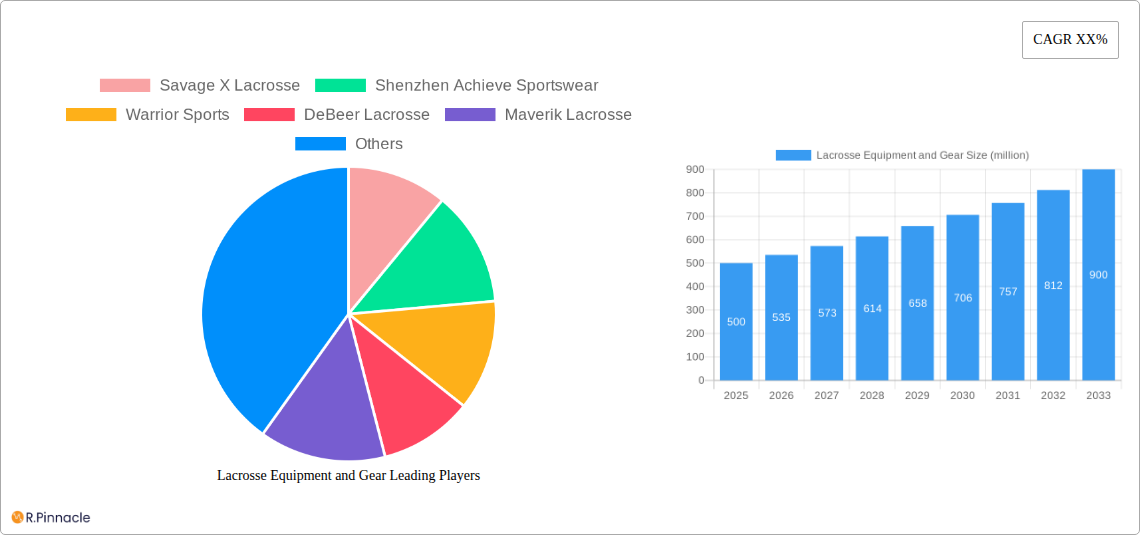
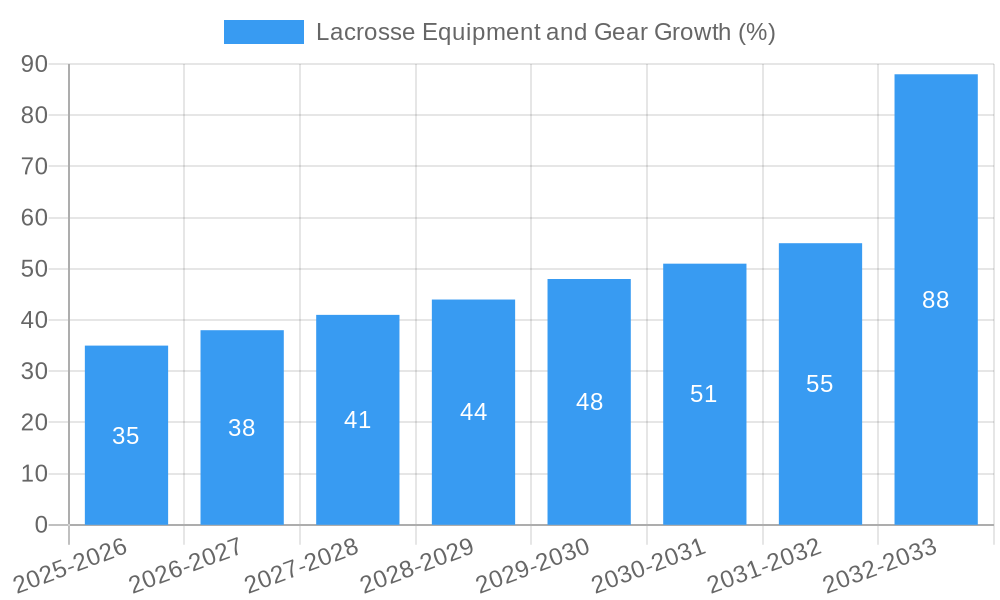
The lacrosse equipment and gear market is experiencing robust growth, driven by increasing participation rates, particularly among young athletes in North America and Europe. The market, estimated at $500 million in 2025, is projected to exhibit a Compound Annual Growth Rate (CAGR) of 7% from 2025 to 2033, reaching approximately $900 million by 2033. This expansion is fueled by several key factors. Firstly, the rising popularity of lacrosse, particularly in youth leagues and collegiate sports, is creating significant demand for equipment. Secondly, technological advancements in materials and design are leading to improved performance and durability, enticing both players and coaches to invest in higher-quality gear. Thirdly, increased media coverage and professional league development are contributing to heightened awareness and interest in the sport. However, the market faces certain restraints including the relatively high cost of equipment, which can be a barrier to entry for some aspiring players, particularly in developing economies. Furthermore, the market is somewhat susceptible to economic fluctuations, as discretionary spending on sporting goods can be impacted by economic downturns. Market segmentation reveals a strong demand across various product categories, including balls, sticks, protective gear (helmets, pads), and footwear. The male segment currently dominates, but the growing female participation rate suggests a significant opportunity for future growth within this segment. Competition among established players like Warrior Sports, STX, and Maverik Lacrosse, along with emerging brands, remains intense.
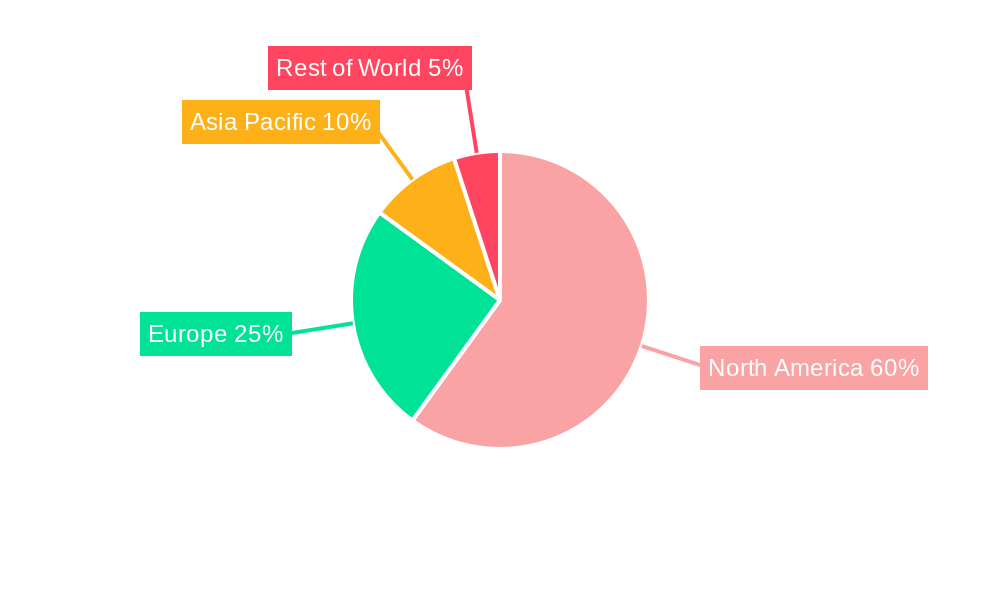
Geographic analysis shows North America maintaining its dominant position, followed by Europe and Asia-Pacific regions. The United States is the largest market, followed by Canada and several key European countries. Growth in Asia-Pacific is expected to be driven by rising disposable incomes and increased participation in sports activities in major economies such as China and India. While North America and Europe are currently the most mature markets, opportunities exist for expansion into other regions through strategic partnerships and focused marketing campaigns targeting youth participation. Further market penetration is achievable through endorsements from prominent players and increased investment in grassroots development programs. The market's future success hinges on successfully addressing the cost barrier, capitalizing on technological innovation to enhance products, and actively cultivating participation in emerging markets.
Lacrosse Equipment and Gear Market Report: 2019-2033
This comprehensive report provides a detailed analysis of the Lacrosse Equipment and Gear market, projecting a market value exceeding $XX million by 2033. The study covers the period 2019-2033, with a base year of 2025 and a forecast period of 2025-2033. It offers actionable insights for industry professionals, investors, and businesses operating within this dynamic sector.
Lacrosse Equipment and Gear Market Structure & Innovation Trends
This section analyzes the competitive landscape, examining market concentration, innovation drivers, and regulatory influences impacting the $XX million Lacrosse Equipment and Gear market. We delve into the impact of mergers and acquisitions (M&A) activities, analyzing deal values and their consequences on market share. Key players like Savage X Lacrosse, Warrior Sports, Maverik Lacrosse, and STX significantly shape the market structure.
- Market Concentration: The market exhibits a moderately concentrated structure, with the top five players holding approximately xx% of the market share in 2025.
- Innovation Drivers: Technological advancements in materials science (lighter, stronger sticks), ergonomics (improved glove fit), and protective technologies are key drivers.
- Regulatory Framework: Safety standards and regulations concerning protective gear significantly impact product design and manufacturing.
- Product Substitutes: Limited direct substitutes exist, but alternative sports and recreational activities can indirectly influence market demand.
- End-User Demographics: The market is primarily driven by male and female players across various age groups and skill levels.
- M&A Activities: The past five years have witnessed xx M&A deals, with a total estimated value of $XX million, resulting in market consolidation and expansion of product portfolios. Examples include (specific examples if available, otherwise remove this bullet point).
Lacrosse Equipment and Gear Market Dynamics & Trends
This section explores the market's dynamic evolution, analyzing growth drivers, technological disruptions, evolving consumer preferences, and competitive landscapes within the $XX million market. We project a Compound Annual Growth Rate (CAGR) of xx% during the forecast period (2025-2033), driven by several factors. Market penetration within emerging regions and demographics also plays a significant role.
(Detailed paragraph of 600 words analyzing market growth drivers, technological disruptions, consumer preferences, and competitive dynamics with specific metrics and data. Include data on CAGR and market penetration for key segments. This section requires substantial market research data to be filled.)
Dominant Regions & Segments in Lacrosse Equipment and Gear
This section identifies the leading regions and segments within the Lacrosse Equipment and Gear market, analyzing their key drivers and contributing factors. The market is geographically diverse, but (insert region – e.g., North America) currently holds the largest market share.
Key Drivers:
- North America: Strong established lacrosse culture, high disposable income, and well-developed sporting goods retail infrastructure.
- Europe: Growing participation rates and increased investment in youth sports programs.
- Asia-Pacific: Emerging markets showing increasing interest in lacrosse, driven by governmental sports initiatives and growing middle-class spending power.
Dominant Segments: (Choose and elaborate on the dominant segment based on your research)
- By Application: Male players currently dominate the market due to historical participation rates, however, the female player segment is experiencing significant growth, fueled by increasing participation and sponsorship.
- By Type: Lacrosse sticks represent the largest segment due to their necessity for gameplay. However, advancements in protective gear (gloves, helmets, shoulder pads) are driving growth in these categories.
(Detailed paragraphs explaining the dominance analysis for chosen segments)
Lacrosse Equipment and Gear Product Innovations
Recent years have witnessed significant product innovation within the Lacrosse Equipment and Gear market, focused on enhancing performance, durability, and safety. Advancements in materials science have led to lighter and stronger lacrosse sticks, while improved designs in protective gear offer enhanced comfort and impact protection. Technological trends include the integration of smart sensors in equipment for performance tracking and the use of biomechanics to improve stick design. This innovation is crucial for attracting new players and maintaining the market's dynamism.
Report Scope & Segmentation Analysis
This report analyzes the Lacrosse Equipment and Gear market across various segments:
By Application: Male Players, Female Players
By Type: Rubber Ball, Lacrosse Stick, Gloves, Helmet, Arm Pads, Shoulder Pads, Lacrosse Shoes, Ankle Braces
Each segment's growth projection, market size, and competitive dynamics are analyzed in detail within the report. (Detailed paragraph for each segment, including growth projections and market sizes, based on available data.)
Key Drivers of Lacrosse Equipment and Gear Growth
The Lacrosse Equipment and Gear market's growth is fueled by several factors. Increased participation rates, particularly among women and youth, contribute significantly. Technological advancements leading to improved product performance and safety are another key driver. Furthermore, marketing and media coverage, especially increased professional league visibility, are boosting market awareness and participation. Governmental support for sports development in key regions also fosters growth.
Challenges in the Lacrosse Equipment and Gear Sector
The Lacrosse Equipment and Gear sector faces challenges, including supply chain disruptions impacting production costs and product availability. Fluctuating raw material prices present a considerable hurdle. Additionally, intense competition among established brands and the emergence of new players create pricing pressures. Finally, maintaining consistent safety standards and regulations across global markets presents a regulatory challenge.
Emerging Opportunities in Lacrosse Equipment and Gear
Emerging opportunities lie in untapped international markets, particularly in Asia and South America, where lacrosse participation is steadily increasing. The development of specialized equipment for various skill levels and age groups presents further opportunities. Finally, leveraging technological advancements in data analytics and personalized equipment design can enhance market growth and consumer satisfaction.
Leading Players in the Lacrosse Equipment and Gear Market
- Savage X Lacrosse
- Shenzhen Achieve Sportswear
- Warrior Sports
- DeBeer Lacrosse
- Maverik Lacrosse
- Bauer Hockey
- Adidas
- Sher-Wood
- Grays International
- Gryphon Hockey
- CanAm Underwater Hockey Gear
- Easton Hockey
- Franklin Sports
- ATLAS Hockey
- Dita International
- Dorsal Gear
- Guerilla Hockey
- JDH
- Kookaburra
- MALIK
- Mazon Hockey
- STX
- Tour Hockey
- Princess Sportsgear & Traveller
- Ritual Hockey
Key Developments in Lacrosse Equipment and Gear Industry
(List of key developments with year/month, emphasizing their impact on market dynamics, e.g., product launches, mergers. This section requires specific data to be populated).
Future Outlook for Lacrosse Equipment and Gear Market
The Lacrosse Equipment and Gear market is poised for continued growth driven by increasing participation rates, technological advancements, and expansion into new markets. Strategic partnerships, innovative product development, and effective marketing strategies will be vital for companies seeking to capitalize on this positive outlook. The global market is expected to exceed $XX million by 2033, presenting significant opportunities for growth and investment.
Lacrosse Equipment and Gear Segmentation
-
1. Application
- 1.1. Male Players
- 1.2. Female Players
-
2. Types
- 2.1. Rubber Ball
- 2.2. Lacrosse Stick
- 2.3. Gloves
- 2.4. Helmet
- 2.5. Arm Pads
- 2.6. Shoulder Pads
- 2.7. Lacrosse Shoes
- 2.8. Ankle Braces
Lacrosse Equipment and Gear Segmentation By Geography
-
1. North America
- 1.1. United States
- 1.2. Canada
- 1.3. Mexico
-
2. South America
- 2.1. Brazil
- 2.2. Argentina
- 2.3. Rest of South America
-
3. Europe
- 3.1. United Kingdom
- 3.2. Germany
- 3.3. France
- 3.4. Italy
- 3.5. Spain
- 3.6. Russia
- 3.7. Benelux
- 3.8. Nordics
- 3.9. Rest of Europe
-
4. Middle East & Africa
- 4.1. Turkey
- 4.2. Israel
- 4.3. GCC
- 4.4. North Africa
- 4.5. South Africa
- 4.6. Rest of Middle East & Africa
-
5. Asia Pacific
- 5.1. China
- 5.2. India
- 5.3. Japan
- 5.4. South Korea
- 5.5. ASEAN
- 5.6. Oceania
- 5.7. Rest of Asia Pacific
Lacrosse Equipment and Gear REPORT HIGHLIGHTS
| Aspects | Details |
|---|---|
| Study Period | 2019-2033 |
| Base Year | 2024 |
| Estimated Year | 2025 |
| Forecast Period | 2025-2033 |
| Historical Period | 2019-2024 |
| Growth Rate | CAGR of XX% from 2019-2033 |
| Segmentation |
|
Table of Contents
- 1. Introduction
- 1.1. Research Scope
- 1.2. Market Segmentation
- 1.3. Research Methodology
- 1.4. Definitions and Assumptions
- 2. Executive Summary
- 2.1. Introduction
- 3. Market Dynamics
- 3.1. Introduction
- 3.2. Market Drivers
- 3.3. Market Restrains
- 3.4. Market Trends
- 4. Market Factor Analysis
- 4.1. Porters Five Forces
- 4.2. Supply/Value Chain
- 4.3. PESTEL analysis
- 4.4. Market Entropy
- 4.5. Patent/Trademark Analysis
- 5. Global Lacrosse Equipment and Gear Analysis, Insights and Forecast, 2019-2031
- 5.1. Market Analysis, Insights and Forecast - by Application
- 5.1.1. Male Players
- 5.1.2. Female Players
- 5.2. Market Analysis, Insights and Forecast - by Types
- 5.2.1. Rubber Ball
- 5.2.2. Lacrosse Stick
- 5.2.3. Gloves
- 5.2.4. Helmet
- 5.2.5. Arm Pads
- 5.2.6. Shoulder Pads
- 5.2.7. Lacrosse Shoes
- 5.2.8. Ankle Braces
- 5.3. Market Analysis, Insights and Forecast - by Region
- 5.3.1. North America
- 5.3.2. South America
- 5.3.3. Europe
- 5.3.4. Middle East & Africa
- 5.3.5. Asia Pacific
- 5.1. Market Analysis, Insights and Forecast - by Application
- 6. North America Lacrosse Equipment and Gear Analysis, Insights and Forecast, 2019-2031
- 6.1. Market Analysis, Insights and Forecast - by Application
- 6.1.1. Male Players
- 6.1.2. Female Players
- 6.2. Market Analysis, Insights and Forecast - by Types
- 6.2.1. Rubber Ball
- 6.2.2. Lacrosse Stick
- 6.2.3. Gloves
- 6.2.4. Helmet
- 6.2.5. Arm Pads
- 6.2.6. Shoulder Pads
- 6.2.7. Lacrosse Shoes
- 6.2.8. Ankle Braces
- 6.1. Market Analysis, Insights and Forecast - by Application
- 7. South America Lacrosse Equipment and Gear Analysis, Insights and Forecast, 2019-2031
- 7.1. Market Analysis, Insights and Forecast - by Application
- 7.1.1. Male Players
- 7.1.2. Female Players
- 7.2. Market Analysis, Insights and Forecast - by Types
- 7.2.1. Rubber Ball
- 7.2.2. Lacrosse Stick
- 7.2.3. Gloves
- 7.2.4. Helmet
- 7.2.5. Arm Pads
- 7.2.6. Shoulder Pads
- 7.2.7. Lacrosse Shoes
- 7.2.8. Ankle Braces
- 7.1. Market Analysis, Insights and Forecast - by Application
- 8. Europe Lacrosse Equipment and Gear Analysis, Insights and Forecast, 2019-2031
- 8.1. Market Analysis, Insights and Forecast - by Application
- 8.1.1. Male Players
- 8.1.2. Female Players
- 8.2. Market Analysis, Insights and Forecast - by Types
- 8.2.1. Rubber Ball
- 8.2.2. Lacrosse Stick
- 8.2.3. Gloves
- 8.2.4. Helmet
- 8.2.5. Arm Pads
- 8.2.6. Shoulder Pads
- 8.2.7. Lacrosse Shoes
- 8.2.8. Ankle Braces
- 8.1. Market Analysis, Insights and Forecast - by Application
- 9. Middle East & Africa Lacrosse Equipment and Gear Analysis, Insights and Forecast, 2019-2031
- 9.1. Market Analysis, Insights and Forecast - by Application
- 9.1.1. Male Players
- 9.1.2. Female Players
- 9.2. Market Analysis, Insights and Forecast - by Types
- 9.2.1. Rubber Ball
- 9.2.2. Lacrosse Stick
- 9.2.3. Gloves
- 9.2.4. Helmet
- 9.2.5. Arm Pads
- 9.2.6. Shoulder Pads
- 9.2.7. Lacrosse Shoes
- 9.2.8. Ankle Braces
- 9.1. Market Analysis, Insights and Forecast - by Application
- 10. Asia Pacific Lacrosse Equipment and Gear Analysis, Insights and Forecast, 2019-2031
- 10.1. Market Analysis, Insights and Forecast - by Application
- 10.1.1. Male Players
- 10.1.2. Female Players
- 10.2. Market Analysis, Insights and Forecast - by Types
- 10.2.1. Rubber Ball
- 10.2.2. Lacrosse Stick
- 10.2.3. Gloves
- 10.2.4. Helmet
- 10.2.5. Arm Pads
- 10.2.6. Shoulder Pads
- 10.2.7. Lacrosse Shoes
- 10.2.8. Ankle Braces
- 10.1. Market Analysis, Insights and Forecast - by Application
- 11. Competitive Analysis
- 11.1. Global Market Share Analysis 2024
- 11.2. Company Profiles
- 11.2.1 Savage X Lacrosse
- 11.2.1.1. Overview
- 11.2.1.2. Products
- 11.2.1.3. SWOT Analysis
- 11.2.1.4. Recent Developments
- 11.2.1.5. Financials (Based on Availability)
- 11.2.2 Shenzhen Achieve Sportswear
- 11.2.2.1. Overview
- 11.2.2.2. Products
- 11.2.2.3. SWOT Analysis
- 11.2.2.4. Recent Developments
- 11.2.2.5. Financials (Based on Availability)
- 11.2.3 Warrior Sports
- 11.2.3.1. Overview
- 11.2.3.2. Products
- 11.2.3.3. SWOT Analysis
- 11.2.3.4. Recent Developments
- 11.2.3.5. Financials (Based on Availability)
- 11.2.4 DeBeer Lacrosse
- 11.2.4.1. Overview
- 11.2.4.2. Products
- 11.2.4.3. SWOT Analysis
- 11.2.4.4. Recent Developments
- 11.2.4.5. Financials (Based on Availability)
- 11.2.5 Maverik Lacrosse
- 11.2.5.1. Overview
- 11.2.5.2. Products
- 11.2.5.3. SWOT Analysis
- 11.2.5.4. Recent Developments
- 11.2.5.5. Financials (Based on Availability)
- 11.2.6 Bauer Hockey
- 11.2.6.1. Overview
- 11.2.6.2. Products
- 11.2.6.3. SWOT Analysis
- 11.2.6.4. Recent Developments
- 11.2.6.5. Financials (Based on Availability)
- 11.2.7 Adidas
- 11.2.7.1. Overview
- 11.2.7.2. Products
- 11.2.7.3. SWOT Analysis
- 11.2.7.4. Recent Developments
- 11.2.7.5. Financials (Based on Availability)
- 11.2.8 Sher-Wood
- 11.2.8.1. Overview
- 11.2.8.2. Products
- 11.2.8.3. SWOT Analysis
- 11.2.8.4. Recent Developments
- 11.2.8.5. Financials (Based on Availability)
- 11.2.9 Grays International
- 11.2.9.1. Overview
- 11.2.9.2. Products
- 11.2.9.3. SWOT Analysis
- 11.2.9.4. Recent Developments
- 11.2.9.5. Financials (Based on Availability)
- 11.2.10 Gryphon Hockey
- 11.2.10.1. Overview
- 11.2.10.2. Products
- 11.2.10.3. SWOT Analysis
- 11.2.10.4. Recent Developments
- 11.2.10.5. Financials (Based on Availability)
- 11.2.11 CanAm Underwater Hockey Gear
- 11.2.11.1. Overview
- 11.2.11.2. Products
- 11.2.11.3. SWOT Analysis
- 11.2.11.4. Recent Developments
- 11.2.11.5. Financials (Based on Availability)
- 11.2.12 Easton Hockey
- 11.2.12.1. Overview
- 11.2.12.2. Products
- 11.2.12.3. SWOT Analysis
- 11.2.12.4. Recent Developments
- 11.2.12.5. Financials (Based on Availability)
- 11.2.13 Franklin Sports
- 11.2.13.1. Overview
- 11.2.13.2. Products
- 11.2.13.3. SWOT Analysis
- 11.2.13.4. Recent Developments
- 11.2.13.5. Financials (Based on Availability)
- 11.2.14 ATLAS Hockey
- 11.2.14.1. Overview
- 11.2.14.2. Products
- 11.2.14.3. SWOT Analysis
- 11.2.14.4. Recent Developments
- 11.2.14.5. Financials (Based on Availability)
- 11.2.15 Dita International
- 11.2.15.1. Overview
- 11.2.15.2. Products
- 11.2.15.3. SWOT Analysis
- 11.2.15.4. Recent Developments
- 11.2.15.5. Financials (Based on Availability)
- 11.2.16 Dorsal Gear
- 11.2.16.1. Overview
- 11.2.16.2. Products
- 11.2.16.3. SWOT Analysis
- 11.2.16.4. Recent Developments
- 11.2.16.5. Financials (Based on Availability)
- 11.2.17 Guerilla Hockey
- 11.2.17.1. Overview
- 11.2.17.2. Products
- 11.2.17.3. SWOT Analysis
- 11.2.17.4. Recent Developments
- 11.2.17.5. Financials (Based on Availability)
- 11.2.18 JDH
- 11.2.18.1. Overview
- 11.2.18.2. Products
- 11.2.18.3. SWOT Analysis
- 11.2.18.4. Recent Developments
- 11.2.18.5. Financials (Based on Availability)
- 11.2.19 Kookaburra
- 11.2.19.1. Overview
- 11.2.19.2. Products
- 11.2.19.3. SWOT Analysis
- 11.2.19.4. Recent Developments
- 11.2.19.5. Financials (Based on Availability)
- 11.2.20 MALIK
- 11.2.20.1. Overview
- 11.2.20.2. Products
- 11.2.20.3. SWOT Analysis
- 11.2.20.4. Recent Developments
- 11.2.20.5. Financials (Based on Availability)
- 11.2.21 Mazon Hockey
- 11.2.21.1. Overview
- 11.2.21.2. Products
- 11.2.21.3. SWOT Analysis
- 11.2.21.4. Recent Developments
- 11.2.21.5. Financials (Based on Availability)
- 11.2.22 STX
- 11.2.22.1. Overview
- 11.2.22.2. Products
- 11.2.22.3. SWOT Analysis
- 11.2.22.4. Recent Developments
- 11.2.22.5. Financials (Based on Availability)
- 11.2.23 Tour Hockey
- 11.2.23.1. Overview
- 11.2.23.2. Products
- 11.2.23.3. SWOT Analysis
- 11.2.23.4. Recent Developments
- 11.2.23.5. Financials (Based on Availability)
- 11.2.24 Princess Sportsgear & Traveller
- 11.2.24.1. Overview
- 11.2.24.2. Products
- 11.2.24.3. SWOT Analysis
- 11.2.24.4. Recent Developments
- 11.2.24.5. Financials (Based on Availability)
- 11.2.25 Ritual Hockey
- 11.2.25.1. Overview
- 11.2.25.2. Products
- 11.2.25.3. SWOT Analysis
- 11.2.25.4. Recent Developments
- 11.2.25.5. Financials (Based on Availability)
- 11.2.1 Savage X Lacrosse
List of Figures
- Figure 1: Global Lacrosse Equipment and Gear Revenue Breakdown (million, %) by Region 2024 & 2032
- Figure 2: Global Lacrosse Equipment and Gear Volume Breakdown (K, %) by Region 2024 & 2032
- Figure 3: North America Lacrosse Equipment and Gear Revenue (million), by Application 2024 & 2032
- Figure 4: North America Lacrosse Equipment and Gear Volume (K), by Application 2024 & 2032
- Figure 5: North America Lacrosse Equipment and Gear Revenue Share (%), by Application 2024 & 2032
- Figure 6: North America Lacrosse Equipment and Gear Volume Share (%), by Application 2024 & 2032
- Figure 7: North America Lacrosse Equipment and Gear Revenue (million), by Types 2024 & 2032
- Figure 8: North America Lacrosse Equipment and Gear Volume (K), by Types 2024 & 2032
- Figure 9: North America Lacrosse Equipment and Gear Revenue Share (%), by Types 2024 & 2032
- Figure 10: North America Lacrosse Equipment and Gear Volume Share (%), by Types 2024 & 2032
- Figure 11: North America Lacrosse Equipment and Gear Revenue (million), by Country 2024 & 2032
- Figure 12: North America Lacrosse Equipment and Gear Volume (K), by Country 2024 & 2032
- Figure 13: North America Lacrosse Equipment and Gear Revenue Share (%), by Country 2024 & 2032
- Figure 14: North America Lacrosse Equipment and Gear Volume Share (%), by Country 2024 & 2032
- Figure 15: South America Lacrosse Equipment and Gear Revenue (million), by Application 2024 & 2032
- Figure 16: South America Lacrosse Equipment and Gear Volume (K), by Application 2024 & 2032
- Figure 17: South America Lacrosse Equipment and Gear Revenue Share (%), by Application 2024 & 2032
- Figure 18: South America Lacrosse Equipment and Gear Volume Share (%), by Application 2024 & 2032
- Figure 19: South America Lacrosse Equipment and Gear Revenue (million), by Types 2024 & 2032
- Figure 20: South America Lacrosse Equipment and Gear Volume (K), by Types 2024 & 2032
- Figure 21: South America Lacrosse Equipment and Gear Revenue Share (%), by Types 2024 & 2032
- Figure 22: South America Lacrosse Equipment and Gear Volume Share (%), by Types 2024 & 2032
- Figure 23: South America Lacrosse Equipment and Gear Revenue (million), by Country 2024 & 2032
- Figure 24: South America Lacrosse Equipment and Gear Volume (K), by Country 2024 & 2032
- Figure 25: South America Lacrosse Equipment and Gear Revenue Share (%), by Country 2024 & 2032
- Figure 26: South America Lacrosse Equipment and Gear Volume Share (%), by Country 2024 & 2032
- Figure 27: Europe Lacrosse Equipment and Gear Revenue (million), by Application 2024 & 2032
- Figure 28: Europe Lacrosse Equipment and Gear Volume (K), by Application 2024 & 2032
- Figure 29: Europe Lacrosse Equipment and Gear Revenue Share (%), by Application 2024 & 2032
- Figure 30: Europe Lacrosse Equipment and Gear Volume Share (%), by Application 2024 & 2032
- Figure 31: Europe Lacrosse Equipment and Gear Revenue (million), by Types 2024 & 2032
- Figure 32: Europe Lacrosse Equipment and Gear Volume (K), by Types 2024 & 2032
- Figure 33: Europe Lacrosse Equipment and Gear Revenue Share (%), by Types 2024 & 2032
- Figure 34: Europe Lacrosse Equipment and Gear Volume Share (%), by Types 2024 & 2032
- Figure 35: Europe Lacrosse Equipment and Gear Revenue (million), by Country 2024 & 2032
- Figure 36: Europe Lacrosse Equipment and Gear Volume (K), by Country 2024 & 2032
- Figure 37: Europe Lacrosse Equipment and Gear Revenue Share (%), by Country 2024 & 2032
- Figure 38: Europe Lacrosse Equipment and Gear Volume Share (%), by Country 2024 & 2032
- Figure 39: Middle East & Africa Lacrosse Equipment and Gear Revenue (million), by Application 2024 & 2032
- Figure 40: Middle East & Africa Lacrosse Equipment and Gear Volume (K), by Application 2024 & 2032
- Figure 41: Middle East & Africa Lacrosse Equipment and Gear Revenue Share (%), by Application 2024 & 2032
- Figure 42: Middle East & Africa Lacrosse Equipment and Gear Volume Share (%), by Application 2024 & 2032
- Figure 43: Middle East & Africa Lacrosse Equipment and Gear Revenue (million), by Types 2024 & 2032
- Figure 44: Middle East & Africa Lacrosse Equipment and Gear Volume (K), by Types 2024 & 2032
- Figure 45: Middle East & Africa Lacrosse Equipment and Gear Revenue Share (%), by Types 2024 & 2032
- Figure 46: Middle East & Africa Lacrosse Equipment and Gear Volume Share (%), by Types 2024 & 2032
- Figure 47: Middle East & Africa Lacrosse Equipment and Gear Revenue (million), by Country 2024 & 2032
- Figure 48: Middle East & Africa Lacrosse Equipment and Gear Volume (K), by Country 2024 & 2032
- Figure 49: Middle East & Africa Lacrosse Equipment and Gear Revenue Share (%), by Country 2024 & 2032
- Figure 50: Middle East & Africa Lacrosse Equipment and Gear Volume Share (%), by Country 2024 & 2032
- Figure 51: Asia Pacific Lacrosse Equipment and Gear Revenue (million), by Application 2024 & 2032
- Figure 52: Asia Pacific Lacrosse Equipment and Gear Volume (K), by Application 2024 & 2032
- Figure 53: Asia Pacific Lacrosse Equipment and Gear Revenue Share (%), by Application 2024 & 2032
- Figure 54: Asia Pacific Lacrosse Equipment and Gear Volume Share (%), by Application 2024 & 2032
- Figure 55: Asia Pacific Lacrosse Equipment and Gear Revenue (million), by Types 2024 & 2032
- Figure 56: Asia Pacific Lacrosse Equipment and Gear Volume (K), by Types 2024 & 2032
- Figure 57: Asia Pacific Lacrosse Equipment and Gear Revenue Share (%), by Types 2024 & 2032
- Figure 58: Asia Pacific Lacrosse Equipment and Gear Volume Share (%), by Types 2024 & 2032
- Figure 59: Asia Pacific Lacrosse Equipment and Gear Revenue (million), by Country 2024 & 2032
- Figure 60: Asia Pacific Lacrosse Equipment and Gear Volume (K), by Country 2024 & 2032
- Figure 61: Asia Pacific Lacrosse Equipment and Gear Revenue Share (%), by Country 2024 & 2032
- Figure 62: Asia Pacific Lacrosse Equipment and Gear Volume Share (%), by Country 2024 & 2032
List of Tables
- Table 1: Global Lacrosse Equipment and Gear Revenue million Forecast, by Region 2019 & 2032
- Table 2: Global Lacrosse Equipment and Gear Volume K Forecast, by Region 2019 & 2032
- Table 3: Global Lacrosse Equipment and Gear Revenue million Forecast, by Application 2019 & 2032
- Table 4: Global Lacrosse Equipment and Gear Volume K Forecast, by Application 2019 & 2032
- Table 5: Global Lacrosse Equipment and Gear Revenue million Forecast, by Types 2019 & 2032
- Table 6: Global Lacrosse Equipment and Gear Volume K Forecast, by Types 2019 & 2032
- Table 7: Global Lacrosse Equipment and Gear Revenue million Forecast, by Region 2019 & 2032
- Table 8: Global Lacrosse Equipment and Gear Volume K Forecast, by Region 2019 & 2032
- Table 9: Global Lacrosse Equipment and Gear Revenue million Forecast, by Application 2019 & 2032
- Table 10: Global Lacrosse Equipment and Gear Volume K Forecast, by Application 2019 & 2032
- Table 11: Global Lacrosse Equipment and Gear Revenue million Forecast, by Types 2019 & 2032
- Table 12: Global Lacrosse Equipment and Gear Volume K Forecast, by Types 2019 & 2032
- Table 13: Global Lacrosse Equipment and Gear Revenue million Forecast, by Country 2019 & 2032
- Table 14: Global Lacrosse Equipment and Gear Volume K Forecast, by Country 2019 & 2032
- Table 15: United States Lacrosse Equipment and Gear Revenue (million) Forecast, by Application 2019 & 2032
- Table 16: United States Lacrosse Equipment and Gear Volume (K) Forecast, by Application 2019 & 2032
- Table 17: Canada Lacrosse Equipment and Gear Revenue (million) Forecast, by Application 2019 & 2032
- Table 18: Canada Lacrosse Equipment and Gear Volume (K) Forecast, by Application 2019 & 2032
- Table 19: Mexico Lacrosse Equipment and Gear Revenue (million) Forecast, by Application 2019 & 2032
- Table 20: Mexico Lacrosse Equipment and Gear Volume (K) Forecast, by Application 2019 & 2032
- Table 21: Global Lacrosse Equipment and Gear Revenue million Forecast, by Application 2019 & 2032
- Table 22: Global Lacrosse Equipment and Gear Volume K Forecast, by Application 2019 & 2032
- Table 23: Global Lacrosse Equipment and Gear Revenue million Forecast, by Types 2019 & 2032
- Table 24: Global Lacrosse Equipment and Gear Volume K Forecast, by Types 2019 & 2032
- Table 25: Global Lacrosse Equipment and Gear Revenue million Forecast, by Country 2019 & 2032
- Table 26: Global Lacrosse Equipment and Gear Volume K Forecast, by Country 2019 & 2032
- Table 27: Brazil Lacrosse Equipment and Gear Revenue (million) Forecast, by Application 2019 & 2032
- Table 28: Brazil Lacrosse Equipment and Gear Volume (K) Forecast, by Application 2019 & 2032
- Table 29: Argentina Lacrosse Equipment and Gear Revenue (million) Forecast, by Application 2019 & 2032
- Table 30: Argentina Lacrosse Equipment and Gear Volume (K) Forecast, by Application 2019 & 2032
- Table 31: Rest of South America Lacrosse Equipment and Gear Revenue (million) Forecast, by Application 2019 & 2032
- Table 32: Rest of South America Lacrosse Equipment and Gear Volume (K) Forecast, by Application 2019 & 2032
- Table 33: Global Lacrosse Equipment and Gear Revenue million Forecast, by Application 2019 & 2032
- Table 34: Global Lacrosse Equipment and Gear Volume K Forecast, by Application 2019 & 2032
- Table 35: Global Lacrosse Equipment and Gear Revenue million Forecast, by Types 2019 & 2032
- Table 36: Global Lacrosse Equipment and Gear Volume K Forecast, by Types 2019 & 2032
- Table 37: Global Lacrosse Equipment and Gear Revenue million Forecast, by Country 2019 & 2032
- Table 38: Global Lacrosse Equipment and Gear Volume K Forecast, by Country 2019 & 2032
- Table 39: United Kingdom Lacrosse Equipment and Gear Revenue (million) Forecast, by Application 2019 & 2032
- Table 40: United Kingdom Lacrosse Equipment and Gear Volume (K) Forecast, by Application 2019 & 2032
- Table 41: Germany Lacrosse Equipment and Gear Revenue (million) Forecast, by Application 2019 & 2032
- Table 42: Germany Lacrosse Equipment and Gear Volume (K) Forecast, by Application 2019 & 2032
- Table 43: France Lacrosse Equipment and Gear Revenue (million) Forecast, by Application 2019 & 2032
- Table 44: France Lacrosse Equipment and Gear Volume (K) Forecast, by Application 2019 & 2032
- Table 45: Italy Lacrosse Equipment and Gear Revenue (million) Forecast, by Application 2019 & 2032
- Table 46: Italy Lacrosse Equipment and Gear Volume (K) Forecast, by Application 2019 & 2032
- Table 47: Spain Lacrosse Equipment and Gear Revenue (million) Forecast, by Application 2019 & 2032
- Table 48: Spain Lacrosse Equipment and Gear Volume (K) Forecast, by Application 2019 & 2032
- Table 49: Russia Lacrosse Equipment and Gear Revenue (million) Forecast, by Application 2019 & 2032
- Table 50: Russia Lacrosse Equipment and Gear Volume (K) Forecast, by Application 2019 & 2032
- Table 51: Benelux Lacrosse Equipment and Gear Revenue (million) Forecast, by Application 2019 & 2032
- Table 52: Benelux Lacrosse Equipment and Gear Volume (K) Forecast, by Application 2019 & 2032
- Table 53: Nordics Lacrosse Equipment and Gear Revenue (million) Forecast, by Application 2019 & 2032
- Table 54: Nordics Lacrosse Equipment and Gear Volume (K) Forecast, by Application 2019 & 2032
- Table 55: Rest of Europe Lacrosse Equipment and Gear Revenue (million) Forecast, by Application 2019 & 2032
- Table 56: Rest of Europe Lacrosse Equipment and Gear Volume (K) Forecast, by Application 2019 & 2032
- Table 57: Global Lacrosse Equipment and Gear Revenue million Forecast, by Application 2019 & 2032
- Table 58: Global Lacrosse Equipment and Gear Volume K Forecast, by Application 2019 & 2032
- Table 59: Global Lacrosse Equipment and Gear Revenue million Forecast, by Types 2019 & 2032
- Table 60: Global Lacrosse Equipment and Gear Volume K Forecast, by Types 2019 & 2032
- Table 61: Global Lacrosse Equipment and Gear Revenue million Forecast, by Country 2019 & 2032
- Table 62: Global Lacrosse Equipment and Gear Volume K Forecast, by Country 2019 & 2032
- Table 63: Turkey Lacrosse Equipment and Gear Revenue (million) Forecast, by Application 2019 & 2032
- Table 64: Turkey Lacrosse Equipment and Gear Volume (K) Forecast, by Application 2019 & 2032
- Table 65: Israel Lacrosse Equipment and Gear Revenue (million) Forecast, by Application 2019 & 2032
- Table 66: Israel Lacrosse Equipment and Gear Volume (K) Forecast, by Application 2019 & 2032
- Table 67: GCC Lacrosse Equipment and Gear Revenue (million) Forecast, by Application 2019 & 2032
- Table 68: GCC Lacrosse Equipment and Gear Volume (K) Forecast, by Application 2019 & 2032
- Table 69: North Africa Lacrosse Equipment and Gear Revenue (million) Forecast, by Application 2019 & 2032
- Table 70: North Africa Lacrosse Equipment and Gear Volume (K) Forecast, by Application 2019 & 2032
- Table 71: South Africa Lacrosse Equipment and Gear Revenue (million) Forecast, by Application 2019 & 2032
- Table 72: South Africa Lacrosse Equipment and Gear Volume (K) Forecast, by Application 2019 & 2032
- Table 73: Rest of Middle East & Africa Lacrosse Equipment and Gear Revenue (million) Forecast, by Application 2019 & 2032
- Table 74: Rest of Middle East & Africa Lacrosse Equipment and Gear Volume (K) Forecast, by Application 2019 & 2032
- Table 75: Global Lacrosse Equipment and Gear Revenue million Forecast, by Application 2019 & 2032
- Table 76: Global Lacrosse Equipment and Gear Volume K Forecast, by Application 2019 & 2032
- Table 77: Global Lacrosse Equipment and Gear Revenue million Forecast, by Types 2019 & 2032
- Table 78: Global Lacrosse Equipment and Gear Volume K Forecast, by Types 2019 & 2032
- Table 79: Global Lacrosse Equipment and Gear Revenue million Forecast, by Country 2019 & 2032
- Table 80: Global Lacrosse Equipment and Gear Volume K Forecast, by Country 2019 & 2032
- Table 81: China Lacrosse Equipment and Gear Revenue (million) Forecast, by Application 2019 & 2032
- Table 82: China Lacrosse Equipment and Gear Volume (K) Forecast, by Application 2019 & 2032
- Table 83: India Lacrosse Equipment and Gear Revenue (million) Forecast, by Application 2019 & 2032
- Table 84: India Lacrosse Equipment and Gear Volume (K) Forecast, by Application 2019 & 2032
- Table 85: Japan Lacrosse Equipment and Gear Revenue (million) Forecast, by Application 2019 & 2032
- Table 86: Japan Lacrosse Equipment and Gear Volume (K) Forecast, by Application 2019 & 2032
- Table 87: South Korea Lacrosse Equipment and Gear Revenue (million) Forecast, by Application 2019 & 2032
- Table 88: South Korea Lacrosse Equipment and Gear Volume (K) Forecast, by Application 2019 & 2032
- Table 89: ASEAN Lacrosse Equipment and Gear Revenue (million) Forecast, by Application 2019 & 2032
- Table 90: ASEAN Lacrosse Equipment and Gear Volume (K) Forecast, by Application 2019 & 2032
- Table 91: Oceania Lacrosse Equipment and Gear Revenue (million) Forecast, by Application 2019 & 2032
- Table 92: Oceania Lacrosse Equipment and Gear Volume (K) Forecast, by Application 2019 & 2032
- Table 93: Rest of Asia Pacific Lacrosse Equipment and Gear Revenue (million) Forecast, by Application 2019 & 2032
- Table 94: Rest of Asia Pacific Lacrosse Equipment and Gear Volume (K) Forecast, by Application 2019 & 2032
Frequently Asked Questions
1. What is the projected Compound Annual Growth Rate (CAGR) of the Lacrosse Equipment and Gear?
The projected CAGR is approximately XX%.
2. Which companies are prominent players in the Lacrosse Equipment and Gear?
Key companies in the market include Savage X Lacrosse, Shenzhen Achieve Sportswear, Warrior Sports, DeBeer Lacrosse, Maverik Lacrosse, Bauer Hockey, Adidas, Sher-Wood, Grays International, Gryphon Hockey, CanAm Underwater Hockey Gear, Easton Hockey, Franklin Sports, ATLAS Hockey, Dita International, Dorsal Gear, Guerilla Hockey, JDH, Kookaburra, MALIK, Mazon Hockey, STX, Tour Hockey, Princess Sportsgear & Traveller, Ritual Hockey.
3. What are the main segments of the Lacrosse Equipment and Gear?
The market segments include Application, Types.
4. Can you provide details about the market size?
The market size is estimated to be USD XXX million as of 2022.
5. What are some drivers contributing to market growth?
N/A
6. What are the notable trends driving market growth?
N/A
7. Are there any restraints impacting market growth?
N/A
8. Can you provide examples of recent developments in the market?
N/A
9. What pricing options are available for accessing the report?
Pricing options include single-user, multi-user, and enterprise licenses priced at USD 3950.00, USD 5925.00, and USD 7900.00 respectively.
10. Is the market size provided in terms of value or volume?
The market size is provided in terms of value, measured in million and volume, measured in K.
11. Are there any specific market keywords associated with the report?
Yes, the market keyword associated with the report is "Lacrosse Equipment and Gear," which aids in identifying and referencing the specific market segment covered.
12. How do I determine which pricing option suits my needs best?
The pricing options vary based on user requirements and access needs. Individual users may opt for single-user licenses, while businesses requiring broader access may choose multi-user or enterprise licenses for cost-effective access to the report.
13. Are there any additional resources or data provided in the Lacrosse Equipment and Gear report?
While the report offers comprehensive insights, it's advisable to review the specific contents or supplementary materials provided to ascertain if additional resources or data are available.
14. How can I stay updated on further developments or reports in the Lacrosse Equipment and Gear?
To stay informed about further developments, trends, and reports in the Lacrosse Equipment and Gear, consider subscribing to industry newsletters, following relevant companies and organizations, or regularly checking reputable industry news sources and publications.
Methodology
Step 1 - Identification of Relevant Samples Size from Population Database


Step 2 - Approaches for Defining Global Market Size (Value, Volume* & Price*)

Note*: In applicable scenarios
Step 3 - Data Sources
Primary Research
- Web Analytics
- Survey Reports
- Research Institute
- Latest Research Reports
- Opinion Leaders
Secondary Research
- Annual Reports
- White Paper
- Latest Press Release
- Industry Association
- Paid Database
- Investor Presentations

Step 4 - Data Triangulation
Involves using different sources of information in order to increase the validity of a study
These sources are likely to be stakeholders in a program - participants, other researchers, program staff, other community members, and so on.
Then we put all data in single framework & apply various statistical tools to find out the dynamic on the market.
During the analysis stage, feedback from the stakeholder groups would be compared to determine areas of agreement as well as areas of divergence


