
Key Insights
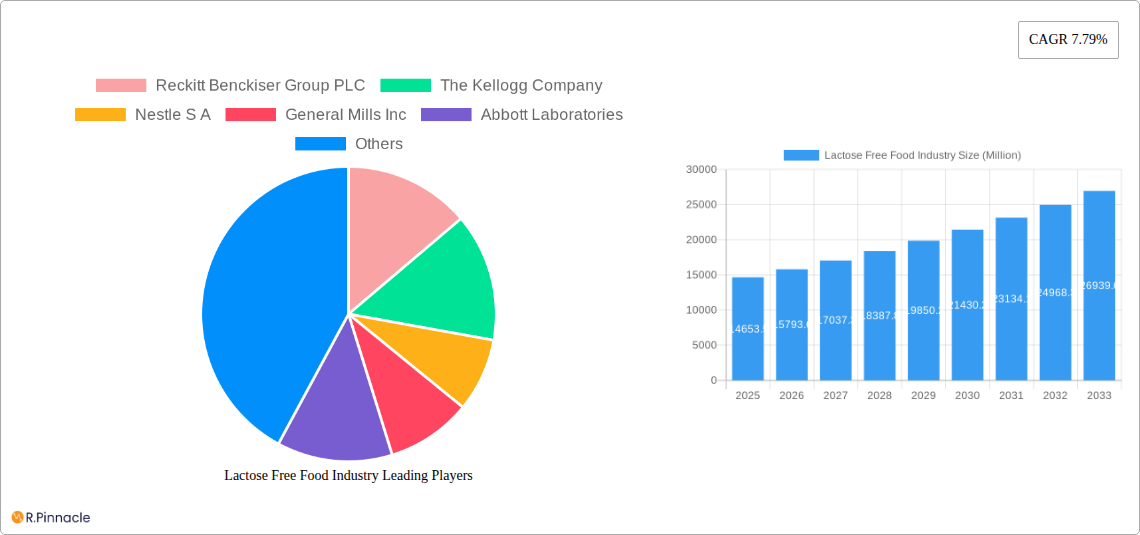
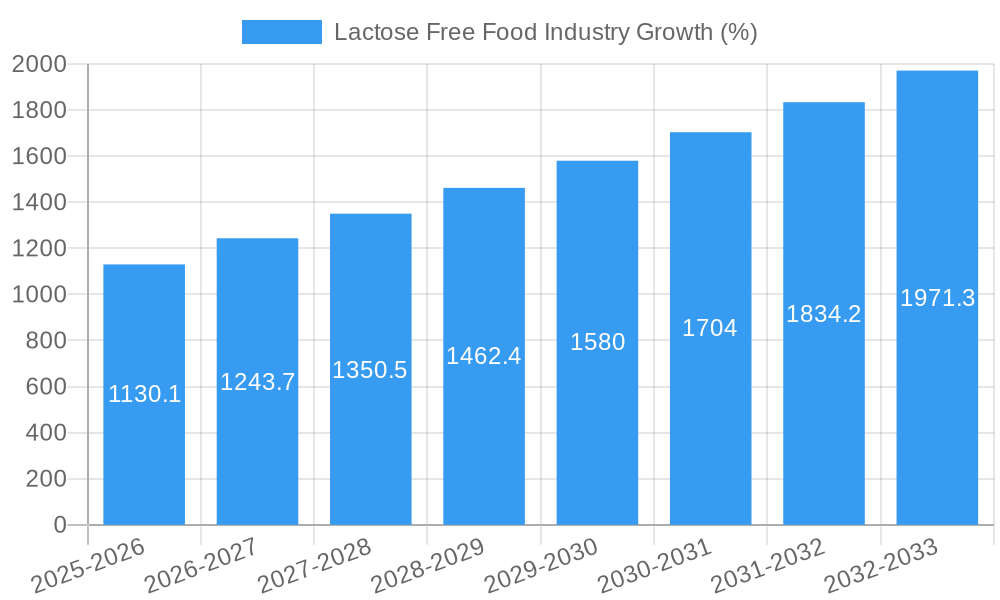
The lactose-free food market, valued at $14,653.5 million in 2025, is experiencing robust growth, projected to expand at a compound annual growth rate (CAGR) of 7.79% from 2025 to 2033. This surge is driven by several key factors. The rising prevalence of lactose intolerance globally, coupled with increased awareness of digestive health and the benefits of a lactose-free diet, fuels significant consumer demand. Furthermore, the expanding availability of lactose-free alternatives across various product categories—from dairy and dairy alternatives like plant-based milks and yogurts to bakery products, confectionery, and sauces—is a crucial driver. The increasing adoption of innovative technologies in food processing and the development of products that mimic the taste and texture of traditional dairy products further enhance market appeal. The growth is also spurred by proactive marketing strategies employed by major players, highlighting the health benefits and taste profiles of their lactose-free offerings. Growing consumer preference for healthier and functional foods also contributes to this upward trajectory.
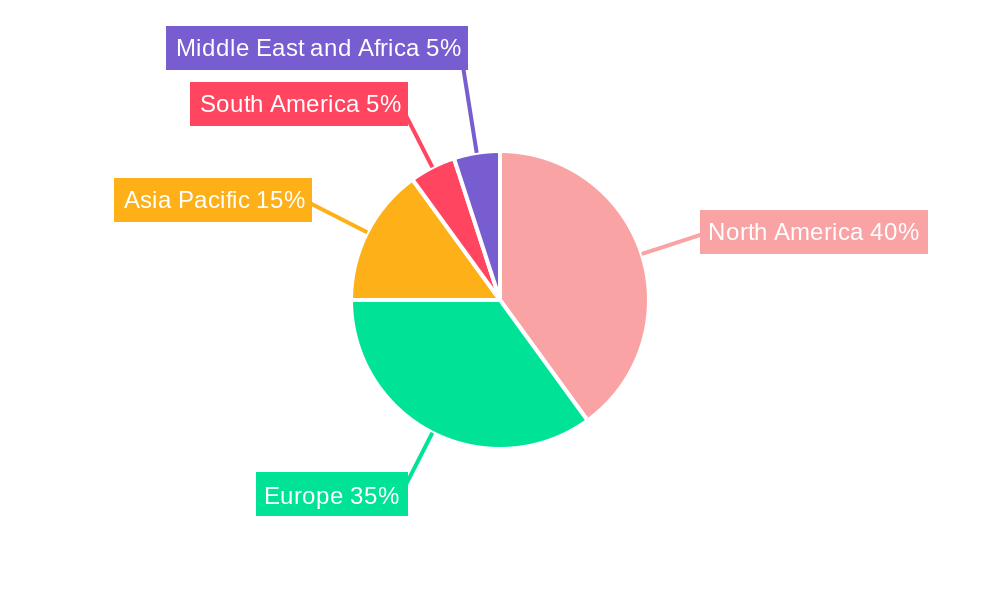
Significant regional variations exist within the market. North America and Europe currently hold substantial market shares, attributed to high levels of lactose intolerance awareness and robust consumer spending on health-conscious products. However, Asia-Pacific presents a promising growth area, fueled by increasing disposable incomes and a growing understanding of the benefits of lactose-free diets. The expansion into online retail channels is also shaping market dynamics, providing greater accessibility and convenience for consumers. Competition remains intense among major players, including Reckitt Benckiser Group PLC, Kellogg's, Nestlé, and General Mills, who are aggressively investing in research and development and brand building to capture a larger market share. The long-term outlook for the lactose-free food market remains exceptionally positive, driven by ongoing technological advancements, evolving consumer preferences, and expanding distribution channels. Continued focus on product innovation and improved accessibility will be crucial for driving future growth.
Lactose-Free Food Industry Report: 2019-2033
This comprehensive report provides a detailed analysis of the lactose-free food industry, offering invaluable insights for industry professionals, investors, and stakeholders. With a focus on market trends, competitive dynamics, and future growth projections, this report is essential for navigating the evolving landscape of this rapidly expanding sector. The study period covers 2019-2033, with a base year of 2025 and a forecast period of 2025-2033. The report utilizes data from the historical period of 2019-2024, projecting a market size exceeding $XX Million by 2033.
Lactose Free Food Industry Market Structure & Innovation Trends
This section analyzes the market concentration, innovation drivers, regulatory frameworks, product substitutes, end-user demographics, and M&A activities within the lactose-free food industry. The market is characterized by a mix of large multinational corporations and smaller niche players. Key players such as Reckitt Benckiser Group PLC, The Kellogg Company, Nestle S.A., General Mills Inc., Abbott Laboratories, Danone SA, Dr Schar AG/SPA, Blue Diamond Growers, Oatly Group AB, and Beyond Meat hold significant market share, though the exact figures vary across segments and regions. The industry is experiencing a surge in innovation, driven by increasing consumer demand for lactose-free products and advancements in food technology.
- Market Concentration: The market exhibits moderate concentration, with several major players controlling a significant portion, but with opportunities for smaller companies to thrive in niche segments.
- Innovation Drivers: Growing consumer awareness of lactose intolerance, health and wellness trends, and technological advancements in dairy alternatives are key drivers.
- Regulatory Frameworks: Government regulations regarding labeling and food safety standards significantly influence market operations.
- Product Substitutes: The rise of plant-based alternatives, such as oat milk and soy milk, poses both a competitive challenge and a growth opportunity.
- End-User Demographics: The target demographic encompasses individuals with lactose intolerance, those following vegan or vegetarian diets, and health-conscious consumers.
- M&A Activities: The industry has seen significant M&A activity in recent years, with deal values totaling an estimated $XX Million, primarily driven by companies seeking to expand their product portfolios and market reach. Examples include the [insert specific M&A examples if available, with deal values].
Lactose Free Food Industry Market Dynamics & Trends
The lactose-free food market is experiencing robust growth, propelled by several key factors. The compound annual growth rate (CAGR) during the forecast period is projected to be XX%, driven by increasing prevalence of lactose intolerance, rising consumer awareness of health benefits, and a growing preference for plant-based alternatives. Market penetration of lactose-free products is also on the rise, particularly in developed countries. Technological advancements in plant-based protein sources and flavor modification are creating opportunities for more palatable and nutritious alternatives. Competitive dynamics are intense, with companies investing heavily in research and development, marketing, and distribution to gain market share. Consumer preferences are shifting towards cleaner labels, sustainable sourcing, and functional benefits, presenting new challenges and opportunities for industry players.
Dominant Regions & Segments in Lactose Free Food Industry
The lactose-free food market exhibits significant regional variations in growth and consumption patterns. [Insert dominant region, e.g., North America] is currently the leading region, followed by [Insert second dominant region, e.g., Europe]. However, developing economies in Asia and Latin America are showing rapid growth potential.
Key Drivers by Segment:
- Product Type: Dairy and dairy alternatives currently dominate the market, followed by bakery products and confectionery products. Growth is expected across all segments.
- Labeling Type: Lactose-free labeling is the primary driver of market growth, with increasing demand for gluten-free and other specialized labeling types.
- Distribution Channel: Supermarkets/hypermarkets remain the dominant distribution channel, with online retail stores exhibiting rapid growth.
Dominance Analysis: The dominance of specific regions and segments is attributed to factors like higher per capita income, greater awareness of lactose intolerance, established distribution networks, and supportive government policies. Further analysis is required to determine the market share of each segment accurately.
Lactose Free Food Industry Product Innovations
The lactose-free food industry showcases continuous product innovation. Technological advancements in fermentation, enzymatic processes, and protein extraction are leading to the development of new and improved dairy alternatives with enhanced flavor profiles, textures, and nutritional values. Companies are increasingly focusing on the development of plant-based products that closely mimic the taste and texture of traditional dairy products, catering to the preferences of lactose-intolerant and dairy-avoiding consumers. This includes the expansion of readily-available options in various product categories.
Report Scope & Segmentation Analysis
This report segments the lactose-free food market based on product type (Bakery Products, Confectionery Products, Dairy and Dairy Alternatives, Meat and Seafood, Sauces, Condiments and Dressings, Other Product Types), labeling type (Gluten-Free Food, Lactose-Free Food, Other Labeling Types), and distribution channel (Supermarkets/Hypermarkets, Convenience/Grocery Stores, Online Retail Stores, Other Distribution Channels). Each segment is analyzed in detail, considering its market size, growth projections, and competitive dynamics. For instance, the dairy and dairy alternatives segment is projected to witness significant growth owing to the increasing availability of plant-based alternatives like almond milk and oat milk.
Key Drivers of Lactose Free Food Industry Growth
The growth of the lactose-free food industry is fueled by several key factors. Firstly, the rising prevalence of lactose intolerance globally is a major driver, creating significant demand for lactose-free alternatives. Secondly, the increasing adoption of plant-based diets due to health and ethical concerns is boosting the market. Thirdly, technological advancements in food processing and formulation are leading to the development of innovative products with improved taste, texture, and nutritional value. Finally, supportive government policies and regulations, such as clear labeling requirements, are also contributing to the industry's expansion.
Challenges in the Lactose Free Food Industry Sector
The lactose-free food industry faces several challenges. Maintaining consistent product quality and taste is crucial, as many plant-based alternatives can lack the creamy texture and rich flavor of traditional dairy products. Furthermore, fluctuations in raw material prices and supply chain disruptions can impact profitability. Competition is intense, with numerous established and emerging players vying for market share. Regulatory hurdles, including labeling requirements and food safety standards, also present challenges for companies operating in this sector. These challenges, in combination, affect market expansion.
Emerging Opportunities in Lactose Free Food Industry
The lactose-free food industry presents various exciting opportunities. The expansion into emerging markets, particularly in developing countries with a growing middle class and increasing awareness of health and wellness, offers significant potential. Moreover, innovation in product development, including the creation of novel plant-based ingredients and sustainable production methods, can open up new avenues for growth. Targeting niche consumer segments with specific dietary needs or preferences, such as organic or functional foods, can also create valuable market niches.
Leading Players in the Lactose Free Food Industry Market
- Reckitt Benckiser Group PLC
- The Kellogg Company
- Nestle S.A.
- General Mills Inc.
- Abbott Laboratories
- Danone SA
- Dr Schar AG / SPA
- Blue Diamond Growers
- Oatly Group AB
- Beyond Meat
Key Developments in Lactose Free Food Industry
- May 2022: Danone launched Nextmilk under the Silk Canada brand, a new dairy-free beverage.
- October 2022: Beyond Meat partnered with Allana Group to introduce plant-based meat products in India.
- February 2023: Life Health Foods Pvt. Ltd. launched So Good Oat unsweetened beverage.
These developments highlight the dynamic nature of the industry and the ongoing efforts by companies to expand their product offerings and market reach.
Future Outlook for Lactose Free Food Industry Market
The future of the lactose-free food industry looks promising. Continued growth is anticipated, driven by the increasing prevalence of lactose intolerance, growing consumer preference for plant-based foods, and ongoing product innovation. The market is expected to witness further consolidation through mergers and acquisitions, as larger companies seek to expand their market share and product portfolios. Technological advancements and sustainable sourcing practices will play a crucial role in shaping the industry's future. The potential for expansion into new markets and the development of novel product categories will further contribute to the industry's growth trajectory.
Lactose Free Food Industry Segmentation
-
1. Product Type
- 1.1. Bakery Products
- 1.2. Confectionery Prodcuts
- 1.3. Dairy and Dairy Alternatives
- 1.4. Meat and Seafood
- 1.5. Sauces, Condiments and Dressings
- 1.6. Other Product Types
-
2. Labeling Type
- 2.1. Gluten-Free Food
- 2.2. Lactose-Free Food
- 2.3. Other Labeling Types
-
3. Distribution Channel
- 3.1. Supermarkets/Hypermarkets
- 3.2. Convenience/Grocery Stores
- 3.3. Online Retail Stores
- 3.4. Other Distribution Channels
Lactose Free Food Industry Segmentation By Geography
-
1. North America
- 1.1. United States
- 1.2. Canada
- 1.3. Mexico
- 1.4. Rest of North America
-
2. Europe
- 2.1. Spain
- 2.2. United Kingdom
- 2.3. Germany
- 2.4. France
- 2.5. Italy
- 2.6. Russia
- 2.7. Rest of Europe
-
3. Asia Pacific
- 3.1. China
- 3.2. Japan
- 3.3. India
- 3.4. Australia
- 3.5. Rest of Asia Pacific
-
4. South America
- 4.1. Brazil
- 4.2. Argentina
- 4.3. Rest of South America
-
5. Middle East and Africa
- 5.1. South Africa
- 5.2. United Arab Emirates
- 5.3. Rest of Middle East and Africa
Lactose Free Food Industry REPORT HIGHLIGHTS
| Aspects | Details |
|---|---|
| Study Period | 2019-2033 |
| Base Year | 2024 |
| Estimated Year | 2025 |
| Forecast Period | 2025-2033 |
| Historical Period | 2019-2024 |
| Growth Rate | CAGR of 7.79% from 2019-2033 |
| Segmentation |
|
Table of Contents
- 1. Introduction
- 1.1. Research Scope
- 1.2. Market Segmentation
- 1.3. Research Methodology
- 1.4. Definitions and Assumptions
- 2. Executive Summary
- 2.1. Introduction
- 3. Market Dynamics
- 3.1. Introduction
- 3.2. Market Drivers
- 3.2.1. Increasing Demand for Clean Label Ingredients; Growing Health Consciousness of Consumers
- 3.3. Market Restrains
- 3.3.1. Higher Manufacturing Cost
- 3.4. Market Trends
- 3.4.1. Surge in Demand of Clean Label and Free From Ingredients
- 4. Market Factor Analysis
- 4.1. Porters Five Forces
- 4.2. Supply/Value Chain
- 4.3. PESTEL analysis
- 4.4. Market Entropy
- 4.5. Patent/Trademark Analysis
- 5. Global Lactose Free Food Industry Analysis, Insights and Forecast, 2019-2031
- 5.1. Market Analysis, Insights and Forecast - by Product Type
- 5.1.1. Bakery Products
- 5.1.2. Confectionery Prodcuts
- 5.1.3. Dairy and Dairy Alternatives
- 5.1.4. Meat and Seafood
- 5.1.5. Sauces, Condiments and Dressings
- 5.1.6. Other Product Types
- 5.2. Market Analysis, Insights and Forecast - by Labeling Type
- 5.2.1. Gluten-Free Food
- 5.2.2. Lactose-Free Food
- 5.2.3. Other Labeling Types
- 5.3. Market Analysis, Insights and Forecast - by Distribution Channel
- 5.3.1. Supermarkets/Hypermarkets
- 5.3.2. Convenience/Grocery Stores
- 5.3.3. Online Retail Stores
- 5.3.4. Other Distribution Channels
- 5.4. Market Analysis, Insights and Forecast - by Region
- 5.4.1. North America
- 5.4.2. Europe
- 5.4.3. Asia Pacific
- 5.4.4. South America
- 5.4.5. Middle East and Africa
- 5.1. Market Analysis, Insights and Forecast - by Product Type
- 6. North America Lactose Free Food Industry Analysis, Insights and Forecast, 2019-2031
- 6.1. Market Analysis, Insights and Forecast - by Product Type
- 6.1.1. Bakery Products
- 6.1.2. Confectionery Prodcuts
- 6.1.3. Dairy and Dairy Alternatives
- 6.1.4. Meat and Seafood
- 6.1.5. Sauces, Condiments and Dressings
- 6.1.6. Other Product Types
- 6.2. Market Analysis, Insights and Forecast - by Labeling Type
- 6.2.1. Gluten-Free Food
- 6.2.2. Lactose-Free Food
- 6.2.3. Other Labeling Types
- 6.3. Market Analysis, Insights and Forecast - by Distribution Channel
- 6.3.1. Supermarkets/Hypermarkets
- 6.3.2. Convenience/Grocery Stores
- 6.3.3. Online Retail Stores
- 6.3.4. Other Distribution Channels
- 6.1. Market Analysis, Insights and Forecast - by Product Type
- 7. Europe Lactose Free Food Industry Analysis, Insights and Forecast, 2019-2031
- 7.1. Market Analysis, Insights and Forecast - by Product Type
- 7.1.1. Bakery Products
- 7.1.2. Confectionery Prodcuts
- 7.1.3. Dairy and Dairy Alternatives
- 7.1.4. Meat and Seafood
- 7.1.5. Sauces, Condiments and Dressings
- 7.1.6. Other Product Types
- 7.2. Market Analysis, Insights and Forecast - by Labeling Type
- 7.2.1. Gluten-Free Food
- 7.2.2. Lactose-Free Food
- 7.2.3. Other Labeling Types
- 7.3. Market Analysis, Insights and Forecast - by Distribution Channel
- 7.3.1. Supermarkets/Hypermarkets
- 7.3.2. Convenience/Grocery Stores
- 7.3.3. Online Retail Stores
- 7.3.4. Other Distribution Channels
- 7.1. Market Analysis, Insights and Forecast - by Product Type
- 8. Asia Pacific Lactose Free Food Industry Analysis, Insights and Forecast, 2019-2031
- 8.1. Market Analysis, Insights and Forecast - by Product Type
- 8.1.1. Bakery Products
- 8.1.2. Confectionery Prodcuts
- 8.1.3. Dairy and Dairy Alternatives
- 8.1.4. Meat and Seafood
- 8.1.5. Sauces, Condiments and Dressings
- 8.1.6. Other Product Types
- 8.2. Market Analysis, Insights and Forecast - by Labeling Type
- 8.2.1. Gluten-Free Food
- 8.2.2. Lactose-Free Food
- 8.2.3. Other Labeling Types
- 8.3. Market Analysis, Insights and Forecast - by Distribution Channel
- 8.3.1. Supermarkets/Hypermarkets
- 8.3.2. Convenience/Grocery Stores
- 8.3.3. Online Retail Stores
- 8.3.4. Other Distribution Channels
- 8.1. Market Analysis, Insights and Forecast - by Product Type
- 9. South America Lactose Free Food Industry Analysis, Insights and Forecast, 2019-2031
- 9.1. Market Analysis, Insights and Forecast - by Product Type
- 9.1.1. Bakery Products
- 9.1.2. Confectionery Prodcuts
- 9.1.3. Dairy and Dairy Alternatives
- 9.1.4. Meat and Seafood
- 9.1.5. Sauces, Condiments and Dressings
- 9.1.6. Other Product Types
- 9.2. Market Analysis, Insights and Forecast - by Labeling Type
- 9.2.1. Gluten-Free Food
- 9.2.2. Lactose-Free Food
- 9.2.3. Other Labeling Types
- 9.3. Market Analysis, Insights and Forecast - by Distribution Channel
- 9.3.1. Supermarkets/Hypermarkets
- 9.3.2. Convenience/Grocery Stores
- 9.3.3. Online Retail Stores
- 9.3.4. Other Distribution Channels
- 9.1. Market Analysis, Insights and Forecast - by Product Type
- 10. Middle East and Africa Lactose Free Food Industry Analysis, Insights and Forecast, 2019-2031
- 10.1. Market Analysis, Insights and Forecast - by Product Type
- 10.1.1. Bakery Products
- 10.1.2. Confectionery Prodcuts
- 10.1.3. Dairy and Dairy Alternatives
- 10.1.4. Meat and Seafood
- 10.1.5. Sauces, Condiments and Dressings
- 10.1.6. Other Product Types
- 10.2. Market Analysis, Insights and Forecast - by Labeling Type
- 10.2.1. Gluten-Free Food
- 10.2.2. Lactose-Free Food
- 10.2.3. Other Labeling Types
- 10.3. Market Analysis, Insights and Forecast - by Distribution Channel
- 10.3.1. Supermarkets/Hypermarkets
- 10.3.2. Convenience/Grocery Stores
- 10.3.3. Online Retail Stores
- 10.3.4. Other Distribution Channels
- 10.1. Market Analysis, Insights and Forecast - by Product Type
- 11. North America Lactose Free Food Industry Analysis, Insights and Forecast, 2019-2031
- 11.1. Market Analysis, Insights and Forecast - By Country/Sub-region
- 11.1.1 United States
- 11.1.2 Canada
- 11.1.3 Mexico
- 11.1.4 Rest of North America
- 12. Europe Lactose Free Food Industry Analysis, Insights and Forecast, 2019-2031
- 12.1. Market Analysis, Insights and Forecast - By Country/Sub-region
- 12.1.1 Spain
- 12.1.2 United Kingdom
- 12.1.3 Germany
- 12.1.4 France
- 12.1.5 Italy
- 12.1.6 Russia
- 12.1.7 Rest of Europe
- 13. Asia Pacific Lactose Free Food Industry Analysis, Insights and Forecast, 2019-2031
- 13.1. Market Analysis, Insights and Forecast - By Country/Sub-region
- 13.1.1 China
- 13.1.2 Japan
- 13.1.3 India
- 13.1.4 Australia
- 13.1.5 Rest of Asia Pacific
- 14. South America Lactose Free Food Industry Analysis, Insights and Forecast, 2019-2031
- 14.1. Market Analysis, Insights and Forecast - By Country/Sub-region
- 14.1.1 Brazil
- 14.1.2 Argentina
- 14.1.3 Rest of South America
- 15. Middle East and Africa Lactose Free Food Industry Analysis, Insights and Forecast, 2019-2031
- 15.1. Market Analysis, Insights and Forecast - By Country/Sub-region
- 15.1.1 South Africa
- 15.1.2 United Arab Emirates
- 15.1.3 Rest of Middle East and Africa
- 16. Competitive Analysis
- 16.1. Global Market Share Analysis 2024
- 16.2. Company Profiles
- 16.2.1 Reckitt Benckiser Group PLC
- 16.2.1.1. Overview
- 16.2.1.2. Products
- 16.2.1.3. SWOT Analysis
- 16.2.1.4. Recent Developments
- 16.2.1.5. Financials (Based on Availability)
- 16.2.2 The Kellogg Company
- 16.2.2.1. Overview
- 16.2.2.2. Products
- 16.2.2.3. SWOT Analysis
- 16.2.2.4. Recent Developments
- 16.2.2.5. Financials (Based on Availability)
- 16.2.3 Nestle S A
- 16.2.3.1. Overview
- 16.2.3.2. Products
- 16.2.3.3. SWOT Analysis
- 16.2.3.4. Recent Developments
- 16.2.3.5. Financials (Based on Availability)
- 16.2.4 General Mills Inc
- 16.2.4.1. Overview
- 16.2.4.2. Products
- 16.2.4.3. SWOT Analysis
- 16.2.4.4. Recent Developments
- 16.2.4.5. Financials (Based on Availability)
- 16.2.5 Abbott Laboratories
- 16.2.5.1. Overview
- 16.2.5.2. Products
- 16.2.5.3. SWOT Analysis
- 16.2.5.4. Recent Developments
- 16.2.5.5. Financials (Based on Availability)
- 16.2.6 Danone SA
- 16.2.6.1. Overview
- 16.2.6.2. Products
- 16.2.6.3. SWOT Analysis
- 16.2.6.4. Recent Developments
- 16.2.6.5. Financials (Based on Availability)
- 16.2.7 Dr Schar AG / SPA*List Not Exhaustive
- 16.2.7.1. Overview
- 16.2.7.2. Products
- 16.2.7.3. SWOT Analysis
- 16.2.7.4. Recent Developments
- 16.2.7.5. Financials (Based on Availability)
- 16.2.8 Blue Diamond Growers
- 16.2.8.1. Overview
- 16.2.8.2. Products
- 16.2.8.3. SWOT Analysis
- 16.2.8.4. Recent Developments
- 16.2.8.5. Financials (Based on Availability)
- 16.2.9 Oatly Group AB
- 16.2.9.1. Overview
- 16.2.9.2. Products
- 16.2.9.3. SWOT Analysis
- 16.2.9.4. Recent Developments
- 16.2.9.5. Financials (Based on Availability)
- 16.2.10 Beyond Meat
- 16.2.10.1. Overview
- 16.2.10.2. Products
- 16.2.10.3. SWOT Analysis
- 16.2.10.4. Recent Developments
- 16.2.10.5. Financials (Based on Availability)
- 16.2.1 Reckitt Benckiser Group PLC
List of Figures
- Figure 1: Global Lactose Free Food Industry Revenue Breakdown (Million, %) by Region 2024 & 2032
- Figure 2: Global Lactose Free Food Industry Volume Breakdown (K Tons, %) by Region 2024 & 2032
- Figure 3: North America Lactose Free Food Industry Revenue (Million), by Country 2024 & 2032
- Figure 4: North America Lactose Free Food Industry Volume (K Tons), by Country 2024 & 2032
- Figure 5: North America Lactose Free Food Industry Revenue Share (%), by Country 2024 & 2032
- Figure 6: North America Lactose Free Food Industry Volume Share (%), by Country 2024 & 2032
- Figure 7: Europe Lactose Free Food Industry Revenue (Million), by Country 2024 & 2032
- Figure 8: Europe Lactose Free Food Industry Volume (K Tons), by Country 2024 & 2032
- Figure 9: Europe Lactose Free Food Industry Revenue Share (%), by Country 2024 & 2032
- Figure 10: Europe Lactose Free Food Industry Volume Share (%), by Country 2024 & 2032
- Figure 11: Asia Pacific Lactose Free Food Industry Revenue (Million), by Country 2024 & 2032
- Figure 12: Asia Pacific Lactose Free Food Industry Volume (K Tons), by Country 2024 & 2032
- Figure 13: Asia Pacific Lactose Free Food Industry Revenue Share (%), by Country 2024 & 2032
- Figure 14: Asia Pacific Lactose Free Food Industry Volume Share (%), by Country 2024 & 2032
- Figure 15: South America Lactose Free Food Industry Revenue (Million), by Country 2024 & 2032
- Figure 16: South America Lactose Free Food Industry Volume (K Tons), by Country 2024 & 2032
- Figure 17: South America Lactose Free Food Industry Revenue Share (%), by Country 2024 & 2032
- Figure 18: South America Lactose Free Food Industry Volume Share (%), by Country 2024 & 2032
- Figure 19: Middle East and Africa Lactose Free Food Industry Revenue (Million), by Country 2024 & 2032
- Figure 20: Middle East and Africa Lactose Free Food Industry Volume (K Tons), by Country 2024 & 2032
- Figure 21: Middle East and Africa Lactose Free Food Industry Revenue Share (%), by Country 2024 & 2032
- Figure 22: Middle East and Africa Lactose Free Food Industry Volume Share (%), by Country 2024 & 2032
- Figure 23: North America Lactose Free Food Industry Revenue (Million), by Product Type 2024 & 2032
- Figure 24: North America Lactose Free Food Industry Volume (K Tons), by Product Type 2024 & 2032
- Figure 25: North America Lactose Free Food Industry Revenue Share (%), by Product Type 2024 & 2032
- Figure 26: North America Lactose Free Food Industry Volume Share (%), by Product Type 2024 & 2032
- Figure 27: North America Lactose Free Food Industry Revenue (Million), by Labeling Type 2024 & 2032
- Figure 28: North America Lactose Free Food Industry Volume (K Tons), by Labeling Type 2024 & 2032
- Figure 29: North America Lactose Free Food Industry Revenue Share (%), by Labeling Type 2024 & 2032
- Figure 30: North America Lactose Free Food Industry Volume Share (%), by Labeling Type 2024 & 2032
- Figure 31: North America Lactose Free Food Industry Revenue (Million), by Distribution Channel 2024 & 2032
- Figure 32: North America Lactose Free Food Industry Volume (K Tons), by Distribution Channel 2024 & 2032
- Figure 33: North America Lactose Free Food Industry Revenue Share (%), by Distribution Channel 2024 & 2032
- Figure 34: North America Lactose Free Food Industry Volume Share (%), by Distribution Channel 2024 & 2032
- Figure 35: North America Lactose Free Food Industry Revenue (Million), by Country 2024 & 2032
- Figure 36: North America Lactose Free Food Industry Volume (K Tons), by Country 2024 & 2032
- Figure 37: North America Lactose Free Food Industry Revenue Share (%), by Country 2024 & 2032
- Figure 38: North America Lactose Free Food Industry Volume Share (%), by Country 2024 & 2032
- Figure 39: Europe Lactose Free Food Industry Revenue (Million), by Product Type 2024 & 2032
- Figure 40: Europe Lactose Free Food Industry Volume (K Tons), by Product Type 2024 & 2032
- Figure 41: Europe Lactose Free Food Industry Revenue Share (%), by Product Type 2024 & 2032
- Figure 42: Europe Lactose Free Food Industry Volume Share (%), by Product Type 2024 & 2032
- Figure 43: Europe Lactose Free Food Industry Revenue (Million), by Labeling Type 2024 & 2032
- Figure 44: Europe Lactose Free Food Industry Volume (K Tons), by Labeling Type 2024 & 2032
- Figure 45: Europe Lactose Free Food Industry Revenue Share (%), by Labeling Type 2024 & 2032
- Figure 46: Europe Lactose Free Food Industry Volume Share (%), by Labeling Type 2024 & 2032
- Figure 47: Europe Lactose Free Food Industry Revenue (Million), by Distribution Channel 2024 & 2032
- Figure 48: Europe Lactose Free Food Industry Volume (K Tons), by Distribution Channel 2024 & 2032
- Figure 49: Europe Lactose Free Food Industry Revenue Share (%), by Distribution Channel 2024 & 2032
- Figure 50: Europe Lactose Free Food Industry Volume Share (%), by Distribution Channel 2024 & 2032
- Figure 51: Europe Lactose Free Food Industry Revenue (Million), by Country 2024 & 2032
- Figure 52: Europe Lactose Free Food Industry Volume (K Tons), by Country 2024 & 2032
- Figure 53: Europe Lactose Free Food Industry Revenue Share (%), by Country 2024 & 2032
- Figure 54: Europe Lactose Free Food Industry Volume Share (%), by Country 2024 & 2032
- Figure 55: Asia Pacific Lactose Free Food Industry Revenue (Million), by Product Type 2024 & 2032
- Figure 56: Asia Pacific Lactose Free Food Industry Volume (K Tons), by Product Type 2024 & 2032
- Figure 57: Asia Pacific Lactose Free Food Industry Revenue Share (%), by Product Type 2024 & 2032
- Figure 58: Asia Pacific Lactose Free Food Industry Volume Share (%), by Product Type 2024 & 2032
- Figure 59: Asia Pacific Lactose Free Food Industry Revenue (Million), by Labeling Type 2024 & 2032
- Figure 60: Asia Pacific Lactose Free Food Industry Volume (K Tons), by Labeling Type 2024 & 2032
- Figure 61: Asia Pacific Lactose Free Food Industry Revenue Share (%), by Labeling Type 2024 & 2032
- Figure 62: Asia Pacific Lactose Free Food Industry Volume Share (%), by Labeling Type 2024 & 2032
- Figure 63: Asia Pacific Lactose Free Food Industry Revenue (Million), by Distribution Channel 2024 & 2032
- Figure 64: Asia Pacific Lactose Free Food Industry Volume (K Tons), by Distribution Channel 2024 & 2032
- Figure 65: Asia Pacific Lactose Free Food Industry Revenue Share (%), by Distribution Channel 2024 & 2032
- Figure 66: Asia Pacific Lactose Free Food Industry Volume Share (%), by Distribution Channel 2024 & 2032
- Figure 67: Asia Pacific Lactose Free Food Industry Revenue (Million), by Country 2024 & 2032
- Figure 68: Asia Pacific Lactose Free Food Industry Volume (K Tons), by Country 2024 & 2032
- Figure 69: Asia Pacific Lactose Free Food Industry Revenue Share (%), by Country 2024 & 2032
- Figure 70: Asia Pacific Lactose Free Food Industry Volume Share (%), by Country 2024 & 2032
- Figure 71: South America Lactose Free Food Industry Revenue (Million), by Product Type 2024 & 2032
- Figure 72: South America Lactose Free Food Industry Volume (K Tons), by Product Type 2024 & 2032
- Figure 73: South America Lactose Free Food Industry Revenue Share (%), by Product Type 2024 & 2032
- Figure 74: South America Lactose Free Food Industry Volume Share (%), by Product Type 2024 & 2032
- Figure 75: South America Lactose Free Food Industry Revenue (Million), by Labeling Type 2024 & 2032
- Figure 76: South America Lactose Free Food Industry Volume (K Tons), by Labeling Type 2024 & 2032
- Figure 77: South America Lactose Free Food Industry Revenue Share (%), by Labeling Type 2024 & 2032
- Figure 78: South America Lactose Free Food Industry Volume Share (%), by Labeling Type 2024 & 2032
- Figure 79: South America Lactose Free Food Industry Revenue (Million), by Distribution Channel 2024 & 2032
- Figure 80: South America Lactose Free Food Industry Volume (K Tons), by Distribution Channel 2024 & 2032
- Figure 81: South America Lactose Free Food Industry Revenue Share (%), by Distribution Channel 2024 & 2032
- Figure 82: South America Lactose Free Food Industry Volume Share (%), by Distribution Channel 2024 & 2032
- Figure 83: South America Lactose Free Food Industry Revenue (Million), by Country 2024 & 2032
- Figure 84: South America Lactose Free Food Industry Volume (K Tons), by Country 2024 & 2032
- Figure 85: South America Lactose Free Food Industry Revenue Share (%), by Country 2024 & 2032
- Figure 86: South America Lactose Free Food Industry Volume Share (%), by Country 2024 & 2032
- Figure 87: Middle East and Africa Lactose Free Food Industry Revenue (Million), by Product Type 2024 & 2032
- Figure 88: Middle East and Africa Lactose Free Food Industry Volume (K Tons), by Product Type 2024 & 2032
- Figure 89: Middle East and Africa Lactose Free Food Industry Revenue Share (%), by Product Type 2024 & 2032
- Figure 90: Middle East and Africa Lactose Free Food Industry Volume Share (%), by Product Type 2024 & 2032
- Figure 91: Middle East and Africa Lactose Free Food Industry Revenue (Million), by Labeling Type 2024 & 2032
- Figure 92: Middle East and Africa Lactose Free Food Industry Volume (K Tons), by Labeling Type 2024 & 2032
- Figure 93: Middle East and Africa Lactose Free Food Industry Revenue Share (%), by Labeling Type 2024 & 2032
- Figure 94: Middle East and Africa Lactose Free Food Industry Volume Share (%), by Labeling Type 2024 & 2032
- Figure 95: Middle East and Africa Lactose Free Food Industry Revenue (Million), by Distribution Channel 2024 & 2032
- Figure 96: Middle East and Africa Lactose Free Food Industry Volume (K Tons), by Distribution Channel 2024 & 2032
- Figure 97: Middle East and Africa Lactose Free Food Industry Revenue Share (%), by Distribution Channel 2024 & 2032
- Figure 98: Middle East and Africa Lactose Free Food Industry Volume Share (%), by Distribution Channel 2024 & 2032
- Figure 99: Middle East and Africa Lactose Free Food Industry Revenue (Million), by Country 2024 & 2032
- Figure 100: Middle East and Africa Lactose Free Food Industry Volume (K Tons), by Country 2024 & 2032
- Figure 101: Middle East and Africa Lactose Free Food Industry Revenue Share (%), by Country 2024 & 2032
- Figure 102: Middle East and Africa Lactose Free Food Industry Volume Share (%), by Country 2024 & 2032
List of Tables
- Table 1: Global Lactose Free Food Industry Revenue Million Forecast, by Region 2019 & 2032
- Table 2: Global Lactose Free Food Industry Volume K Tons Forecast, by Region 2019 & 2032
- Table 3: Global Lactose Free Food Industry Revenue Million Forecast, by Product Type 2019 & 2032
- Table 4: Global Lactose Free Food Industry Volume K Tons Forecast, by Product Type 2019 & 2032
- Table 5: Global Lactose Free Food Industry Revenue Million Forecast, by Labeling Type 2019 & 2032
- Table 6: Global Lactose Free Food Industry Volume K Tons Forecast, by Labeling Type 2019 & 2032
- Table 7: Global Lactose Free Food Industry Revenue Million Forecast, by Distribution Channel 2019 & 2032
- Table 8: Global Lactose Free Food Industry Volume K Tons Forecast, by Distribution Channel 2019 & 2032
- Table 9: Global Lactose Free Food Industry Revenue Million Forecast, by Region 2019 & 2032
- Table 10: Global Lactose Free Food Industry Volume K Tons Forecast, by Region 2019 & 2032
- Table 11: Global Lactose Free Food Industry Revenue Million Forecast, by Country 2019 & 2032
- Table 12: Global Lactose Free Food Industry Volume K Tons Forecast, by Country 2019 & 2032
- Table 13: United States Lactose Free Food Industry Revenue (Million) Forecast, by Application 2019 & 2032
- Table 14: United States Lactose Free Food Industry Volume (K Tons) Forecast, by Application 2019 & 2032
- Table 15: Canada Lactose Free Food Industry Revenue (Million) Forecast, by Application 2019 & 2032
- Table 16: Canada Lactose Free Food Industry Volume (K Tons) Forecast, by Application 2019 & 2032
- Table 17: Mexico Lactose Free Food Industry Revenue (Million) Forecast, by Application 2019 & 2032
- Table 18: Mexico Lactose Free Food Industry Volume (K Tons) Forecast, by Application 2019 & 2032
- Table 19: Rest of North America Lactose Free Food Industry Revenue (Million) Forecast, by Application 2019 & 2032
- Table 20: Rest of North America Lactose Free Food Industry Volume (K Tons) Forecast, by Application 2019 & 2032
- Table 21: Global Lactose Free Food Industry Revenue Million Forecast, by Country 2019 & 2032
- Table 22: Global Lactose Free Food Industry Volume K Tons Forecast, by Country 2019 & 2032
- Table 23: Spain Lactose Free Food Industry Revenue (Million) Forecast, by Application 2019 & 2032
- Table 24: Spain Lactose Free Food Industry Volume (K Tons) Forecast, by Application 2019 & 2032
- Table 25: United Kingdom Lactose Free Food Industry Revenue (Million) Forecast, by Application 2019 & 2032
- Table 26: United Kingdom Lactose Free Food Industry Volume (K Tons) Forecast, by Application 2019 & 2032
- Table 27: Germany Lactose Free Food Industry Revenue (Million) Forecast, by Application 2019 & 2032
- Table 28: Germany Lactose Free Food Industry Volume (K Tons) Forecast, by Application 2019 & 2032
- Table 29: France Lactose Free Food Industry Revenue (Million) Forecast, by Application 2019 & 2032
- Table 30: France Lactose Free Food Industry Volume (K Tons) Forecast, by Application 2019 & 2032
- Table 31: Italy Lactose Free Food Industry Revenue (Million) Forecast, by Application 2019 & 2032
- Table 32: Italy Lactose Free Food Industry Volume (K Tons) Forecast, by Application 2019 & 2032
- Table 33: Russia Lactose Free Food Industry Revenue (Million) Forecast, by Application 2019 & 2032
- Table 34: Russia Lactose Free Food Industry Volume (K Tons) Forecast, by Application 2019 & 2032
- Table 35: Rest of Europe Lactose Free Food Industry Revenue (Million) Forecast, by Application 2019 & 2032
- Table 36: Rest of Europe Lactose Free Food Industry Volume (K Tons) Forecast, by Application 2019 & 2032
- Table 37: Global Lactose Free Food Industry Revenue Million Forecast, by Country 2019 & 2032
- Table 38: Global Lactose Free Food Industry Volume K Tons Forecast, by Country 2019 & 2032
- Table 39: China Lactose Free Food Industry Revenue (Million) Forecast, by Application 2019 & 2032
- Table 40: China Lactose Free Food Industry Volume (K Tons) Forecast, by Application 2019 & 2032
- Table 41: Japan Lactose Free Food Industry Revenue (Million) Forecast, by Application 2019 & 2032
- Table 42: Japan Lactose Free Food Industry Volume (K Tons) Forecast, by Application 2019 & 2032
- Table 43: India Lactose Free Food Industry Revenue (Million) Forecast, by Application 2019 & 2032
- Table 44: India Lactose Free Food Industry Volume (K Tons) Forecast, by Application 2019 & 2032
- Table 45: Australia Lactose Free Food Industry Revenue (Million) Forecast, by Application 2019 & 2032
- Table 46: Australia Lactose Free Food Industry Volume (K Tons) Forecast, by Application 2019 & 2032
- Table 47: Rest of Asia Pacific Lactose Free Food Industry Revenue (Million) Forecast, by Application 2019 & 2032
- Table 48: Rest of Asia Pacific Lactose Free Food Industry Volume (K Tons) Forecast, by Application 2019 & 2032
- Table 49: Global Lactose Free Food Industry Revenue Million Forecast, by Country 2019 & 2032
- Table 50: Global Lactose Free Food Industry Volume K Tons Forecast, by Country 2019 & 2032
- Table 51: Brazil Lactose Free Food Industry Revenue (Million) Forecast, by Application 2019 & 2032
- Table 52: Brazil Lactose Free Food Industry Volume (K Tons) Forecast, by Application 2019 & 2032
- Table 53: Argentina Lactose Free Food Industry Revenue (Million) Forecast, by Application 2019 & 2032
- Table 54: Argentina Lactose Free Food Industry Volume (K Tons) Forecast, by Application 2019 & 2032
- Table 55: Rest of South America Lactose Free Food Industry Revenue (Million) Forecast, by Application 2019 & 2032
- Table 56: Rest of South America Lactose Free Food Industry Volume (K Tons) Forecast, by Application 2019 & 2032
- Table 57: Global Lactose Free Food Industry Revenue Million Forecast, by Country 2019 & 2032
- Table 58: Global Lactose Free Food Industry Volume K Tons Forecast, by Country 2019 & 2032
- Table 59: South Africa Lactose Free Food Industry Revenue (Million) Forecast, by Application 2019 & 2032
- Table 60: South Africa Lactose Free Food Industry Volume (K Tons) Forecast, by Application 2019 & 2032
- Table 61: United Arab Emirates Lactose Free Food Industry Revenue (Million) Forecast, by Application 2019 & 2032
- Table 62: United Arab Emirates Lactose Free Food Industry Volume (K Tons) Forecast, by Application 2019 & 2032
- Table 63: Rest of Middle East and Africa Lactose Free Food Industry Revenue (Million) Forecast, by Application 2019 & 2032
- Table 64: Rest of Middle East and Africa Lactose Free Food Industry Volume (K Tons) Forecast, by Application 2019 & 2032
- Table 65: Global Lactose Free Food Industry Revenue Million Forecast, by Product Type 2019 & 2032
- Table 66: Global Lactose Free Food Industry Volume K Tons Forecast, by Product Type 2019 & 2032
- Table 67: Global Lactose Free Food Industry Revenue Million Forecast, by Labeling Type 2019 & 2032
- Table 68: Global Lactose Free Food Industry Volume K Tons Forecast, by Labeling Type 2019 & 2032
- Table 69: Global Lactose Free Food Industry Revenue Million Forecast, by Distribution Channel 2019 & 2032
- Table 70: Global Lactose Free Food Industry Volume K Tons Forecast, by Distribution Channel 2019 & 2032
- Table 71: Global Lactose Free Food Industry Revenue Million Forecast, by Country 2019 & 2032
- Table 72: Global Lactose Free Food Industry Volume K Tons Forecast, by Country 2019 & 2032
- Table 73: United States Lactose Free Food Industry Revenue (Million) Forecast, by Application 2019 & 2032
- Table 74: United States Lactose Free Food Industry Volume (K Tons) Forecast, by Application 2019 & 2032
- Table 75: Canada Lactose Free Food Industry Revenue (Million) Forecast, by Application 2019 & 2032
- Table 76: Canada Lactose Free Food Industry Volume (K Tons) Forecast, by Application 2019 & 2032
- Table 77: Mexico Lactose Free Food Industry Revenue (Million) Forecast, by Application 2019 & 2032
- Table 78: Mexico Lactose Free Food Industry Volume (K Tons) Forecast, by Application 2019 & 2032
- Table 79: Rest of North America Lactose Free Food Industry Revenue (Million) Forecast, by Application 2019 & 2032
- Table 80: Rest of North America Lactose Free Food Industry Volume (K Tons) Forecast, by Application 2019 & 2032
- Table 81: Global Lactose Free Food Industry Revenue Million Forecast, by Product Type 2019 & 2032
- Table 82: Global Lactose Free Food Industry Volume K Tons Forecast, by Product Type 2019 & 2032
- Table 83: Global Lactose Free Food Industry Revenue Million Forecast, by Labeling Type 2019 & 2032
- Table 84: Global Lactose Free Food Industry Volume K Tons Forecast, by Labeling Type 2019 & 2032
- Table 85: Global Lactose Free Food Industry Revenue Million Forecast, by Distribution Channel 2019 & 2032
- Table 86: Global Lactose Free Food Industry Volume K Tons Forecast, by Distribution Channel 2019 & 2032
- Table 87: Global Lactose Free Food Industry Revenue Million Forecast, by Country 2019 & 2032
- Table 88: Global Lactose Free Food Industry Volume K Tons Forecast, by Country 2019 & 2032
- Table 89: Spain Lactose Free Food Industry Revenue (Million) Forecast, by Application 2019 & 2032
- Table 90: Spain Lactose Free Food Industry Volume (K Tons) Forecast, by Application 2019 & 2032
- Table 91: United Kingdom Lactose Free Food Industry Revenue (Million) Forecast, by Application 2019 & 2032
- Table 92: United Kingdom Lactose Free Food Industry Volume (K Tons) Forecast, by Application 2019 & 2032
- Table 93: Germany Lactose Free Food Industry Revenue (Million) Forecast, by Application 2019 & 2032
- Table 94: Germany Lactose Free Food Industry Volume (K Tons) Forecast, by Application 2019 & 2032
- Table 95: France Lactose Free Food Industry Revenue (Million) Forecast, by Application 2019 & 2032
- Table 96: France Lactose Free Food Industry Volume (K Tons) Forecast, by Application 2019 & 2032
- Table 97: Italy Lactose Free Food Industry Revenue (Million) Forecast, by Application 2019 & 2032
- Table 98: Italy Lactose Free Food Industry Volume (K Tons) Forecast, by Application 2019 & 2032
- Table 99: Russia Lactose Free Food Industry Revenue (Million) Forecast, by Application 2019 & 2032
- Table 100: Russia Lactose Free Food Industry Volume (K Tons) Forecast, by Application 2019 & 2032
- Table 101: Rest of Europe Lactose Free Food Industry Revenue (Million) Forecast, by Application 2019 & 2032
- Table 102: Rest of Europe Lactose Free Food Industry Volume (K Tons) Forecast, by Application 2019 & 2032
- Table 103: Global Lactose Free Food Industry Revenue Million Forecast, by Product Type 2019 & 2032
- Table 104: Global Lactose Free Food Industry Volume K Tons Forecast, by Product Type 2019 & 2032
- Table 105: Global Lactose Free Food Industry Revenue Million Forecast, by Labeling Type 2019 & 2032
- Table 106: Global Lactose Free Food Industry Volume K Tons Forecast, by Labeling Type 2019 & 2032
- Table 107: Global Lactose Free Food Industry Revenue Million Forecast, by Distribution Channel 2019 & 2032
- Table 108: Global Lactose Free Food Industry Volume K Tons Forecast, by Distribution Channel 2019 & 2032
- Table 109: Global Lactose Free Food Industry Revenue Million Forecast, by Country 2019 & 2032
- Table 110: Global Lactose Free Food Industry Volume K Tons Forecast, by Country 2019 & 2032
- Table 111: China Lactose Free Food Industry Revenue (Million) Forecast, by Application 2019 & 2032
- Table 112: China Lactose Free Food Industry Volume (K Tons) Forecast, by Application 2019 & 2032
- Table 113: Japan Lactose Free Food Industry Revenue (Million) Forecast, by Application 2019 & 2032
- Table 114: Japan Lactose Free Food Industry Volume (K Tons) Forecast, by Application 2019 & 2032
- Table 115: India Lactose Free Food Industry Revenue (Million) Forecast, by Application 2019 & 2032
- Table 116: India Lactose Free Food Industry Volume (K Tons) Forecast, by Application 2019 & 2032
- Table 117: Australia Lactose Free Food Industry Revenue (Million) Forecast, by Application 2019 & 2032
- Table 118: Australia Lactose Free Food Industry Volume (K Tons) Forecast, by Application 2019 & 2032
- Table 119: Rest of Asia Pacific Lactose Free Food Industry Revenue (Million) Forecast, by Application 2019 & 2032
- Table 120: Rest of Asia Pacific Lactose Free Food Industry Volume (K Tons) Forecast, by Application 2019 & 2032
- Table 121: Global Lactose Free Food Industry Revenue Million Forecast, by Product Type 2019 & 2032
- Table 122: Global Lactose Free Food Industry Volume K Tons Forecast, by Product Type 2019 & 2032
- Table 123: Global Lactose Free Food Industry Revenue Million Forecast, by Labeling Type 2019 & 2032
- Table 124: Global Lactose Free Food Industry Volume K Tons Forecast, by Labeling Type 2019 & 2032
- Table 125: Global Lactose Free Food Industry Revenue Million Forecast, by Distribution Channel 2019 & 2032
- Table 126: Global Lactose Free Food Industry Volume K Tons Forecast, by Distribution Channel 2019 & 2032
- Table 127: Global Lactose Free Food Industry Revenue Million Forecast, by Country 2019 & 2032
- Table 128: Global Lactose Free Food Industry Volume K Tons Forecast, by Country 2019 & 2032
- Table 129: Brazil Lactose Free Food Industry Revenue (Million) Forecast, by Application 2019 & 2032
- Table 130: Brazil Lactose Free Food Industry Volume (K Tons) Forecast, by Application 2019 & 2032
- Table 131: Argentina Lactose Free Food Industry Revenue (Million) Forecast, by Application 2019 & 2032
- Table 132: Argentina Lactose Free Food Industry Volume (K Tons) Forecast, by Application 2019 & 2032
- Table 133: Rest of South America Lactose Free Food Industry Revenue (Million) Forecast, by Application 2019 & 2032
- Table 134: Rest of South America Lactose Free Food Industry Volume (K Tons) Forecast, by Application 2019 & 2032
- Table 135: Global Lactose Free Food Industry Revenue Million Forecast, by Product Type 2019 & 2032
- Table 136: Global Lactose Free Food Industry Volume K Tons Forecast, by Product Type 2019 & 2032
- Table 137: Global Lactose Free Food Industry Revenue Million Forecast, by Labeling Type 2019 & 2032
- Table 138: Global Lactose Free Food Industry Volume K Tons Forecast, by Labeling Type 2019 & 2032
- Table 139: Global Lactose Free Food Industry Revenue Million Forecast, by Distribution Channel 2019 & 2032
- Table 140: Global Lactose Free Food Industry Volume K Tons Forecast, by Distribution Channel 2019 & 2032
- Table 141: Global Lactose Free Food Industry Revenue Million Forecast, by Country 2019 & 2032
- Table 142: Global Lactose Free Food Industry Volume K Tons Forecast, by Country 2019 & 2032
- Table 143: South Africa Lactose Free Food Industry Revenue (Million) Forecast, by Application 2019 & 2032
- Table 144: South Africa Lactose Free Food Industry Volume (K Tons) Forecast, by Application 2019 & 2032
- Table 145: United Arab Emirates Lactose Free Food Industry Revenue (Million) Forecast, by Application 2019 & 2032
- Table 146: United Arab Emirates Lactose Free Food Industry Volume (K Tons) Forecast, by Application 2019 & 2032
- Table 147: Rest of Middle East and Africa Lactose Free Food Industry Revenue (Million) Forecast, by Application 2019 & 2032
- Table 148: Rest of Middle East and Africa Lactose Free Food Industry Volume (K Tons) Forecast, by Application 2019 & 2032
Frequently Asked Questions
1. What is the projected Compound Annual Growth Rate (CAGR) of the Lactose Free Food Industry?
The projected CAGR is approximately 7.79%.
2. Which companies are prominent players in the Lactose Free Food Industry?
Key companies in the market include Reckitt Benckiser Group PLC, The Kellogg Company, Nestle S A, General Mills Inc, Abbott Laboratories, Danone SA, Dr Schar AG / SPA*List Not Exhaustive, Blue Diamond Growers, Oatly Group AB, Beyond Meat.
3. What are the main segments of the Lactose Free Food Industry?
The market segments include Product Type, Labeling Type, Distribution Channel.
4. Can you provide details about the market size?
The market size is estimated to be USD 14,653.5 Million as of 2022.
5. What are some drivers contributing to market growth?
Increasing Demand for Clean Label Ingredients; Growing Health Consciousness of Consumers.
6. What are the notable trends driving market growth?
Surge in Demand of Clean Label and Free From Ingredients.
7. Are there any restraints impacting market growth?
Higher Manufacturing Cost.
8. Can you provide examples of recent developments in the market?
February 2023: Life Health Foods Pvt. Ltd. launched a new vegan drink, So Good Oat unsweetened beverage. The product is plant-based, dairy-free milk that can be used in tea, coffee, baking, and smoothies.
9. What pricing options are available for accessing the report?
Pricing options include single-user, multi-user, and enterprise licenses priced at USD 4750, USD 5250, and USD 8750 respectively.
10. Is the market size provided in terms of value or volume?
The market size is provided in terms of value, measured in Million and volume, measured in K Tons.
11. Are there any specific market keywords associated with the report?
Yes, the market keyword associated with the report is "Lactose Free Food Industry," which aids in identifying and referencing the specific market segment covered.
12. How do I determine which pricing option suits my needs best?
The pricing options vary based on user requirements and access needs. Individual users may opt for single-user licenses, while businesses requiring broader access may choose multi-user or enterprise licenses for cost-effective access to the report.
13. Are there any additional resources or data provided in the Lactose Free Food Industry report?
While the report offers comprehensive insights, it's advisable to review the specific contents or supplementary materials provided to ascertain if additional resources or data are available.
14. How can I stay updated on further developments or reports in the Lactose Free Food Industry?
To stay informed about further developments, trends, and reports in the Lactose Free Food Industry, consider subscribing to industry newsletters, following relevant companies and organizations, or regularly checking reputable industry news sources and publications.
Methodology
Step 1 - Identification of Relevant Samples Size from Population Database


Step 2 - Approaches for Defining Global Market Size (Value, Volume* & Price*)

Note*: In applicable scenarios
Step 3 - Data Sources
Primary Research
- Web Analytics
- Survey Reports
- Research Institute
- Latest Research Reports
- Opinion Leaders
Secondary Research
- Annual Reports
- White Paper
- Latest Press Release
- Industry Association
- Paid Database
- Investor Presentations

Step 4 - Data Triangulation
Involves using different sources of information in order to increase the validity of a study
These sources are likely to be stakeholders in a program - participants, other researchers, program staff, other community members, and so on.
Then we put all data in single framework & apply various statistical tools to find out the dynamic on the market.
During the analysis stage, feedback from the stakeholder groups would be compared to determine areas of agreement as well as areas of divergence


