
Key Insights
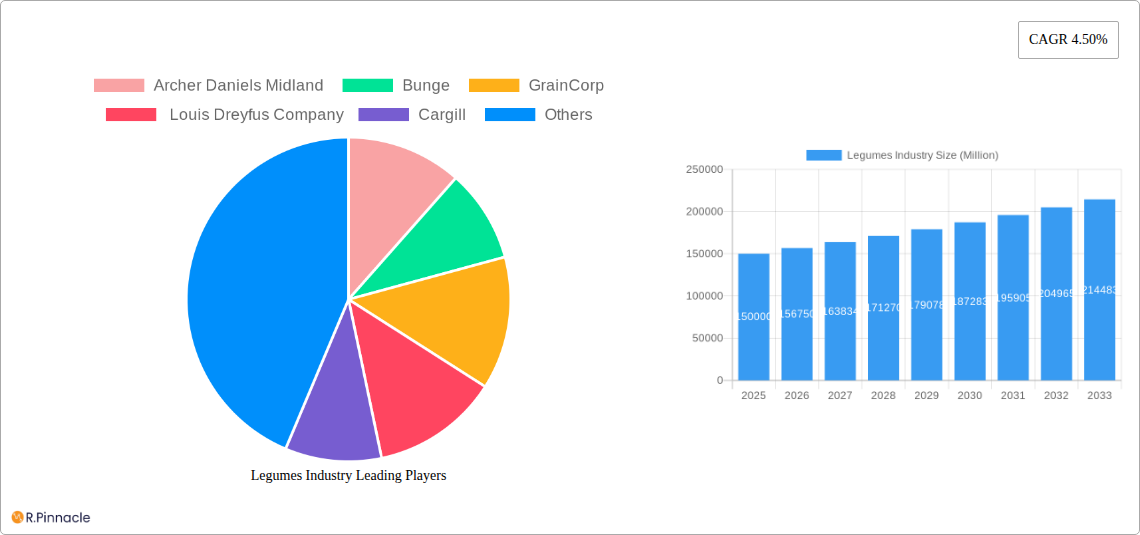
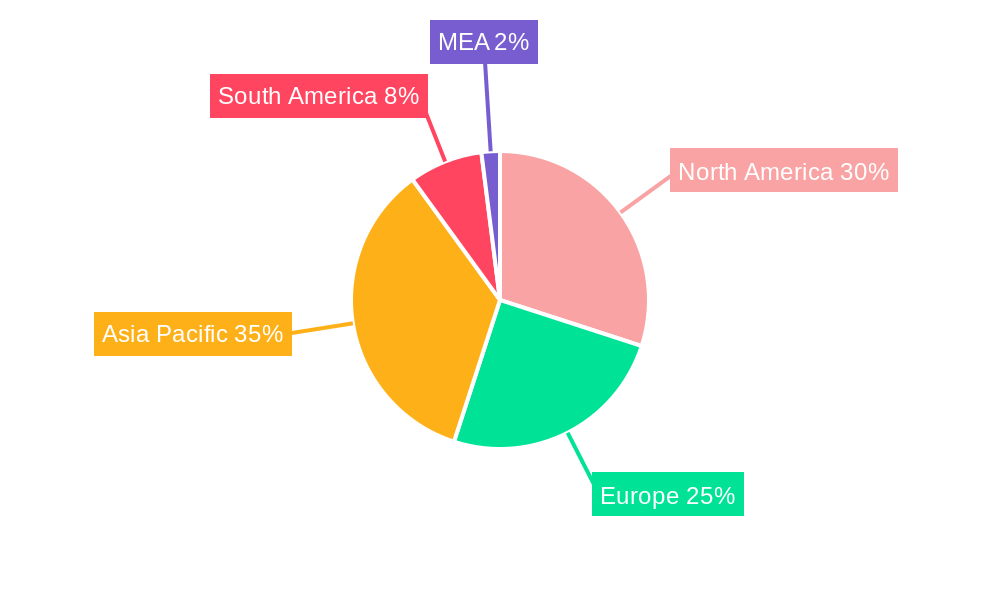
The global legumes market, encompassing soybeans, peas, and beans, is experiencing steady growth, projected to maintain a Compound Annual Growth Rate (CAGR) of 4.50% from 2025 to 2033. This expansion is driven by several key factors. Firstly, the increasing global population necessitates enhanced food security, fueling demand for protein-rich legumes in both human food and animal feed applications. Secondly, rising consumer awareness of the health benefits associated with legumes – including their high fiber content, essential nutrients, and low glycemic index – is driving consumption patterns. This is further amplified by the growing popularity of plant-based diets and flexitarian lifestyles. The industrial application segment, utilizing legumes in various products like biofuels and adhesives, is also contributing to overall market growth. However, challenges such as fluctuating commodity prices, susceptibility to weather conditions impacting crop yields, and the competition from other protein sources like meat and dairy products act as market restraints. Geographical variations exist, with North America and Asia-Pacific currently representing significant market shares, although emerging markets in South America and Africa present substantial growth potential. Major players in the industry include Archer Daniels Midland, Bunge, Cargill, GrainCorp, and Louis Dreyfus Company, constantly innovating to optimize production and supply chains and meet evolving consumer demands.
The market segmentation by product type (soybeans, peas, beans) and application (food, feed, industrial) provides a granular view of market dynamics. While soybeans currently dominate the market owing to their widespread use in various applications, the demand for peas and beans is increasing steadily, particularly in the food segment driven by health-conscious consumer choices. The regional breakdown reveals a complex landscape, with developed markets like North America and Europe exhibiting steady growth, while developing economies in Asia-Pacific and South America offer significant untapped potential. Future growth will depend on successful strategies to address the challenges related to production efficiency, sustainable agriculture, and market access, especially in less-developed regions. Industry players are actively engaged in research and development to improve crop yields, enhance nutritional content, and develop new applications for legumes to capitalize on these opportunities.
Legumes Industry Market Report: 2019-2033 Forecast
This comprehensive report provides an in-depth analysis of the global legumes industry, offering valuable insights for industry professionals, investors, and strategic decision-makers. The study period covers 2019-2033, with a base year of 2025 and a forecast period of 2025-2033. The report utilizes a robust methodology to deliver precise market sizing and growth projections, reaching a projected market value of xx Million by 2033. Key players like Archer Daniels Midland, Bunge, GrainCorp, Louis Dreyfus Company, and Cargill are profiled, providing a competitive landscape overview.
Legumes Industry Market Structure & Innovation Trends
This section analyzes the competitive landscape of the legumes industry, exploring market concentration, innovation drivers, and regulatory influences. We delve into the impact of mergers and acquisitions (M&A) activity, examining deal values and their effect on market share. The analysis incorporates assessments of product substitutes, end-user demographics and emerging trends driving innovation. Major players hold significant market share, with the top 5 companies accounting for approximately xx% of the global market in 2024. M&A activity in the past five years totaled approximately xx Million, with deals primarily focused on expanding geographical reach and product diversification.
- Market Concentration: High, with a few major players dominating the market.
- Innovation Drivers: Growing demand for sustainable and healthy food options, technological advancements in processing and cultivation.
- Regulatory Frameworks: Vary across regions, impacting production and trade.
- Product Substitutes: Increased competition from alternative protein sources.
- End-User Demographics: Shifting consumer preferences towards plant-based diets and health consciousness.
Legumes Industry Market Dynamics & Trends
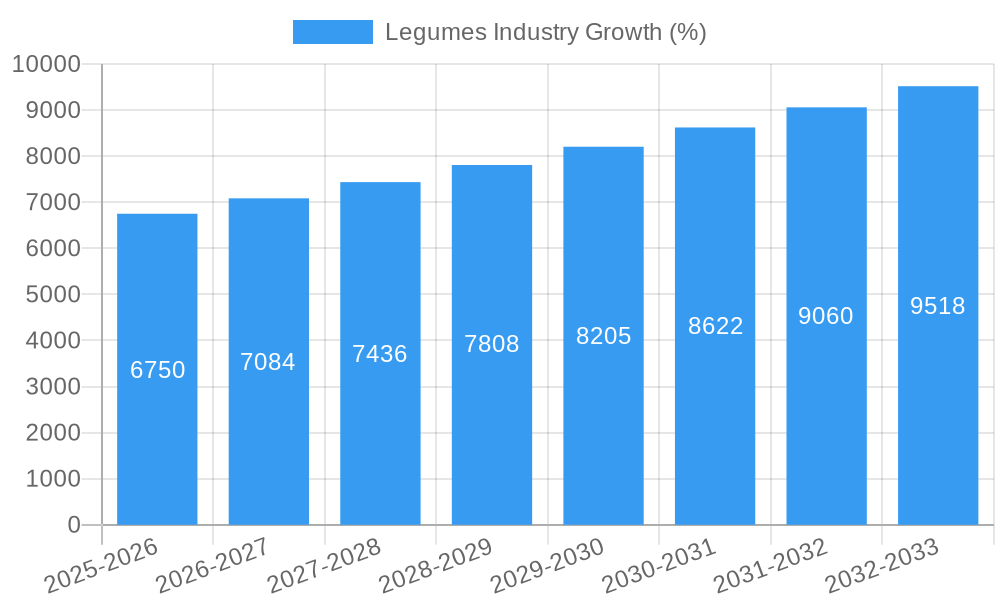
This section examines the key factors driving market growth, including technological advancements, evolving consumer preferences, and competitive dynamics. The Compound Annual Growth Rate (CAGR) for the forecast period is estimated at xx%, driven by factors including the increasing global population, rising disposable incomes, and health-conscious consumption patterns. Market penetration of legumes in various food applications continues to increase, particularly in developing economies. Technological advancements in processing and farming techniques are contributing to enhanced efficiency and productivity.
Dominant Regions & Segments in Legumes Industry
This section identifies the leading regions and segments within the legumes industry. Soybeans currently dominate the product type segment, holding approximately xx% of the market share in 2024. The food application segment represents the largest application, with a xx% market share, primarily driven by increasing demand for plant-based proteins. North America and Asia-Pacific are the leading regions, fueled by strong domestic demand and robust export markets.
- Key Drivers for North America: Established agricultural infrastructure, high per capita income, and strong regulatory support.
- Key Drivers for Asia-Pacific: Rapid population growth, rising disposable incomes, and increasing demand for plant-based proteins.
- Soybeans Dominance: Driven by high versatility, significant yield, and established supply chains.
- Food Application Dominance: Driven by the rising popularity of plant-based diets and health-conscious consumer choices.
Legumes Industry Product Innovations
Recent innovations focus on improving the nutritional profile of legumes through genetic modification and processing techniques. These developments address consumer demand for healthier and more convenient products, enhancing the competitive landscape. New product formats, such as legume-based meat substitutes and protein powders, cater to specific consumer needs, driving further market penetration.
Report Scope & Segmentation Analysis
The report provides a detailed segmentation analysis of the legumes market across product types (Soybeans, Peas, Beans) and applications (Food, Feed, Industrial). Each segment's growth projections, market size, and competitive dynamics are assessed. The food segment is projected to experience the highest CAGR during the forecast period, driven by the increasing popularity of plant-based diets. Soybeans are projected to maintain their dominance within the product type segment due to their versatility and high yield.
- Soybeans: High growth projection fueled by strong demand in food and feed applications.
- Peas: Growing popularity as a sustainable protein source, especially in plant-based foods.
- Beans: Steady growth driven by diverse culinary uses and nutritional benefits.
- Food Application: High growth due to increased consumer demand for plant-based proteins.
- Feed Application: Steady growth driven by animal feed demand, particularly in livestock production.
- Industrial Application: Moderate growth potential across various industries.
Key Drivers of Legumes Industry Growth
The growth of the legumes industry is fueled by several key factors, including the increasing global population and rising demand for sustainable and healthy food sources. Technological advancements in cultivation and processing enhance efficiency and output. Government policies promoting sustainable agriculture and plant-based diets also contribute to market expansion.
Challenges in the Legumes Industry Sector
The legumes industry faces several challenges including fluctuating commodity prices, supply chain disruptions, and increasing competition from alternative protein sources. Regulatory changes and climate change also pose risks to production and yields. These factors can negatively impact profitability and sustainability.
Emerging Opportunities in Legumes Industry
New opportunities arise from the growing demand for plant-based alternatives, the expansion into new markets, and advancements in processing technology. Innovation in food products using legumes will create further market expansion. The development of sustainable farming practices and resilient supply chains will be key to future growth.
Leading Players in the Legumes Industry Market
Key Developments in Legumes Industry
- 2022 Q4: Cargill announced a significant investment in expanding its soybean processing capacity.
- 2023 Q1: Archer Daniels Midland launched a new line of plant-based protein products.
- 2023 Q3: Bunge acquired a smaller legume processing company, expanding its market reach. (Further developments to be added as per the data available)
Future Outlook for Legumes Industry Market
The legumes industry is poised for continued growth, driven by increasing demand for plant-based proteins and sustainable food sources. Strategic investments in research and development, coupled with the adoption of innovative farming and processing techniques, will shape the future of the industry. Expansion into new markets and the development of value-added products will unlock further growth potential.
Legumes Industry Segmentation
- 1. Production Analysis
- 2. Consumption Analysis
- 3. Import Market Analysis (Value & Volume)
- 4. Export Market Analysis (Value & Volume)
- 5. Price Trend Analysis
Legumes Industry Segmentation By Geography
-
1. North America
- 1.1. United States
- 1.2. Mexico
-
2. Europe
- 2.1. Russia
- 2.2. Turkey
- 2.3. Italy
-
3. Asia Pacific
- 3.1. Myanmar
- 3.2. India
- 3.3. China
- 3.4. Australia
-
4. South America
- 4.1. Argentina
- 4.2. Brazil
-
5. Middle East and Africa
- 5.1. United Republic of Tanzania
- 5.2. Uganda
- 5.3. Kenya
Legumes Industry REPORT HIGHLIGHTS
| Aspects | Details |
|---|---|
| Study Period | 2019-2033 |
| Base Year | 2024 |
| Estimated Year | 2025 |
| Forecast Period | 2025-2033 |
| Historical Period | 2019-2024 |
| Growth Rate | CAGR of 4.50% from 2019-2033 |
| Segmentation |
|
Table of Contents
- 1. Introduction
- 1.1. Research Scope
- 1.2. Market Segmentation
- 1.3. Research Methodology
- 1.4. Definitions and Assumptions
- 2. Executive Summary
- 2.1. Introduction
- 3. Market Dynamics
- 3.1. Introduction
- 3.2. Market Drivers
- 3.2.1. Increasing Berry Consumption for Health Benefits; Increasing Adoption of High-Technology Farm Practices; Growing Usage of Berries in the Food and Beverage Industries
- 3.3. Market Restrains
- 3.3.1. High Production Cost Involved in Berry Production; Increasing Disease and Pest Infestations
- 3.4. Market Trends
- 3.4.1. Increasing Inclination Toward Vegan Diet
- 4. Market Factor Analysis
- 4.1. Porters Five Forces
- 4.2. Supply/Value Chain
- 4.3. PESTEL analysis
- 4.4. Market Entropy
- 4.5. Patent/Trademark Analysis
- 5. Global Legumes Industry Analysis, Insights and Forecast, 2019-2031
- 5.1. Market Analysis, Insights and Forecast - by Production Analysis
- 5.2. Market Analysis, Insights and Forecast - by Consumption Analysis
- 5.3. Market Analysis, Insights and Forecast - by Import Market Analysis (Value & Volume)
- 5.4. Market Analysis, Insights and Forecast - by Export Market Analysis (Value & Volume)
- 5.5. Market Analysis, Insights and Forecast - by Price Trend Analysis
- 5.6. Market Analysis, Insights and Forecast - by Region
- 5.6.1. North America
- 5.6.2. Europe
- 5.6.3. Asia Pacific
- 5.6.4. South America
- 5.6.5. Middle East and Africa
- 5.1. Market Analysis, Insights and Forecast - by Production Analysis
- 6. North America Legumes Industry Analysis, Insights and Forecast, 2019-2031
- 6.1. Market Analysis, Insights and Forecast - by Production Analysis
- 6.2. Market Analysis, Insights and Forecast - by Consumption Analysis
- 6.3. Market Analysis, Insights and Forecast - by Import Market Analysis (Value & Volume)
- 6.4. Market Analysis, Insights and Forecast - by Export Market Analysis (Value & Volume)
- 6.5. Market Analysis, Insights and Forecast - by Price Trend Analysis
- 6.1. Market Analysis, Insights and Forecast - by Production Analysis
- 7. Europe Legumes Industry Analysis, Insights and Forecast, 2019-2031
- 7.1. Market Analysis, Insights and Forecast - by Production Analysis
- 7.2. Market Analysis, Insights and Forecast - by Consumption Analysis
- 7.3. Market Analysis, Insights and Forecast - by Import Market Analysis (Value & Volume)
- 7.4. Market Analysis, Insights and Forecast - by Export Market Analysis (Value & Volume)
- 7.5. Market Analysis, Insights and Forecast - by Price Trend Analysis
- 7.1. Market Analysis, Insights and Forecast - by Production Analysis
- 8. Asia Pacific Legumes Industry Analysis, Insights and Forecast, 2019-2031
- 8.1. Market Analysis, Insights and Forecast - by Production Analysis
- 8.2. Market Analysis, Insights and Forecast - by Consumption Analysis
- 8.3. Market Analysis, Insights and Forecast - by Import Market Analysis (Value & Volume)
- 8.4. Market Analysis, Insights and Forecast - by Export Market Analysis (Value & Volume)
- 8.5. Market Analysis, Insights and Forecast - by Price Trend Analysis
- 8.1. Market Analysis, Insights and Forecast - by Production Analysis
- 9. South America Legumes Industry Analysis, Insights and Forecast, 2019-2031
- 9.1. Market Analysis, Insights and Forecast - by Production Analysis
- 9.2. Market Analysis, Insights and Forecast - by Consumption Analysis
- 9.3. Market Analysis, Insights and Forecast - by Import Market Analysis (Value & Volume)
- 9.4. Market Analysis, Insights and Forecast - by Export Market Analysis (Value & Volume)
- 9.5. Market Analysis, Insights and Forecast - by Price Trend Analysis
- 9.1. Market Analysis, Insights and Forecast - by Production Analysis
- 10. Middle East and Africa Legumes Industry Analysis, Insights and Forecast, 2019-2031
- 10.1. Market Analysis, Insights and Forecast - by Production Analysis
- 10.2. Market Analysis, Insights and Forecast - by Consumption Analysis
- 10.3. Market Analysis, Insights and Forecast - by Import Market Analysis (Value & Volume)
- 10.4. Market Analysis, Insights and Forecast - by Export Market Analysis (Value & Volume)
- 10.5. Market Analysis, Insights and Forecast - by Price Trend Analysis
- 10.1. Market Analysis, Insights and Forecast - by Production Analysis
- 11. North America Legumes Industry Analysis, Insights and Forecast, 2019-2031
- 11.1. Market Analysis, Insights and Forecast - By Country/Sub-region
- 11.1.1 United States
- 11.1.2 Canada
- 11.1.3 Mexico
- 12. Europe Legumes Industry Analysis, Insights and Forecast, 2019-2031
- 12.1. Market Analysis, Insights and Forecast - By Country/Sub-region
- 12.1.1 Germany
- 12.1.2 United Kingdom
- 12.1.3 France
- 12.1.4 Spain
- 12.1.5 Italy
- 12.1.6 Spain
- 12.1.7 Belgium
- 12.1.8 Netherland
- 12.1.9 Nordics
- 12.1.10 Rest of Europe
- 13. Asia Pacific Legumes Industry Analysis, Insights and Forecast, 2019-2031
- 13.1. Market Analysis, Insights and Forecast - By Country/Sub-region
- 13.1.1 China
- 13.1.2 Japan
- 13.1.3 India
- 13.1.4 South Korea
- 13.1.5 Southeast Asia
- 13.1.6 Australia
- 13.1.7 Indonesia
- 13.1.8 Phillipes
- 13.1.9 Singapore
- 13.1.10 Thailandc
- 13.1.11 Rest of Asia Pacific
- 14. South America Legumes Industry Analysis, Insights and Forecast, 2019-2031
- 14.1. Market Analysis, Insights and Forecast - By Country/Sub-region
- 14.1.1 Brazil
- 14.1.2 Argentina
- 14.1.3 Peru
- 14.1.4 Chile
- 14.1.5 Colombia
- 14.1.6 Ecuador
- 14.1.7 Venezuela
- 14.1.8 Rest of South America
- 15. MEA Legumes Industry Analysis, Insights and Forecast, 2019-2031
- 15.1. Market Analysis, Insights and Forecast - By Country/Sub-region
- 15.1.1 United Arab Emirates
- 15.1.2 Saudi Arabia
- 15.1.3 South Africa
- 15.1.4 Rest of Middle East and Africa
- 16. Competitive Analysis
- 16.1. Global Market Share Analysis 2024
- 16.2. Company Profiles
- 16.2.1 Archer Daniels Midland
- 16.2.1.1. Overview
- 16.2.1.2. Products
- 16.2.1.3. SWOT Analysis
- 16.2.1.4. Recent Developments
- 16.2.1.5. Financials (Based on Availability)
- 16.2.2 Bunge
- 16.2.2.1. Overview
- 16.2.2.2. Products
- 16.2.2.3. SWOT Analysis
- 16.2.2.4. Recent Developments
- 16.2.2.5. Financials (Based on Availability)
- 16.2.3 GrainCorp
- 16.2.3.1. Overview
- 16.2.3.2. Products
- 16.2.3.3. SWOT Analysis
- 16.2.3.4. Recent Developments
- 16.2.3.5. Financials (Based on Availability)
- 16.2.4 Louis Dreyfus Company
- 16.2.4.1. Overview
- 16.2.4.2. Products
- 16.2.4.3. SWOT Analysis
- 16.2.4.4. Recent Developments
- 16.2.4.5. Financials (Based on Availability)
- 16.2.5 Cargill
- 16.2.5.1. Overview
- 16.2.5.2. Products
- 16.2.5.3. SWOT Analysis
- 16.2.5.4. Recent Developments
- 16.2.5.5. Financials (Based on Availability)
- 16.2.1 Archer Daniels Midland
List of Figures
- Figure 1: Global Legumes Industry Revenue Breakdown (Million, %) by Region 2024 & 2032
- Figure 2: North America Legumes Industry Revenue (Million), by Country 2024 & 2032
- Figure 3: North America Legumes Industry Revenue Share (%), by Country 2024 & 2032
- Figure 4: Europe Legumes Industry Revenue (Million), by Country 2024 & 2032
- Figure 5: Europe Legumes Industry Revenue Share (%), by Country 2024 & 2032
- Figure 6: Asia Pacific Legumes Industry Revenue (Million), by Country 2024 & 2032
- Figure 7: Asia Pacific Legumes Industry Revenue Share (%), by Country 2024 & 2032
- Figure 8: South America Legumes Industry Revenue (Million), by Country 2024 & 2032
- Figure 9: South America Legumes Industry Revenue Share (%), by Country 2024 & 2032
- Figure 10: MEA Legumes Industry Revenue (Million), by Country 2024 & 2032
- Figure 11: MEA Legumes Industry Revenue Share (%), by Country 2024 & 2032
- Figure 12: North America Legumes Industry Revenue (Million), by Production Analysis 2024 & 2032
- Figure 13: North America Legumes Industry Revenue Share (%), by Production Analysis 2024 & 2032
- Figure 14: North America Legumes Industry Revenue (Million), by Consumption Analysis 2024 & 2032
- Figure 15: North America Legumes Industry Revenue Share (%), by Consumption Analysis 2024 & 2032
- Figure 16: North America Legumes Industry Revenue (Million), by Import Market Analysis (Value & Volume) 2024 & 2032
- Figure 17: North America Legumes Industry Revenue Share (%), by Import Market Analysis (Value & Volume) 2024 & 2032
- Figure 18: North America Legumes Industry Revenue (Million), by Export Market Analysis (Value & Volume) 2024 & 2032
- Figure 19: North America Legumes Industry Revenue Share (%), by Export Market Analysis (Value & Volume) 2024 & 2032
- Figure 20: North America Legumes Industry Revenue (Million), by Price Trend Analysis 2024 & 2032
- Figure 21: North America Legumes Industry Revenue Share (%), by Price Trend Analysis 2024 & 2032
- Figure 22: North America Legumes Industry Revenue (Million), by Country 2024 & 2032
- Figure 23: North America Legumes Industry Revenue Share (%), by Country 2024 & 2032
- Figure 24: Europe Legumes Industry Revenue (Million), by Production Analysis 2024 & 2032
- Figure 25: Europe Legumes Industry Revenue Share (%), by Production Analysis 2024 & 2032
- Figure 26: Europe Legumes Industry Revenue (Million), by Consumption Analysis 2024 & 2032
- Figure 27: Europe Legumes Industry Revenue Share (%), by Consumption Analysis 2024 & 2032
- Figure 28: Europe Legumes Industry Revenue (Million), by Import Market Analysis (Value & Volume) 2024 & 2032
- Figure 29: Europe Legumes Industry Revenue Share (%), by Import Market Analysis (Value & Volume) 2024 & 2032
- Figure 30: Europe Legumes Industry Revenue (Million), by Export Market Analysis (Value & Volume) 2024 & 2032
- Figure 31: Europe Legumes Industry Revenue Share (%), by Export Market Analysis (Value & Volume) 2024 & 2032
- Figure 32: Europe Legumes Industry Revenue (Million), by Price Trend Analysis 2024 & 2032
- Figure 33: Europe Legumes Industry Revenue Share (%), by Price Trend Analysis 2024 & 2032
- Figure 34: Europe Legumes Industry Revenue (Million), by Country 2024 & 2032
- Figure 35: Europe Legumes Industry Revenue Share (%), by Country 2024 & 2032
- Figure 36: Asia Pacific Legumes Industry Revenue (Million), by Production Analysis 2024 & 2032
- Figure 37: Asia Pacific Legumes Industry Revenue Share (%), by Production Analysis 2024 & 2032
- Figure 38: Asia Pacific Legumes Industry Revenue (Million), by Consumption Analysis 2024 & 2032
- Figure 39: Asia Pacific Legumes Industry Revenue Share (%), by Consumption Analysis 2024 & 2032
- Figure 40: Asia Pacific Legumes Industry Revenue (Million), by Import Market Analysis (Value & Volume) 2024 & 2032
- Figure 41: Asia Pacific Legumes Industry Revenue Share (%), by Import Market Analysis (Value & Volume) 2024 & 2032
- Figure 42: Asia Pacific Legumes Industry Revenue (Million), by Export Market Analysis (Value & Volume) 2024 & 2032
- Figure 43: Asia Pacific Legumes Industry Revenue Share (%), by Export Market Analysis (Value & Volume) 2024 & 2032
- Figure 44: Asia Pacific Legumes Industry Revenue (Million), by Price Trend Analysis 2024 & 2032
- Figure 45: Asia Pacific Legumes Industry Revenue Share (%), by Price Trend Analysis 2024 & 2032
- Figure 46: Asia Pacific Legumes Industry Revenue (Million), by Country 2024 & 2032
- Figure 47: Asia Pacific Legumes Industry Revenue Share (%), by Country 2024 & 2032
- Figure 48: South America Legumes Industry Revenue (Million), by Production Analysis 2024 & 2032
- Figure 49: South America Legumes Industry Revenue Share (%), by Production Analysis 2024 & 2032
- Figure 50: South America Legumes Industry Revenue (Million), by Consumption Analysis 2024 & 2032
- Figure 51: South America Legumes Industry Revenue Share (%), by Consumption Analysis 2024 & 2032
- Figure 52: South America Legumes Industry Revenue (Million), by Import Market Analysis (Value & Volume) 2024 & 2032
- Figure 53: South America Legumes Industry Revenue Share (%), by Import Market Analysis (Value & Volume) 2024 & 2032
- Figure 54: South America Legumes Industry Revenue (Million), by Export Market Analysis (Value & Volume) 2024 & 2032
- Figure 55: South America Legumes Industry Revenue Share (%), by Export Market Analysis (Value & Volume) 2024 & 2032
- Figure 56: South America Legumes Industry Revenue (Million), by Price Trend Analysis 2024 & 2032
- Figure 57: South America Legumes Industry Revenue Share (%), by Price Trend Analysis 2024 & 2032
- Figure 58: South America Legumes Industry Revenue (Million), by Country 2024 & 2032
- Figure 59: South America Legumes Industry Revenue Share (%), by Country 2024 & 2032
- Figure 60: Middle East and Africa Legumes Industry Revenue (Million), by Production Analysis 2024 & 2032
- Figure 61: Middle East and Africa Legumes Industry Revenue Share (%), by Production Analysis 2024 & 2032
- Figure 62: Middle East and Africa Legumes Industry Revenue (Million), by Consumption Analysis 2024 & 2032
- Figure 63: Middle East and Africa Legumes Industry Revenue Share (%), by Consumption Analysis 2024 & 2032
- Figure 64: Middle East and Africa Legumes Industry Revenue (Million), by Import Market Analysis (Value & Volume) 2024 & 2032
- Figure 65: Middle East and Africa Legumes Industry Revenue Share (%), by Import Market Analysis (Value & Volume) 2024 & 2032
- Figure 66: Middle East and Africa Legumes Industry Revenue (Million), by Export Market Analysis (Value & Volume) 2024 & 2032
- Figure 67: Middle East and Africa Legumes Industry Revenue Share (%), by Export Market Analysis (Value & Volume) 2024 & 2032
- Figure 68: Middle East and Africa Legumes Industry Revenue (Million), by Price Trend Analysis 2024 & 2032
- Figure 69: Middle East and Africa Legumes Industry Revenue Share (%), by Price Trend Analysis 2024 & 2032
- Figure 70: Middle East and Africa Legumes Industry Revenue (Million), by Country 2024 & 2032
- Figure 71: Middle East and Africa Legumes Industry Revenue Share (%), by Country 2024 & 2032
List of Tables
- Table 1: Global Legumes Industry Revenue Million Forecast, by Region 2019 & 2032
- Table 2: Global Legumes Industry Revenue Million Forecast, by Production Analysis 2019 & 2032
- Table 3: Global Legumes Industry Revenue Million Forecast, by Consumption Analysis 2019 & 2032
- Table 4: Global Legumes Industry Revenue Million Forecast, by Import Market Analysis (Value & Volume) 2019 & 2032
- Table 5: Global Legumes Industry Revenue Million Forecast, by Export Market Analysis (Value & Volume) 2019 & 2032
- Table 6: Global Legumes Industry Revenue Million Forecast, by Price Trend Analysis 2019 & 2032
- Table 7: Global Legumes Industry Revenue Million Forecast, by Region 2019 & 2032
- Table 8: Global Legumes Industry Revenue Million Forecast, by Country 2019 & 2032
- Table 9: United States Legumes Industry Revenue (Million) Forecast, by Application 2019 & 2032
- Table 10: Canada Legumes Industry Revenue (Million) Forecast, by Application 2019 & 2032
- Table 11: Mexico Legumes Industry Revenue (Million) Forecast, by Application 2019 & 2032
- Table 12: Global Legumes Industry Revenue Million Forecast, by Country 2019 & 2032
- Table 13: Germany Legumes Industry Revenue (Million) Forecast, by Application 2019 & 2032
- Table 14: United Kingdom Legumes Industry Revenue (Million) Forecast, by Application 2019 & 2032
- Table 15: France Legumes Industry Revenue (Million) Forecast, by Application 2019 & 2032
- Table 16: Spain Legumes Industry Revenue (Million) Forecast, by Application 2019 & 2032
- Table 17: Italy Legumes Industry Revenue (Million) Forecast, by Application 2019 & 2032
- Table 18: Spain Legumes Industry Revenue (Million) Forecast, by Application 2019 & 2032
- Table 19: Belgium Legumes Industry Revenue (Million) Forecast, by Application 2019 & 2032
- Table 20: Netherland Legumes Industry Revenue (Million) Forecast, by Application 2019 & 2032
- Table 21: Nordics Legumes Industry Revenue (Million) Forecast, by Application 2019 & 2032
- Table 22: Rest of Europe Legumes Industry Revenue (Million) Forecast, by Application 2019 & 2032
- Table 23: Global Legumes Industry Revenue Million Forecast, by Country 2019 & 2032
- Table 24: China Legumes Industry Revenue (Million) Forecast, by Application 2019 & 2032
- Table 25: Japan Legumes Industry Revenue (Million) Forecast, by Application 2019 & 2032
- Table 26: India Legumes Industry Revenue (Million) Forecast, by Application 2019 & 2032
- Table 27: South Korea Legumes Industry Revenue (Million) Forecast, by Application 2019 & 2032
- Table 28: Southeast Asia Legumes Industry Revenue (Million) Forecast, by Application 2019 & 2032
- Table 29: Australia Legumes Industry Revenue (Million) Forecast, by Application 2019 & 2032
- Table 30: Indonesia Legumes Industry Revenue (Million) Forecast, by Application 2019 & 2032
- Table 31: Phillipes Legumes Industry Revenue (Million) Forecast, by Application 2019 & 2032
- Table 32: Singapore Legumes Industry Revenue (Million) Forecast, by Application 2019 & 2032
- Table 33: Thailandc Legumes Industry Revenue (Million) Forecast, by Application 2019 & 2032
- Table 34: Rest of Asia Pacific Legumes Industry Revenue (Million) Forecast, by Application 2019 & 2032
- Table 35: Global Legumes Industry Revenue Million Forecast, by Country 2019 & 2032
- Table 36: Brazil Legumes Industry Revenue (Million) Forecast, by Application 2019 & 2032
- Table 37: Argentina Legumes Industry Revenue (Million) Forecast, by Application 2019 & 2032
- Table 38: Peru Legumes Industry Revenue (Million) Forecast, by Application 2019 & 2032
- Table 39: Chile Legumes Industry Revenue (Million) Forecast, by Application 2019 & 2032
- Table 40: Colombia Legumes Industry Revenue (Million) Forecast, by Application 2019 & 2032
- Table 41: Ecuador Legumes Industry Revenue (Million) Forecast, by Application 2019 & 2032
- Table 42: Venezuela Legumes Industry Revenue (Million) Forecast, by Application 2019 & 2032
- Table 43: Rest of South America Legumes Industry Revenue (Million) Forecast, by Application 2019 & 2032
- Table 44: Global Legumes Industry Revenue Million Forecast, by Country 2019 & 2032
- Table 45: United Arab Emirates Legumes Industry Revenue (Million) Forecast, by Application 2019 & 2032
- Table 46: Saudi Arabia Legumes Industry Revenue (Million) Forecast, by Application 2019 & 2032
- Table 47: South Africa Legumes Industry Revenue (Million) Forecast, by Application 2019 & 2032
- Table 48: Rest of Middle East and Africa Legumes Industry Revenue (Million) Forecast, by Application 2019 & 2032
- Table 49: Global Legumes Industry Revenue Million Forecast, by Production Analysis 2019 & 2032
- Table 50: Global Legumes Industry Revenue Million Forecast, by Consumption Analysis 2019 & 2032
- Table 51: Global Legumes Industry Revenue Million Forecast, by Import Market Analysis (Value & Volume) 2019 & 2032
- Table 52: Global Legumes Industry Revenue Million Forecast, by Export Market Analysis (Value & Volume) 2019 & 2032
- Table 53: Global Legumes Industry Revenue Million Forecast, by Price Trend Analysis 2019 & 2032
- Table 54: Global Legumes Industry Revenue Million Forecast, by Country 2019 & 2032
- Table 55: United States Legumes Industry Revenue (Million) Forecast, by Application 2019 & 2032
- Table 56: Mexico Legumes Industry Revenue (Million) Forecast, by Application 2019 & 2032
- Table 57: Global Legumes Industry Revenue Million Forecast, by Production Analysis 2019 & 2032
- Table 58: Global Legumes Industry Revenue Million Forecast, by Consumption Analysis 2019 & 2032
- Table 59: Global Legumes Industry Revenue Million Forecast, by Import Market Analysis (Value & Volume) 2019 & 2032
- Table 60: Global Legumes Industry Revenue Million Forecast, by Export Market Analysis (Value & Volume) 2019 & 2032
- Table 61: Global Legumes Industry Revenue Million Forecast, by Price Trend Analysis 2019 & 2032
- Table 62: Global Legumes Industry Revenue Million Forecast, by Country 2019 & 2032
- Table 63: Russia Legumes Industry Revenue (Million) Forecast, by Application 2019 & 2032
- Table 64: Turkey Legumes Industry Revenue (Million) Forecast, by Application 2019 & 2032
- Table 65: Italy Legumes Industry Revenue (Million) Forecast, by Application 2019 & 2032
- Table 66: Global Legumes Industry Revenue Million Forecast, by Production Analysis 2019 & 2032
- Table 67: Global Legumes Industry Revenue Million Forecast, by Consumption Analysis 2019 & 2032
- Table 68: Global Legumes Industry Revenue Million Forecast, by Import Market Analysis (Value & Volume) 2019 & 2032
- Table 69: Global Legumes Industry Revenue Million Forecast, by Export Market Analysis (Value & Volume) 2019 & 2032
- Table 70: Global Legumes Industry Revenue Million Forecast, by Price Trend Analysis 2019 & 2032
- Table 71: Global Legumes Industry Revenue Million Forecast, by Country 2019 & 2032
- Table 72: Myanmar Legumes Industry Revenue (Million) Forecast, by Application 2019 & 2032
- Table 73: India Legumes Industry Revenue (Million) Forecast, by Application 2019 & 2032
- Table 74: China Legumes Industry Revenue (Million) Forecast, by Application 2019 & 2032
- Table 75: Australia Legumes Industry Revenue (Million) Forecast, by Application 2019 & 2032
- Table 76: Global Legumes Industry Revenue Million Forecast, by Production Analysis 2019 & 2032
- Table 77: Global Legumes Industry Revenue Million Forecast, by Consumption Analysis 2019 & 2032
- Table 78: Global Legumes Industry Revenue Million Forecast, by Import Market Analysis (Value & Volume) 2019 & 2032
- Table 79: Global Legumes Industry Revenue Million Forecast, by Export Market Analysis (Value & Volume) 2019 & 2032
- Table 80: Global Legumes Industry Revenue Million Forecast, by Price Trend Analysis 2019 & 2032
- Table 81: Global Legumes Industry Revenue Million Forecast, by Country 2019 & 2032
- Table 82: Argentina Legumes Industry Revenue (Million) Forecast, by Application 2019 & 2032
- Table 83: Brazil Legumes Industry Revenue (Million) Forecast, by Application 2019 & 2032
- Table 84: Global Legumes Industry Revenue Million Forecast, by Production Analysis 2019 & 2032
- Table 85: Global Legumes Industry Revenue Million Forecast, by Consumption Analysis 2019 & 2032
- Table 86: Global Legumes Industry Revenue Million Forecast, by Import Market Analysis (Value & Volume) 2019 & 2032
- Table 87: Global Legumes Industry Revenue Million Forecast, by Export Market Analysis (Value & Volume) 2019 & 2032
- Table 88: Global Legumes Industry Revenue Million Forecast, by Price Trend Analysis 2019 & 2032
- Table 89: Global Legumes Industry Revenue Million Forecast, by Country 2019 & 2032
- Table 90: United Republic of Tanzania Legumes Industry Revenue (Million) Forecast, by Application 2019 & 2032
- Table 91: Uganda Legumes Industry Revenue (Million) Forecast, by Application 2019 & 2032
- Table 92: Kenya Legumes Industry Revenue (Million) Forecast, by Application 2019 & 2032
Frequently Asked Questions
1. What is the projected Compound Annual Growth Rate (CAGR) of the Legumes Industry?
The projected CAGR is approximately 4.50%.
2. Which companies are prominent players in the Legumes Industry?
Key companies in the market include Archer Daniels Midland , Bunge , GrainCorp, Louis Dreyfus Company, Cargill .
3. What are the main segments of the Legumes Industry?
The market segments include Production Analysis, Consumption Analysis, Import Market Analysis (Value & Volume), Export Market Analysis (Value & Volume), Price Trend Analysis.
4. Can you provide details about the market size?
The market size is estimated to be USD XX Million as of 2022.
5. What are some drivers contributing to market growth?
Increasing Berry Consumption for Health Benefits; Increasing Adoption of High-Technology Farm Practices; Growing Usage of Berries in the Food and Beverage Industries.
6. What are the notable trends driving market growth?
Increasing Inclination Toward Vegan Diet.
7. Are there any restraints impacting market growth?
High Production Cost Involved in Berry Production; Increasing Disease and Pest Infestations.
8. Can you provide examples of recent developments in the market?
N/A
9. What pricing options are available for accessing the report?
Pricing options include single-user, multi-user, and enterprise licenses priced at USD 4750, USD 5250, and USD 8750 respectively.
10. Is the market size provided in terms of value or volume?
The market size is provided in terms of value, measured in Million.
11. Are there any specific market keywords associated with the report?
Yes, the market keyword associated with the report is "Legumes Industry," which aids in identifying and referencing the specific market segment covered.
12. How do I determine which pricing option suits my needs best?
The pricing options vary based on user requirements and access needs. Individual users may opt for single-user licenses, while businesses requiring broader access may choose multi-user or enterprise licenses for cost-effective access to the report.
13. Are there any additional resources or data provided in the Legumes Industry report?
While the report offers comprehensive insights, it's advisable to review the specific contents or supplementary materials provided to ascertain if additional resources or data are available.
14. How can I stay updated on further developments or reports in the Legumes Industry?
To stay informed about further developments, trends, and reports in the Legumes Industry, consider subscribing to industry newsletters, following relevant companies and organizations, or regularly checking reputable industry news sources and publications.
Methodology
Step 1 - Identification of Relevant Samples Size from Population Database


Step 2 - Approaches for Defining Global Market Size (Value, Volume* & Price*)

Note*: In applicable scenarios
Step 3 - Data Sources
Primary Research
- Web Analytics
- Survey Reports
- Research Institute
- Latest Research Reports
- Opinion Leaders
Secondary Research
- Annual Reports
- White Paper
- Latest Press Release
- Industry Association
- Paid Database
- Investor Presentations

Step 4 - Data Triangulation
Involves using different sources of information in order to increase the validity of a study
These sources are likely to be stakeholders in a program - participants, other researchers, program staff, other community members, and so on.
Then we put all data in single framework & apply various statistical tools to find out the dynamic on the market.
During the analysis stage, feedback from the stakeholder groups would be compared to determine areas of agreement as well as areas of divergence


