

Key Insights
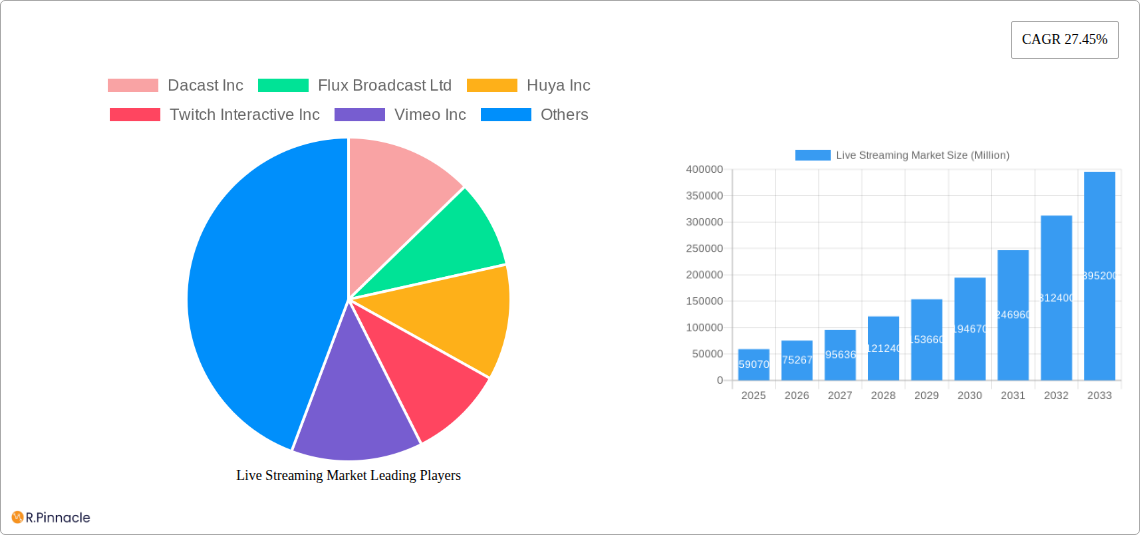
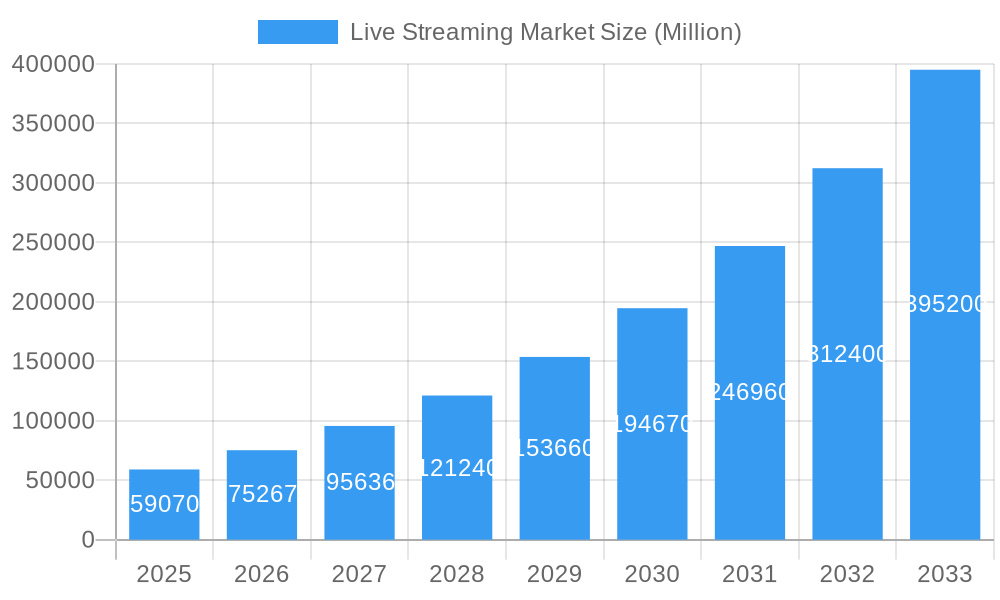
The live streaming market is experiencing explosive growth, projected to reach $59.07 billion in 2025 and maintain a robust Compound Annual Growth Rate (CAGR) of 27.45% from 2025 to 2033. This expansion is driven by several key factors. The increasing penetration of high-speed internet and mobile devices provides wider access to streaming platforms, fueling user adoption. Simultaneously, advancements in streaming technologies, including improved video quality, low latency, and enhanced interactive features, create a richer and more engaging viewing experience. The rise of social media platforms incorporating live streaming functionality has also significantly contributed to market growth, enabling both individual users and businesses to broadcast content to large audiences easily. Furthermore, the growing popularity of esports and live gaming tournaments, coupled with the increasing demand for online education and virtual events, further expands the market's potential. Competition is fierce, with established players like Twitch and Vimeo vying for market share alongside newer entrants offering specialized services.
Live Streaming Market Market Size (In Billion)
The market's segmentation likely includes categories based on streaming type (live video, live audio), target audience (consumers, businesses), device (mobile, desktop), and monetization model (advertising, subscriptions). Geographic expansion will play a crucial role in future growth, with regions showing high internet penetration and growing mobile usage potentially showing the fastest growth rates. Challenges include ensuring content quality, managing bandwidth, and addressing issues like piracy and security. However, continuous technological innovation and the evolving preference for online video content suggest that the live streaming market will continue its impressive trajectory for the foreseeable future. The leading companies mentioned represent a diverse range of approaches to the market, from general-purpose platforms to specialized solutions for businesses and broadcasters, indicating further market diversification is likely.
Live Streaming Market Company Market Share
Live Streaming Market Report: 2019-2033 Forecast
This comprehensive report provides an in-depth analysis of the global live streaming market, encompassing historical data (2019-2024), current estimations (2025), and future projections (2025-2033). It delves into market structure, innovation trends, dominant regions, key players, and emerging opportunities, offering invaluable insights for industry professionals, investors, and strategists. The report utilizes a robust methodology and incorporates real-world examples, presenting actionable intelligence for informed decision-making. The market is projected to reach xx Million by 2033, exhibiting a compelling CAGR of xx%.
Live Streaming Market Structure & Innovation Trends
The live streaming market is characterized by a blend of established giants and emerging players. Market concentration is moderate, with a few dominant players holding significant market share, but a diverse landscape of smaller companies also contributing significantly. The market share held by Twitch Interactive Inc and Huya Inc is estimated to be around xx% and xx% respectively in 2025. Innovation is driven by advancements in video compression technologies, improved streaming infrastructure (5G, edge computing), and the integration of interactive features. Regulatory frameworks vary across regions, impacting market access and content moderation. Product substitutes, such as pre-recorded video content, continue to exist, but the inherent real-time engagement of live streaming maintains its distinct appeal. End-user demographics are expanding beyond traditional gaming audiences, encompassing educational institutions, corporate training, and virtual events. M&A activity is significant; recent deals, although not publicly disclosed in all instances, show a continued trend of consolidation and strategic acquisitions to expand capabilities. Deal values are estimated in the range of xx Million to xx Million for some major mergers in the historical period.
- Market Concentration: Moderate, with some players dominating specific segments.
- Innovation Drivers: Improved streaming infrastructure, interactive features, and better video compression.
- Regulatory Frameworks: Vary widely across regions.
- M&A Activity: Significant, with deals valued in the xx Million to xx Million range (estimated).
Live Streaming Market Dynamics & Trends
The live streaming market is experiencing robust growth, fueled by several key factors. The increasing penetration of high-speed internet and mobile devices is a primary driver, enabling wider access to streaming services. Technological advancements, such as improved bandwidth and low-latency streaming, enhance user experience. Changing consumer preferences, marked by a shift towards on-demand and interactive content, are reshaping the market landscape. Competitive dynamics are fierce, with companies vying for market share through innovative features, exclusive content, and strategic partnerships. This competitive landscape is creating a rapid evolution of features and functionalities. The market's CAGR is expected to remain strong, exceeding xx% during the forecast period. Market penetration is particularly high in developed regions but is rapidly expanding in emerging markets.
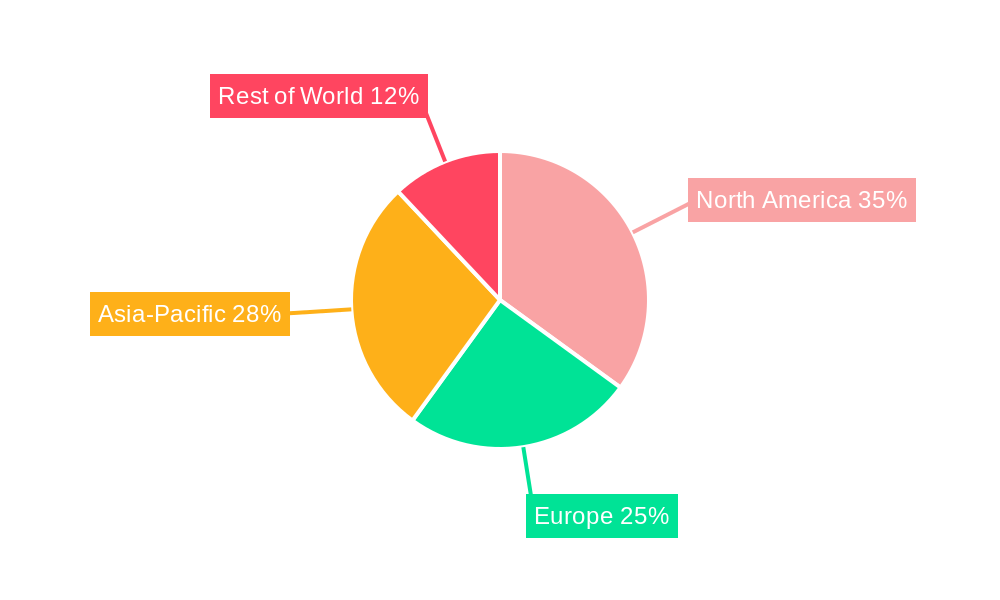
Dominant Regions & Segments in Live Streaming Market
The North American market currently holds a dominant position in the global live streaming market, driven by factors such as high internet penetration, a strong technological infrastructure, and a large base of early adopters.
- Key Drivers in North America:
- High internet penetration and smartphone usage.
- Robust technological infrastructure and innovation.
- Strong consumer spending power.
- Well-established media and entertainment industries.
- Favorable regulatory environment.
This dominance is expected to continue throughout the forecast period, though growth in Asia-Pacific is anticipated to be strong due to rapid digitalization. The gaming segment remains a significant revenue driver, but the growth of live streaming in other areas, such as e-learning, virtual events, and corporate communications, is rapidly expanding.
Live Streaming Market Product Innovations
Recent innovations in live streaming focus on enhancing viewer engagement, improving video quality, and simplifying broadcasting. This includes the development of advanced interactive features like real-time polls and Q&A sessions, the adoption of high-definition video and HDR capabilities, and user-friendly broadcasting platforms. The market is rapidly incorporating AI-driven features to automate tasks, such as moderation and content analysis.
Report Scope & Segmentation Analysis
This report segments the live streaming market by technology, application, and geography. The technology segment includes software and hardware solutions, each with unique growth projections. The application segment analyzes various uses of live streaming across gaming, entertainment, education, and more. Each segment displays distinct growth trajectories and competitive landscapes. The geographic segmentation considers different regional market dynamics and regulatory nuances. The report provides detailed market size and growth projections for each segment.
Key Drivers of Live Streaming Market Growth
Several factors contribute to the live streaming market's growth. The rising adoption of smartphones and high-speed internet access provides wider access. Technological advancements, such as improved video compression and low-latency streaming, greatly enhance user experience. The increasing popularity of social media platforms and the growing demand for interactive content also contribute significantly. Furthermore, favorable regulatory environments in many regions encourage growth.
Challenges in the Live Streaming Market Sector
Challenges include maintaining the quality of service, particularly with increased traffic, managing high bandwidth costs, and addressing content moderation issues. Competition is fierce, which puts pressure on pricing and profit margins. Regulatory hurdles and differing regulations globally also present complexities. Supply chain disruptions can impact the availability of equipment and software.
Emerging Opportunities in Live Streaming Market
Emerging opportunities lie in the expansion into new markets, especially developing economies with increasing internet penetration. The integration of augmented reality (AR) and virtual reality (VR) technologies to enhance the viewing experience presents immense possibilities. The adoption of advanced analytics to understand viewer preferences and improve content personalization will also lead to growth.
Leading Players in the Live Streaming Market Market
- Dacast Inc
- Flux Broadcast Ltd
- Huya Inc
- Twitch Interactive Inc
- Vimeo Inc
- Pluto Inc
- BoxCast
- Uplynk by Edigo
- Wowza Streaming Engine
- Stream Hatchet
*List Not Exhaustive
Key Developments in Live Streaming Market Industry
- July 2024: Warner Bros. Discovery (WBD) launched innovative streaming features for the 2024 Paris Olympics, boosting user engagement and platform usage.
- September 2024: Dolby's acquisition of THEO Technologies and the launch of new cloud video products significantly enhanced real-time interactive streaming capabilities.
Future Outlook for Live Streaming Market Market
The future of the live streaming market looks bright, with continued growth driven by technological advancements, increasing internet penetration, and evolving consumer preferences. Strategic partnerships, investments in innovative technologies (like Web 3.0 integration), and expansion into new application areas (such as the metaverse) will shape the market's trajectory. The focus on enhancing user experiences through personalization and interactive features will further fuel market expansion.
Live Streaming Market Segmentation
-
1. Component
- 1.1. Solution
- 1.2. Services
-
2. Type
- 2.1. Video Streaming
- 2.2. Audio Streaming
-
3. End-user Vertical
- 3.1. Gaming
- 3.2. Media and Entertainment
- 3.3. Sports
- 3.4. News and Events
- 3.5. Education
- 3.6. Other End-user Verticals
Live Streaming Market Segmentation By Geography
- 1. North America
- 2. Europe
- 3. Asia
- 4. Australia and New Zealand
- 5. Latin America
- 6. Middle East and Africa
Live Streaming Market Regional Market Share
Geographic Coverage of Live Streaming Market
Live Streaming Market REPORT HIGHLIGHTS
| Aspects | Details |
|---|---|
| Study Period | 2020-2034 |
| Base Year | 2025 |
| Estimated Year | 2026 |
| Forecast Period | 2026-2034 |
| Historical Period | 2020-2025 |
| Growth Rate | CAGR of 27.45% from 2020-2034 |
| Segmentation |
|
Table of Contents
- 1. Introduction
- 1.1. Research Scope
- 1.2. Market Segmentation
- 1.3. Research Objective
- 1.4. Definitions and Assumptions
- 2. Executive Summary
- 2.1. Market Snapshot
- 3. Market Dynamics
- 3.1. Market Drivers
- 3.2. Market Restrains
- 3.3. Market Trends
- 3.4. Market Opportunities
- 4. Market Factor Analysis
- 4.1. Porters Five Forces
- 4.1.1. Bargaining Power of Suppliers
- 4.1.2. Bargaining Power of Buyers
- 4.1.3. Threat of New Entrants
- 4.1.4. Threat of Substitutes
- 4.1.5. Competitive Rivalry
- 4.2. PESTEL analysis
- 4.3. BCG Analysis
- 4.3.1. Stars (High Growth, High Market Share)
- 4.3.2. Cash Cows (Low Growth, High Market Share)
- 4.3.3. Question Mark (High Growth, Low Market Share)
- 4.3.4. Dogs (Low Growth, Low Market Share)
- 4.4. Ansoff Matrix Analysis
- 4.5. Supply Chain Analysis
- 4.6. Regulatory Landscape
- 4.7. Current Market Potential and Opportunity Assessment (TAM–SAM–SOM Framework)
- 4.8. PRI Analyst Note
- 4.1. Porters Five Forces
- 5. Market Analysis, Insights and Forecast 2021-2033
- 5.1. Market Analysis, Insights and Forecast - by Component
- 5.1.1. Solution
- 5.1.2. Services
- 5.2. Market Analysis, Insights and Forecast - by Type
- 5.2.1. Video Streaming
- 5.2.2. Audio Streaming
- 5.3. Market Analysis, Insights and Forecast - by End-user Vertical
- 5.3.1. Gaming
- 5.3.2. Media and Entertainment
- 5.3.3. Sports
- 5.3.4. News and Events
- 5.3.5. Education
- 5.3.6. Other End-user Verticals
- 5.4. Market Analysis, Insights and Forecast - by Region
- 5.4.1. North America
- 5.4.2. Europe
- 5.4.3. Asia
- 5.4.4. Australia and New Zealand
- 5.4.5. Latin America
- 5.4.6. Middle East and Africa
- 5.1. Market Analysis, Insights and Forecast - by Component
- 6. Global Live Streaming Market Analysis, Insights and Forecast, 2021-2033
- 6.1. Market Analysis, Insights and Forecast - by Component
- 6.1.1. Solution
- 6.1.2. Services
- 6.2. Market Analysis, Insights and Forecast - by Type
- 6.2.1. Video Streaming
- 6.2.2. Audio Streaming
- 6.3. Market Analysis, Insights and Forecast - by End-user Vertical
- 6.3.1. Gaming
- 6.3.2. Media and Entertainment
- 6.3.3. Sports
- 6.3.4. News and Events
- 6.3.5. Education
- 6.3.6. Other End-user Verticals
- 6.1. Market Analysis, Insights and Forecast - by Component
- 7. North America Live Streaming Market Analysis, Insights and Forecast, 2020-2032
- 7.1. Market Analysis, Insights and Forecast - by Component
- 7.1.1. Solution
- 7.1.2. Services
- 7.2. Market Analysis, Insights and Forecast - by Type
- 7.2.1. Video Streaming
- 7.2.2. Audio Streaming
- 7.3. Market Analysis, Insights and Forecast - by End-user Vertical
- 7.3.1. Gaming
- 7.3.2. Media and Entertainment
- 7.3.3. Sports
- 7.3.4. News and Events
- 7.3.5. Education
- 7.3.6. Other End-user Verticals
- 7.1. Market Analysis, Insights and Forecast - by Component
- 8. Europe Live Streaming Market Analysis, Insights and Forecast, 2020-2032
- 8.1. Market Analysis, Insights and Forecast - by Component
- 8.1.1. Solution
- 8.1.2. Services
- 8.2. Market Analysis, Insights and Forecast - by Type
- 8.2.1. Video Streaming
- 8.2.2. Audio Streaming
- 8.3. Market Analysis, Insights and Forecast - by End-user Vertical
- 8.3.1. Gaming
- 8.3.2. Media and Entertainment
- 8.3.3. Sports
- 8.3.4. News and Events
- 8.3.5. Education
- 8.3.6. Other End-user Verticals
- 8.1. Market Analysis, Insights and Forecast - by Component
- 9. Asia Live Streaming Market Analysis, Insights and Forecast, 2020-2032
- 9.1. Market Analysis, Insights and Forecast - by Component
- 9.1.1. Solution
- 9.1.2. Services
- 9.2. Market Analysis, Insights and Forecast - by Type
- 9.2.1. Video Streaming
- 9.2.2. Audio Streaming
- 9.3. Market Analysis, Insights and Forecast - by End-user Vertical
- 9.3.1. Gaming
- 9.3.2. Media and Entertainment
- 9.3.3. Sports
- 9.3.4. News and Events
- 9.3.5. Education
- 9.3.6. Other End-user Verticals
- 9.1. Market Analysis, Insights and Forecast - by Component
- 10. Australia and New Zealand Live Streaming Market Analysis, Insights and Forecast, 2020-2032
- 10.1. Market Analysis, Insights and Forecast - by Component
- 10.1.1. Solution
- 10.1.2. Services
- 10.2. Market Analysis, Insights and Forecast - by Type
- 10.2.1. Video Streaming
- 10.2.2. Audio Streaming
- 10.3. Market Analysis, Insights and Forecast - by End-user Vertical
- 10.3.1. Gaming
- 10.3.2. Media and Entertainment
- 10.3.3. Sports
- 10.3.4. News and Events
- 10.3.5. Education
- 10.3.6. Other End-user Verticals
- 10.1. Market Analysis, Insights and Forecast - by Component
- 11. Latin America Live Streaming Market Analysis, Insights and Forecast, 2020-2032
- 11.1. Market Analysis, Insights and Forecast - by Component
- 11.1.1. Solution
- 11.1.2. Services
- 11.2. Market Analysis, Insights and Forecast - by Type
- 11.2.1. Video Streaming
- 11.2.2. Audio Streaming
- 11.3. Market Analysis, Insights and Forecast - by End-user Vertical
- 11.3.1. Gaming
- 11.3.2. Media and Entertainment
- 11.3.3. Sports
- 11.3.4. News and Events
- 11.3.5. Education
- 11.3.6. Other End-user Verticals
- 11.1. Market Analysis, Insights and Forecast - by Component
- 12. Middle East and Africa Live Streaming Market Analysis, Insights and Forecast, 2020-2032
- 12.1. Market Analysis, Insights and Forecast - by Component
- 12.1.1. Solution
- 12.1.2. Services
- 12.2. Market Analysis, Insights and Forecast - by Type
- 12.2.1. Video Streaming
- 12.2.2. Audio Streaming
- 12.3. Market Analysis, Insights and Forecast - by End-user Vertical
- 12.3.1. Gaming
- 12.3.2. Media and Entertainment
- 12.3.3. Sports
- 12.3.4. News and Events
- 12.3.5. Education
- 12.3.6. Other End-user Verticals
- 12.1. Market Analysis, Insights and Forecast - by Component
- 13. Competitive Analysis
- 13.1. Company Profiles
- 13.1.1 Dacast Inc
- 13.1.1.1. Company Overview
- 13.1.1.2. Products
- 13.1.1.3. Company Financials
- 13.1.1.4. SWOT Analysis
- 13.1.2 Flux Broadcast Ltd
- 13.1.2.1. Company Overview
- 13.1.2.2. Products
- 13.1.2.3. Company Financials
- 13.1.2.4. SWOT Analysis
- 13.1.3 Huya Inc
- 13.1.3.1. Company Overview
- 13.1.3.2. Products
- 13.1.3.3. Company Financials
- 13.1.3.4. SWOT Analysis
- 13.1.4 Twitch Interactive Inc
- 13.1.4.1. Company Overview
- 13.1.4.2. Products
- 13.1.4.3. Company Financials
- 13.1.4.4. SWOT Analysis
- 13.1.5 Vimeo Inc
- 13.1.5.1. Company Overview
- 13.1.5.2. Products
- 13.1.5.3. Company Financials
- 13.1.5.4. SWOT Analysis
- 13.1.6 Pluto Inc
- 13.1.6.1. Company Overview
- 13.1.6.2. Products
- 13.1.6.3. Company Financials
- 13.1.6.4. SWOT Analysis
- 13.1.7 BoxCast
- 13.1.7.1. Company Overview
- 13.1.7.2. Products
- 13.1.7.3. Company Financials
- 13.1.7.4. SWOT Analysis
- 13.1.8 Uplynk by Edigo
- 13.1.8.1. Company Overview
- 13.1.8.2. Products
- 13.1.8.3. Company Financials
- 13.1.8.4. SWOT Analysis
- 13.1.9 Wowza Streaming Engine
- 13.1.9.1. Company Overview
- 13.1.9.2. Products
- 13.1.9.3. Company Financials
- 13.1.9.4. SWOT Analysis
- 13.1.10 Stream Hatchet*List Not Exhaustive
- 13.1.10.1. Company Overview
- 13.1.10.2. Products
- 13.1.10.3. Company Financials
- 13.1.10.4. SWOT Analysis
- 13.1.1 Dacast Inc
- 13.2. Market Entropy
- 13.2.1 Company's Key Areas Served
- 13.2.2 Recent Developments
- 13.3. Company Market Share Analysis 2025
- 13.3.1 Top 5 Companies Market Share Analysis
- 13.3.2 Top 3 Companies Market Share Analysis
- 13.4. List of Potential Customers
- 14. Research Methodology
List of Figures
- Figure 1: Global Live Streaming Market Revenue Breakdown (Million, %) by Region 2025 & 2033
- Figure 2: Global Live Streaming Market Volume Breakdown (Billion, %) by Region 2025 & 2033
- Figure 3: North America Live Streaming Market Revenue (Million), by Component 2025 & 2033
- Figure 4: North America Live Streaming Market Volume (Billion), by Component 2025 & 2033
- Figure 5: North America Live Streaming Market Revenue Share (%), by Component 2025 & 2033
- Figure 6: North America Live Streaming Market Volume Share (%), by Component 2025 & 2033
- Figure 7: North America Live Streaming Market Revenue (Million), by Type 2025 & 2033
- Figure 8: North America Live Streaming Market Volume (Billion), by Type 2025 & 2033
- Figure 9: North America Live Streaming Market Revenue Share (%), by Type 2025 & 2033
- Figure 10: North America Live Streaming Market Volume Share (%), by Type 2025 & 2033
- Figure 11: North America Live Streaming Market Revenue (Million), by End-user Vertical 2025 & 2033
- Figure 12: North America Live Streaming Market Volume (Billion), by End-user Vertical 2025 & 2033
- Figure 13: North America Live Streaming Market Revenue Share (%), by End-user Vertical 2025 & 2033
- Figure 14: North America Live Streaming Market Volume Share (%), by End-user Vertical 2025 & 2033
- Figure 15: North America Live Streaming Market Revenue (Million), by Country 2025 & 2033
- Figure 16: North America Live Streaming Market Volume (Billion), by Country 2025 & 2033
- Figure 17: North America Live Streaming Market Revenue Share (%), by Country 2025 & 2033
- Figure 18: North America Live Streaming Market Volume Share (%), by Country 2025 & 2033
- Figure 19: Europe Live Streaming Market Revenue (Million), by Component 2025 & 2033
- Figure 20: Europe Live Streaming Market Volume (Billion), by Component 2025 & 2033
- Figure 21: Europe Live Streaming Market Revenue Share (%), by Component 2025 & 2033
- Figure 22: Europe Live Streaming Market Volume Share (%), by Component 2025 & 2033
- Figure 23: Europe Live Streaming Market Revenue (Million), by Type 2025 & 2033
- Figure 24: Europe Live Streaming Market Volume (Billion), by Type 2025 & 2033
- Figure 25: Europe Live Streaming Market Revenue Share (%), by Type 2025 & 2033
- Figure 26: Europe Live Streaming Market Volume Share (%), by Type 2025 & 2033
- Figure 27: Europe Live Streaming Market Revenue (Million), by End-user Vertical 2025 & 2033
- Figure 28: Europe Live Streaming Market Volume (Billion), by End-user Vertical 2025 & 2033
- Figure 29: Europe Live Streaming Market Revenue Share (%), by End-user Vertical 2025 & 2033
- Figure 30: Europe Live Streaming Market Volume Share (%), by End-user Vertical 2025 & 2033
- Figure 31: Europe Live Streaming Market Revenue (Million), by Country 2025 & 2033
- Figure 32: Europe Live Streaming Market Volume (Billion), by Country 2025 & 2033
- Figure 33: Europe Live Streaming Market Revenue Share (%), by Country 2025 & 2033
- Figure 34: Europe Live Streaming Market Volume Share (%), by Country 2025 & 2033
- Figure 35: Asia Live Streaming Market Revenue (Million), by Component 2025 & 2033
- Figure 36: Asia Live Streaming Market Volume (Billion), by Component 2025 & 2033
- Figure 37: Asia Live Streaming Market Revenue Share (%), by Component 2025 & 2033
- Figure 38: Asia Live Streaming Market Volume Share (%), by Component 2025 & 2033
- Figure 39: Asia Live Streaming Market Revenue (Million), by Type 2025 & 2033
- Figure 40: Asia Live Streaming Market Volume (Billion), by Type 2025 & 2033
- Figure 41: Asia Live Streaming Market Revenue Share (%), by Type 2025 & 2033
- Figure 42: Asia Live Streaming Market Volume Share (%), by Type 2025 & 2033
- Figure 43: Asia Live Streaming Market Revenue (Million), by End-user Vertical 2025 & 2033
- Figure 44: Asia Live Streaming Market Volume (Billion), by End-user Vertical 2025 & 2033
- Figure 45: Asia Live Streaming Market Revenue Share (%), by End-user Vertical 2025 & 2033
- Figure 46: Asia Live Streaming Market Volume Share (%), by End-user Vertical 2025 & 2033
- Figure 47: Asia Live Streaming Market Revenue (Million), by Country 2025 & 2033
- Figure 48: Asia Live Streaming Market Volume (Billion), by Country 2025 & 2033
- Figure 49: Asia Live Streaming Market Revenue Share (%), by Country 2025 & 2033
- Figure 50: Asia Live Streaming Market Volume Share (%), by Country 2025 & 2033
- Figure 51: Australia and New Zealand Live Streaming Market Revenue (Million), by Component 2025 & 2033
- Figure 52: Australia and New Zealand Live Streaming Market Volume (Billion), by Component 2025 & 2033
- Figure 53: Australia and New Zealand Live Streaming Market Revenue Share (%), by Component 2025 & 2033
- Figure 54: Australia and New Zealand Live Streaming Market Volume Share (%), by Component 2025 & 2033
- Figure 55: Australia and New Zealand Live Streaming Market Revenue (Million), by Type 2025 & 2033
- Figure 56: Australia and New Zealand Live Streaming Market Volume (Billion), by Type 2025 & 2033
- Figure 57: Australia and New Zealand Live Streaming Market Revenue Share (%), by Type 2025 & 2033
- Figure 58: Australia and New Zealand Live Streaming Market Volume Share (%), by Type 2025 & 2033
- Figure 59: Australia and New Zealand Live Streaming Market Revenue (Million), by End-user Vertical 2025 & 2033
- Figure 60: Australia and New Zealand Live Streaming Market Volume (Billion), by End-user Vertical 2025 & 2033
- Figure 61: Australia and New Zealand Live Streaming Market Revenue Share (%), by End-user Vertical 2025 & 2033
- Figure 62: Australia and New Zealand Live Streaming Market Volume Share (%), by End-user Vertical 2025 & 2033
- Figure 63: Australia and New Zealand Live Streaming Market Revenue (Million), by Country 2025 & 2033
- Figure 64: Australia and New Zealand Live Streaming Market Volume (Billion), by Country 2025 & 2033
- Figure 65: Australia and New Zealand Live Streaming Market Revenue Share (%), by Country 2025 & 2033
- Figure 66: Australia and New Zealand Live Streaming Market Volume Share (%), by Country 2025 & 2033
- Figure 67: Latin America Live Streaming Market Revenue (Million), by Component 2025 & 2033
- Figure 68: Latin America Live Streaming Market Volume (Billion), by Component 2025 & 2033
- Figure 69: Latin America Live Streaming Market Revenue Share (%), by Component 2025 & 2033
- Figure 70: Latin America Live Streaming Market Volume Share (%), by Component 2025 & 2033
- Figure 71: Latin America Live Streaming Market Revenue (Million), by Type 2025 & 2033
- Figure 72: Latin America Live Streaming Market Volume (Billion), by Type 2025 & 2033
- Figure 73: Latin America Live Streaming Market Revenue Share (%), by Type 2025 & 2033
- Figure 74: Latin America Live Streaming Market Volume Share (%), by Type 2025 & 2033
- Figure 75: Latin America Live Streaming Market Revenue (Million), by End-user Vertical 2025 & 2033
- Figure 76: Latin America Live Streaming Market Volume (Billion), by End-user Vertical 2025 & 2033
- Figure 77: Latin America Live Streaming Market Revenue Share (%), by End-user Vertical 2025 & 2033
- Figure 78: Latin America Live Streaming Market Volume Share (%), by End-user Vertical 2025 & 2033
- Figure 79: Latin America Live Streaming Market Revenue (Million), by Country 2025 & 2033
- Figure 80: Latin America Live Streaming Market Volume (Billion), by Country 2025 & 2033
- Figure 81: Latin America Live Streaming Market Revenue Share (%), by Country 2025 & 2033
- Figure 82: Latin America Live Streaming Market Volume Share (%), by Country 2025 & 2033
- Figure 83: Middle East and Africa Live Streaming Market Revenue (Million), by Component 2025 & 2033
- Figure 84: Middle East and Africa Live Streaming Market Volume (Billion), by Component 2025 & 2033
- Figure 85: Middle East and Africa Live Streaming Market Revenue Share (%), by Component 2025 & 2033
- Figure 86: Middle East and Africa Live Streaming Market Volume Share (%), by Component 2025 & 2033
- Figure 87: Middle East and Africa Live Streaming Market Revenue (Million), by Type 2025 & 2033
- Figure 88: Middle East and Africa Live Streaming Market Volume (Billion), by Type 2025 & 2033
- Figure 89: Middle East and Africa Live Streaming Market Revenue Share (%), by Type 2025 & 2033
- Figure 90: Middle East and Africa Live Streaming Market Volume Share (%), by Type 2025 & 2033
- Figure 91: Middle East and Africa Live Streaming Market Revenue (Million), by End-user Vertical 2025 & 2033
- Figure 92: Middle East and Africa Live Streaming Market Volume (Billion), by End-user Vertical 2025 & 2033
- Figure 93: Middle East and Africa Live Streaming Market Revenue Share (%), by End-user Vertical 2025 & 2033
- Figure 94: Middle East and Africa Live Streaming Market Volume Share (%), by End-user Vertical 2025 & 2033
- Figure 95: Middle East and Africa Live Streaming Market Revenue (Million), by Country 2025 & 2033
- Figure 96: Middle East and Africa Live Streaming Market Volume (Billion), by Country 2025 & 2033
- Figure 97: Middle East and Africa Live Streaming Market Revenue Share (%), by Country 2025 & 2033
- Figure 98: Middle East and Africa Live Streaming Market Volume Share (%), by Country 2025 & 2033
List of Tables
- Table 1: Global Live Streaming Market Revenue Million Forecast, by Component 2020 & 2033
- Table 2: Global Live Streaming Market Volume Billion Forecast, by Component 2020 & 2033
- Table 3: Global Live Streaming Market Revenue Million Forecast, by Type 2020 & 2033
- Table 4: Global Live Streaming Market Volume Billion Forecast, by Type 2020 & 2033
- Table 5: Global Live Streaming Market Revenue Million Forecast, by End-user Vertical 2020 & 2033
- Table 6: Global Live Streaming Market Volume Billion Forecast, by End-user Vertical 2020 & 2033
- Table 7: Global Live Streaming Market Revenue Million Forecast, by Region 2020 & 2033
- Table 8: Global Live Streaming Market Volume Billion Forecast, by Region 2020 & 2033
- Table 9: Global Live Streaming Market Revenue Million Forecast, by Component 2020 & 2033
- Table 10: Global Live Streaming Market Volume Billion Forecast, by Component 2020 & 2033
- Table 11: Global Live Streaming Market Revenue Million Forecast, by Type 2020 & 2033
- Table 12: Global Live Streaming Market Volume Billion Forecast, by Type 2020 & 2033
- Table 13: Global Live Streaming Market Revenue Million Forecast, by End-user Vertical 2020 & 2033
- Table 14: Global Live Streaming Market Volume Billion Forecast, by End-user Vertical 2020 & 2033
- Table 15: Global Live Streaming Market Revenue Million Forecast, by Country 2020 & 2033
- Table 16: Global Live Streaming Market Volume Billion Forecast, by Country 2020 & 2033
- Table 17: Global Live Streaming Market Revenue Million Forecast, by Component 2020 & 2033
- Table 18: Global Live Streaming Market Volume Billion Forecast, by Component 2020 & 2033
- Table 19: Global Live Streaming Market Revenue Million Forecast, by Type 2020 & 2033
- Table 20: Global Live Streaming Market Volume Billion Forecast, by Type 2020 & 2033
- Table 21: Global Live Streaming Market Revenue Million Forecast, by End-user Vertical 2020 & 2033
- Table 22: Global Live Streaming Market Volume Billion Forecast, by End-user Vertical 2020 & 2033
- Table 23: Global Live Streaming Market Revenue Million Forecast, by Country 2020 & 2033
- Table 24: Global Live Streaming Market Volume Billion Forecast, by Country 2020 & 2033
- Table 25: Global Live Streaming Market Revenue Million Forecast, by Component 2020 & 2033
- Table 26: Global Live Streaming Market Volume Billion Forecast, by Component 2020 & 2033
- Table 27: Global Live Streaming Market Revenue Million Forecast, by Type 2020 & 2033
- Table 28: Global Live Streaming Market Volume Billion Forecast, by Type 2020 & 2033
- Table 29: Global Live Streaming Market Revenue Million Forecast, by End-user Vertical 2020 & 2033
- Table 30: Global Live Streaming Market Volume Billion Forecast, by End-user Vertical 2020 & 2033
- Table 31: Global Live Streaming Market Revenue Million Forecast, by Country 2020 & 2033
- Table 32: Global Live Streaming Market Volume Billion Forecast, by Country 2020 & 2033
- Table 33: Global Live Streaming Market Revenue Million Forecast, by Component 2020 & 2033
- Table 34: Global Live Streaming Market Volume Billion Forecast, by Component 2020 & 2033
- Table 35: Global Live Streaming Market Revenue Million Forecast, by Type 2020 & 2033
- Table 36: Global Live Streaming Market Volume Billion Forecast, by Type 2020 & 2033
- Table 37: Global Live Streaming Market Revenue Million Forecast, by End-user Vertical 2020 & 2033
- Table 38: Global Live Streaming Market Volume Billion Forecast, by End-user Vertical 2020 & 2033
- Table 39: Global Live Streaming Market Revenue Million Forecast, by Country 2020 & 2033
- Table 40: Global Live Streaming Market Volume Billion Forecast, by Country 2020 & 2033
- Table 41: Global Live Streaming Market Revenue Million Forecast, by Component 2020 & 2033
- Table 42: Global Live Streaming Market Volume Billion Forecast, by Component 2020 & 2033
- Table 43: Global Live Streaming Market Revenue Million Forecast, by Type 2020 & 2033
- Table 44: Global Live Streaming Market Volume Billion Forecast, by Type 2020 & 2033
- Table 45: Global Live Streaming Market Revenue Million Forecast, by End-user Vertical 2020 & 2033
- Table 46: Global Live Streaming Market Volume Billion Forecast, by End-user Vertical 2020 & 2033
- Table 47: Global Live Streaming Market Revenue Million Forecast, by Country 2020 & 2033
- Table 48: Global Live Streaming Market Volume Billion Forecast, by Country 2020 & 2033
- Table 49: Global Live Streaming Market Revenue Million Forecast, by Component 2020 & 2033
- Table 50: Global Live Streaming Market Volume Billion Forecast, by Component 2020 & 2033
- Table 51: Global Live Streaming Market Revenue Million Forecast, by Type 2020 & 2033
- Table 52: Global Live Streaming Market Volume Billion Forecast, by Type 2020 & 2033
- Table 53: Global Live Streaming Market Revenue Million Forecast, by End-user Vertical 2020 & 2033
- Table 54: Global Live Streaming Market Volume Billion Forecast, by End-user Vertical 2020 & 2033
- Table 55: Global Live Streaming Market Revenue Million Forecast, by Country 2020 & 2033
- Table 56: Global Live Streaming Market Volume Billion Forecast, by Country 2020 & 2033
Frequently Asked Questions
1. What is the projected Compound Annual Growth Rate (CAGR) of the Live Streaming Market?
The projected CAGR is approximately 27.45%.
2. Which companies are prominent players in the Live Streaming Market?
Key companies in the market include Dacast Inc, Flux Broadcast Ltd, Huya Inc, Twitch Interactive Inc, Vimeo Inc, Pluto Inc, BoxCast, Uplynk by Edigo, Wowza Streaming Engine, Stream Hatchet*List Not Exhaustive.
3. What are the main segments of the Live Streaming Market?
The market segments include Component, Type, End-user Vertical.
4. Can you provide details about the market size?
The market size is estimated to be USD 59.07 Million as of 2022.
5. What are some drivers contributing to market growth?
Increasing Penetration Towards Greater Brand Engagement and Reach Through Live Videos; Increasing Penetration of Internet and Smartphone.
6. What are the notable trends driving market growth?
Gaming to Hold Significant Share for Market.
7. Are there any restraints impacting market growth?
Increasing Penetration Towards Greater Brand Engagement and Reach Through Live Videos; Increasing Penetration of Internet and Smartphone.
8. Can you provide examples of recent developments in the market?
September 2024: Dolby unveils a new comprehensive range of cloud video products and solutions supporting real-time interactive streaming. This comes on the heels of Dolby’s recent acquisition of THEO Technologies, a leading provider of high-quality video streaming tools embraced by top sports, media, and entertainment companies worldwide.July 2024: Warner Bros. Discovery (WBD) has unveiled a slew of special streaming features and innovations for its coverage of the 2024 Paris Olympic Games, including timeline markers, gold medal alerts and more. Timeline markers will allow viewers to easily navigate back through an event timeline to key moments. This feature is available across all platforms for discovery+ users, covering 15 sports, including beach volleyball, handball, tennis and more.
9. What pricing options are available for accessing the report?
Pricing options include single-user, multi-user, and enterprise licenses priced at USD 4750, USD 5250, and USD 8750 respectively.
10. Is the market size provided in terms of value or volume?
The market size is provided in terms of value, measured in Million and volume, measured in Billion.
11. Are there any specific market keywords associated with the report?
Yes, the market keyword associated with the report is "Live Streaming Market," which aids in identifying and referencing the specific market segment covered.
12. How do I determine which pricing option suits my needs best?
The pricing options vary based on user requirements and access needs. Individual users may opt for single-user licenses, while businesses requiring broader access may choose multi-user or enterprise licenses for cost-effective access to the report.
13. Are there any additional resources or data provided in the Live Streaming Market report?
While the report offers comprehensive insights, it's advisable to review the specific contents or supplementary materials provided to ascertain if additional resources or data are available.
14. How can I stay updated on further developments or reports in the Live Streaming Market?
To stay informed about further developments, trends, and reports in the Live Streaming Market, consider subscribing to industry newsletters, following relevant companies and organizations, or regularly checking reputable industry news sources and publications.
Methodology
Step 1 - Identification of Relevant Samples Size from Population Database


Step 2 - Approaches for Defining Global Market Size (Value, Volume* & Price*)

Note*: In applicable scenarios
Step 3 - Data Sources
Primary Research
- Web Analytics
- Survey Reports
- Research Institute
- Latest Research Reports
- Opinion Leaders
Secondary Research
- Annual Reports
- White Paper
- Latest Press Release
- Industry Association
- Paid Database
- Investor Presentations

Step 4 - Data Triangulation
Involves using different sources of information in order to increase the validity of a study
These sources are likely to be stakeholders in a program - participants, other researchers, program staff, other community members, and so on.
Then we put all data in single framework & apply various statistical tools to find out the dynamic on the market.
During the analysis stage, feedback from the stakeholder groups would be compared to determine areas of agreement as well as areas of divergence