
Key Insights
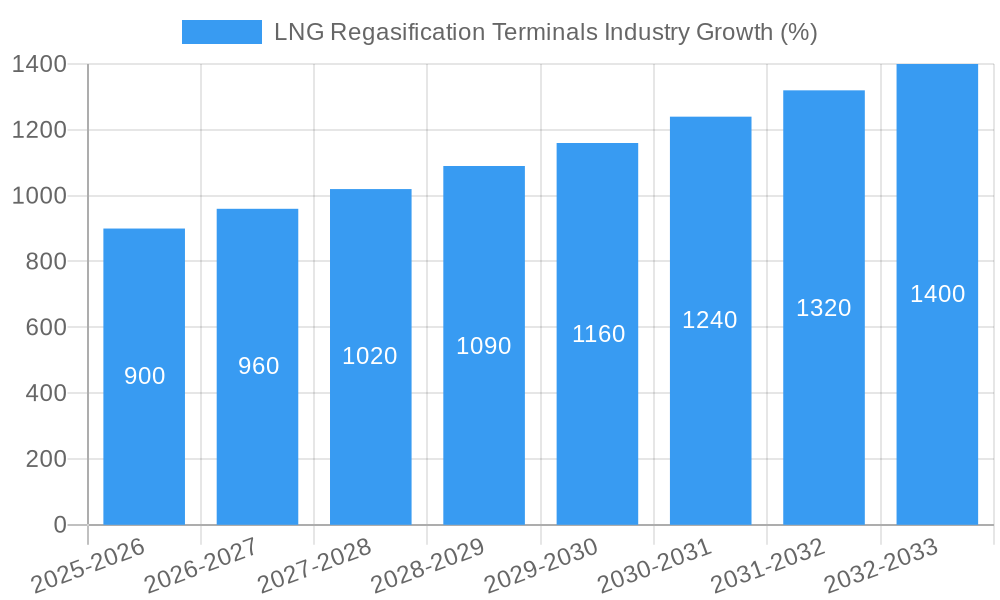
The LNG regasification terminal market is experiencing robust growth, driven by increasing global demand for natural gas, particularly in regions seeking cleaner energy sources and diversifying their energy portfolios. A CAGR of 5.60% from 2019-2033 suggests a significant expansion, with the market value expected to substantially increase from its 2025 level. Key drivers include stringent environmental regulations promoting a shift away from coal, the rising prevalence of power generation based on natural gas, and the growing need for energy security in various nations. The market is segmented by terminal type (large-scale, small & medium-scale) and deployment (onshore, floating). Large-scale terminals dominate currently, but smaller, more adaptable floating terminals are gaining traction due to their flexibility and reduced capital investment requirements. Growth is expected to be particularly strong in Asia-Pacific regions experiencing rapid industrialization and increasing energy consumption, followed by Europe and North America, each responding to distinct energy needs and supply chain considerations. While regulatory hurdles and high initial capital investment can act as restraints, ongoing technological advancements and favorable government policies are mitigating these challenges. Major players like Shell, Engie, and Fluor Corporation are actively shaping the market through strategic investments and technological innovations.
The forecast period (2025-2033) promises continued growth, albeit potentially at a slightly moderated pace as the market matures. However, emerging economies' increasing energy demand, coupled with global efforts to transition to cleaner energy, indicate a sustained need for LNG regasification infrastructure. This necessitates ongoing innovation and investment in terminal capacity, particularly in the deployment of floating regasification units (FRUs) to cater to more dispersed and geographically challenging locations. Competition among major players will intensify, leading to strategic partnerships and mergers and acquisitions to consolidate market share and technological advancements. The long-term outlook for the LNG regasification terminals market remains positive, with potential for further segmentation and specialization based on evolving market needs.

LNG Regasification Terminals Industry: A Comprehensive Market Report (2019-2033)
This comprehensive report provides an in-depth analysis of the global LNG Regasification Terminals industry, covering market structure, dynamics, key players, and future outlook from 2019 to 2033. The study period spans 2019-2033, with 2025 as the base and estimated year. The forecast period is 2025-2033, and the historical period is 2019-2024. This report is essential for industry professionals, investors, and stakeholders seeking actionable insights into this rapidly evolving market.
LNG Regasification Terminals Industry Market Structure & Innovation Trends
This section analyzes the competitive landscape, innovation drivers, and regulatory influences shaping the LNG Regasification Terminals market. We examine market concentration, identifying key players and their respective market shares. The analysis also explores mergers and acquisitions (M&A) activities, including deal values, and their impact on market consolidation. Innovation drivers such as technological advancements and evolving environmental regulations are discussed, alongside an assessment of product substitutes and their potential market disruption. Finally, end-user demographics and their influence on market demand are considered.
- Market Concentration: The market exhibits a moderately concentrated structure, with a few major players holding significant market share. We estimate that the top five players collectively hold approximately XX% of the market in 2025.
- M&A Activity: Significant M&A activity was observed during the historical period, with deal values totaling approximately $XX Million. These activities have primarily focused on expanding geographic reach and technological capabilities.
- Innovation Drivers: Technological advancements in LNG regasification technologies, driven by the need for efficiency and reduced environmental impact, are key drivers of innovation. Stringent environmental regulations are also pushing for more sustainable solutions.
- Regulatory Framework: Regulatory frameworks vary significantly across regions, impacting investment decisions and market entry. The analysis includes a detailed review of key regulatory aspects.
- Product Substitutes: While limited, alternative energy sources and transportation methods pose a potential threat, particularly in specific geographical locations and market segments.
LNG Regasification Terminals Industry Market Dynamics & Trends
This section delves into the market's growth trajectory, analyzing key drivers and disruptive forces. We project a Compound Annual Growth Rate (CAGR) of XX% during the forecast period (2025-2033), driven by factors such as increasing global demand for LNG, expanding energy infrastructure, and government initiatives promoting energy diversification. The analysis also incorporates the impact of technological disruptions, shifts in consumer preferences, and intensified competitive dynamics on market penetration. Specific metrics, including CAGR and market penetration rates, are presented with detailed explanations.
Dominant Regions & Segments in LNG Regasification Terminals Industry
This section identifies the leading regions and segments within the LNG Regasification Terminals market. We analyze market dominance based on terminal type (large-scale, small-scale & medium-scale), deployment (onshore, floating), and geographical location. Key drivers for each segment's dominance are explored, including economic policies, infrastructure development, and regulatory environments.
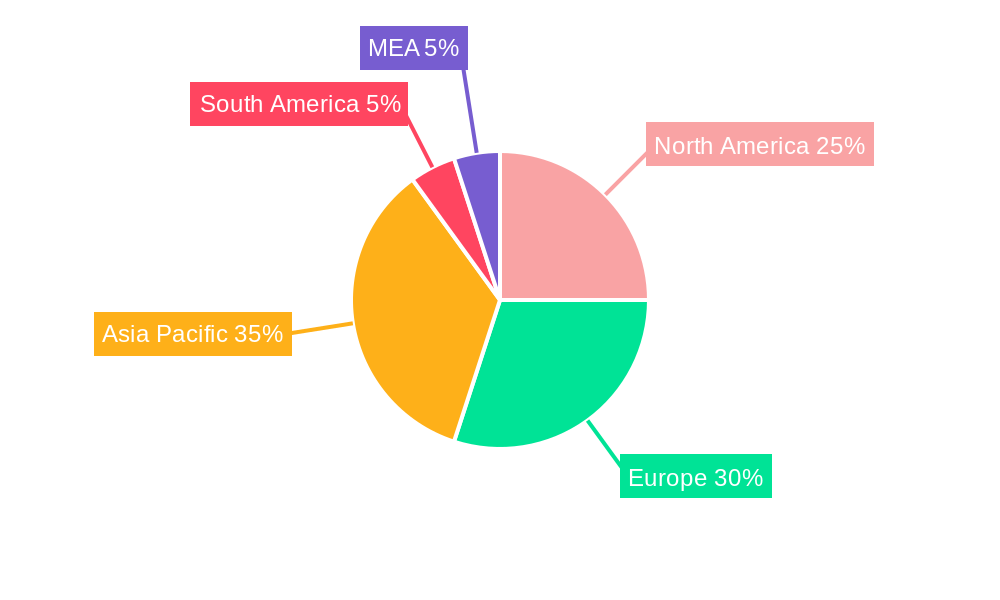
- Dominant Region: Asia-Pacific is projected to be the dominant region throughout the forecast period due to high energy demand and extensive infrastructure development.
- Dominant Terminal Type: Large-scale terminals are expected to remain dominant due to economies of scale and logistical advantages.
- Dominant Deployment: Onshore terminals currently hold a larger market share but Floating Storage Regasification Units (FSRUs) are expected to gain significant traction.
Key Drivers:
- Asia-Pacific: Rapid industrialization, increasing energy demand, and supportive government policies.
- Large-Scale Terminals: Economies of scale, efficient operations, and lower unit costs.
- Onshore Terminals: Established infrastructure and lower initial investment costs. However, FSRUs are gaining popularity due to flexibility and faster deployment times.
LNG Regasification Terminals Industry Product Innovations
This section summarizes recent advancements in LNG regasification technologies, highlighting their applications and competitive advantages. We discuss technological trends driving innovation, such as enhanced efficiency, reduced emissions, and improved safety features. The analysis also explores how these innovations are shaping market competition and consumer preferences.
Report Scope & Segmentation Analysis
This report segments the LNG regasification terminals market by terminal type (large-scale, small-scale & medium-scale) and deployment (onshore, floating). Each segment's growth projections, market sizes, and competitive dynamics are detailed.
- Large-Scale Terminals: These terminals dominate the market in terms of capacity and revenue, with XX Million in projected revenue in 2033.
- Small-Scale & Medium-Scale Terminals: These segments are experiencing significant growth, driven by increased demand in smaller markets and regions with limited infrastructure. Projected revenue in 2033 is XX Million.
- Onshore Terminals: The majority of existing terminals are onshore, offering stability but requiring significant upfront investment. The projected market size for 2033 is XX Million.
- Floating Terminals (FSRUs): FSRUs are gaining traction due to their flexibility and faster deployment times, showing a strong growth trajectory. The projected market size for 2033 is XX Million.
Key Drivers of LNG Regasification Terminals Industry Growth
The growth of the LNG regasification terminals industry is driven by several key factors, including increasing global demand for natural gas, expansion of LNG infrastructure, rising energy security concerns, and supportive government policies promoting LNG adoption. Technological advancements resulting in improved efficiency and reduced environmental impact are additional growth drivers.
Challenges in the LNG Regasification Terminals Industry Sector
The LNG regasification terminals industry faces several challenges, including high capital expenditure, regulatory complexities, potential environmental concerns, and competition from other energy sources. Supply chain disruptions and geopolitical instability can also significantly impact market stability and profitability. The combined impact of these challenges on industry revenue is estimated to be around XX Million annually.
Emerging Opportunities in LNG Regasification Terminals Industry
Emerging opportunities exist in the development of smaller-scale regasification terminals, particularly in emerging markets with limited infrastructure. Furthermore, innovations in floating LNG (FLNG) technologies and the integration of renewable energy sources offer promising growth avenues. Additionally, advancements in carbon capture and storage technologies are expected to mitigate environmental concerns and boost market attractiveness.
Leading Players in the LNG Regasification Terminals Industry Market
- Shell PLC
- Engie SA
- Fluor Corporation
- Weatherford International PLC
- Wartsila Oyj ABP
- Linde plc
- Baker Hughes Company
- Schlumberger Limited
Key Developments in LNG Regasification Terminals Industry
- September 2021: South Africa announces plans for its first LNG import and distribution terminal at the Ngqura deepwater port, opting for an FSRU configuration. This signifies market expansion into new regions.
- January 2021: ExxonMobil and Royal Vopak sign an MOU to conduct a feasibility study for an LNG regasification terminal in South Africa, highlighting increased investor interest and potential future projects.
Future Outlook for LNG Regasification Terminals Industry Market
The future outlook for the LNG regasification terminals industry is positive, driven by sustained growth in global LNG demand, ongoing investments in infrastructure development, and the increasing adoption of LNG as a cleaner energy source. Strategic partnerships and technological advancements will continue to shape market dynamics, creating new opportunities for market players. The industry is poised for significant growth, with substantial potential for expansion into new markets and segments.
LNG Regasification Terminals Industry Segmentation
-
1. Terminal Type
- 1.1. large Scale
- 1.2. Small Scale & Medium
-
2. Deployment
- 2.1. Onshore
- 2.2. Floating
LNG Regasification Terminals Industry Segmentation By Geography
- 1. North America
- 2. South America
- 3. Asia Pacific
- 4. Europe
- 5. Middle East and Africa
LNG Regasification Terminals Industry REPORT HIGHLIGHTS
| Aspects | Details |
|---|---|
| Study Period | 2019-2033 |
| Base Year | 2024 |
| Estimated Year | 2025 |
| Forecast Period | 2025-2033 |
| Historical Period | 2019-2024 |
| Growth Rate | CAGR of 5.60% from 2019-2033 |
| Segmentation |
|
Table of Contents
- 1. Introduction
- 1.1. Research Scope
- 1.2. Market Segmentation
- 1.3. Research Methodology
- 1.4. Definitions and Assumptions
- 2. Executive Summary
- 2.1. Introduction
- 3. Market Dynamics
- 3.1. Introduction
- 3.2. Market Drivers
- 3.2.1. 4.; The Rise in Oil and Gas Drilling Activities4.; Increased Shale Gas Exploration
- 3.3. Market Restrains
- 3.3.1. 4.; Increasing Share of Renewable Energy
- 3.4. Market Trends
- 3.4.1. The Floating Regasification Terminals Segment is Expected to Dominate the Market
- 4. Market Factor Analysis
- 4.1. Porters Five Forces
- 4.2. Supply/Value Chain
- 4.3. PESTEL analysis
- 4.4. Market Entropy
- 4.5. Patent/Trademark Analysis
- 5. Global LNG Regasification Terminals Industry Analysis, Insights and Forecast, 2019-2031
- 5.1. Market Analysis, Insights and Forecast - by Terminal Type
- 5.1.1. large Scale
- 5.1.2. Small Scale & Medium
- 5.2. Market Analysis, Insights and Forecast - by Deployment
- 5.2.1. Onshore
- 5.2.2. Floating
- 5.3. Market Analysis, Insights and Forecast - by Region
- 5.3.1. North America
- 5.3.2. South America
- 5.3.3. Asia Pacific
- 5.3.4. Europe
- 5.3.5. Middle East and Africa
- 5.1. Market Analysis, Insights and Forecast - by Terminal Type
- 6. North America LNG Regasification Terminals Industry Analysis, Insights and Forecast, 2019-2031
- 6.1. Market Analysis, Insights and Forecast - by Terminal Type
- 6.1.1. large Scale
- 6.1.2. Small Scale & Medium
- 6.2. Market Analysis, Insights and Forecast - by Deployment
- 6.2.1. Onshore
- 6.2.2. Floating
- 6.1. Market Analysis, Insights and Forecast - by Terminal Type
- 7. South America LNG Regasification Terminals Industry Analysis, Insights and Forecast, 2019-2031
- 7.1. Market Analysis, Insights and Forecast - by Terminal Type
- 7.1.1. large Scale
- 7.1.2. Small Scale & Medium
- 7.2. Market Analysis, Insights and Forecast - by Deployment
- 7.2.1. Onshore
- 7.2.2. Floating
- 7.1. Market Analysis, Insights and Forecast - by Terminal Type
- 8. Asia Pacific LNG Regasification Terminals Industry Analysis, Insights and Forecast, 2019-2031
- 8.1. Market Analysis, Insights and Forecast - by Terminal Type
- 8.1.1. large Scale
- 8.1.2. Small Scale & Medium
- 8.2. Market Analysis, Insights and Forecast - by Deployment
- 8.2.1. Onshore
- 8.2.2. Floating
- 8.1. Market Analysis, Insights and Forecast - by Terminal Type
- 9. Europe LNG Regasification Terminals Industry Analysis, Insights and Forecast, 2019-2031
- 9.1. Market Analysis, Insights and Forecast - by Terminal Type
- 9.1.1. large Scale
- 9.1.2. Small Scale & Medium
- 9.2. Market Analysis, Insights and Forecast - by Deployment
- 9.2.1. Onshore
- 9.2.2. Floating
- 9.1. Market Analysis, Insights and Forecast - by Terminal Type
- 10. Middle East and Africa LNG Regasification Terminals Industry Analysis, Insights and Forecast, 2019-2031
- 10.1. Market Analysis, Insights and Forecast - by Terminal Type
- 10.1.1. large Scale
- 10.1.2. Small Scale & Medium
- 10.2. Market Analysis, Insights and Forecast - by Deployment
- 10.2.1. Onshore
- 10.2.2. Floating
- 10.1. Market Analysis, Insights and Forecast - by Terminal Type
- 11. North America LNG Regasification Terminals Industry Analysis, Insights and Forecast, 2019-2031
- 11.1. Market Analysis, Insights and Forecast - By Country/Sub-region
- 11.1.1 United States
- 11.1.2 Canada
- 11.1.3 Mexico
- 12. Europe LNG Regasification Terminals Industry Analysis, Insights and Forecast, 2019-2031
- 12.1. Market Analysis, Insights and Forecast - By Country/Sub-region
- 12.1.1 Germany
- 12.1.2 United Kingdom
- 12.1.3 France
- 12.1.4 Spain
- 12.1.5 Italy
- 12.1.6 Spain
- 12.1.7 Belgium
- 12.1.8 Netherland
- 12.1.9 Nordics
- 12.1.10 Rest of Europe
- 13. Asia Pacific LNG Regasification Terminals Industry Analysis, Insights and Forecast, 2019-2031
- 13.1. Market Analysis, Insights and Forecast - By Country/Sub-region
- 13.1.1 China
- 13.1.2 Japan
- 13.1.3 India
- 13.1.4 South Korea
- 13.1.5 Southeast Asia
- 13.1.6 Australia
- 13.1.7 Indonesia
- 13.1.8 Phillipes
- 13.1.9 Singapore
- 13.1.10 Thailandc
- 13.1.11 Rest of Asia Pacific
- 14. South America LNG Regasification Terminals Industry Analysis, Insights and Forecast, 2019-2031
- 14.1. Market Analysis, Insights and Forecast - By Country/Sub-region
- 14.1.1 Brazil
- 14.1.2 Argentina
- 14.1.3 Peru
- 14.1.4 Chile
- 14.1.5 Colombia
- 14.1.6 Ecuador
- 14.1.7 Venezuela
- 14.1.8 Rest of South America
- 15. North America LNG Regasification Terminals Industry Analysis, Insights and Forecast, 2019-2031
- 15.1. Market Analysis, Insights and Forecast - By Country/Sub-region
- 15.1.1 United States
- 15.1.2 Canada
- 15.1.3 Mexico
- 16. MEA LNG Regasification Terminals Industry Analysis, Insights and Forecast, 2019-2031
- 16.1. Market Analysis, Insights and Forecast - By Country/Sub-region
- 16.1.1 United Arab Emirates
- 16.1.2 Saudi Arabia
- 16.1.3 South Africa
- 16.1.4 Rest of Middle East and Africa
- 17. Competitive Analysis
- 17.1. Global Market Share Analysis 2024
- 17.2. Company Profiles
- 17.2.1 Shell PLC
- 17.2.1.1. Overview
- 17.2.1.2. Products
- 17.2.1.3. SWOT Analysis
- 17.2.1.4. Recent Developments
- 17.2.1.5. Financials (Based on Availability)
- 17.2.2 Engie SA
- 17.2.2.1. Overview
- 17.2.2.2. Products
- 17.2.2.3. SWOT Analysis
- 17.2.2.4. Recent Developments
- 17.2.2.5. Financials (Based on Availability)
- 17.2.3 Fluor Corpoartion*List Not Exhaustive
- 17.2.3.1. Overview
- 17.2.3.2. Products
- 17.2.3.3. SWOT Analysis
- 17.2.3.4. Recent Developments
- 17.2.3.5. Financials (Based on Availability)
- 17.2.4 Weatherford International PLC
- 17.2.4.1. Overview
- 17.2.4.2. Products
- 17.2.4.3. SWOT Analysis
- 17.2.4.4. Recent Developments
- 17.2.4.5. Financials (Based on Availability)
- 17.2.5 Wartsila Oyj ABP
- 17.2.5.1. Overview
- 17.2.5.2. Products
- 17.2.5.3. SWOT Analysis
- 17.2.5.4. Recent Developments
- 17.2.5.5. Financials (Based on Availability)
- 17.2.6 Linde plc
- 17.2.6.1. Overview
- 17.2.6.2. Products
- 17.2.6.3. SWOT Analysis
- 17.2.6.4. Recent Developments
- 17.2.6.5. Financials (Based on Availability)
- 17.2.7 Baker Hughes Company
- 17.2.7.1. Overview
- 17.2.7.2. Products
- 17.2.7.3. SWOT Analysis
- 17.2.7.4. Recent Developments
- 17.2.7.5. Financials (Based on Availability)
- 17.2.8 Schlumberger Limited
- 17.2.8.1. Overview
- 17.2.8.2. Products
- 17.2.8.3. SWOT Analysis
- 17.2.8.4. Recent Developments
- 17.2.8.5. Financials (Based on Availability)
- 17.2.1 Shell PLC
List of Figures
- Figure 1: Global LNG Regasification Terminals Industry Revenue Breakdown (Million, %) by Region 2024 & 2032
- Figure 2: North America LNG Regasification Terminals Industry Revenue (Million), by Country 2024 & 2032
- Figure 3: North America LNG Regasification Terminals Industry Revenue Share (%), by Country 2024 & 2032
- Figure 4: Europe LNG Regasification Terminals Industry Revenue (Million), by Country 2024 & 2032
- Figure 5: Europe LNG Regasification Terminals Industry Revenue Share (%), by Country 2024 & 2032
- Figure 6: Asia Pacific LNG Regasification Terminals Industry Revenue (Million), by Country 2024 & 2032
- Figure 7: Asia Pacific LNG Regasification Terminals Industry Revenue Share (%), by Country 2024 & 2032
- Figure 8: South America LNG Regasification Terminals Industry Revenue (Million), by Country 2024 & 2032
- Figure 9: South America LNG Regasification Terminals Industry Revenue Share (%), by Country 2024 & 2032
- Figure 10: North America LNG Regasification Terminals Industry Revenue (Million), by Country 2024 & 2032
- Figure 11: North America LNG Regasification Terminals Industry Revenue Share (%), by Country 2024 & 2032
- Figure 12: MEA LNG Regasification Terminals Industry Revenue (Million), by Country 2024 & 2032
- Figure 13: MEA LNG Regasification Terminals Industry Revenue Share (%), by Country 2024 & 2032
- Figure 14: North America LNG Regasification Terminals Industry Revenue (Million), by Terminal Type 2024 & 2032
- Figure 15: North America LNG Regasification Terminals Industry Revenue Share (%), by Terminal Type 2024 & 2032
- Figure 16: North America LNG Regasification Terminals Industry Revenue (Million), by Deployment 2024 & 2032
- Figure 17: North America LNG Regasification Terminals Industry Revenue Share (%), by Deployment 2024 & 2032
- Figure 18: North America LNG Regasification Terminals Industry Revenue (Million), by Country 2024 & 2032
- Figure 19: North America LNG Regasification Terminals Industry Revenue Share (%), by Country 2024 & 2032
- Figure 20: South America LNG Regasification Terminals Industry Revenue (Million), by Terminal Type 2024 & 2032
- Figure 21: South America LNG Regasification Terminals Industry Revenue Share (%), by Terminal Type 2024 & 2032
- Figure 22: South America LNG Regasification Terminals Industry Revenue (Million), by Deployment 2024 & 2032
- Figure 23: South America LNG Regasification Terminals Industry Revenue Share (%), by Deployment 2024 & 2032
- Figure 24: South America LNG Regasification Terminals Industry Revenue (Million), by Country 2024 & 2032
- Figure 25: South America LNG Regasification Terminals Industry Revenue Share (%), by Country 2024 & 2032
- Figure 26: Asia Pacific LNG Regasification Terminals Industry Revenue (Million), by Terminal Type 2024 & 2032
- Figure 27: Asia Pacific LNG Regasification Terminals Industry Revenue Share (%), by Terminal Type 2024 & 2032
- Figure 28: Asia Pacific LNG Regasification Terminals Industry Revenue (Million), by Deployment 2024 & 2032
- Figure 29: Asia Pacific LNG Regasification Terminals Industry Revenue Share (%), by Deployment 2024 & 2032
- Figure 30: Asia Pacific LNG Regasification Terminals Industry Revenue (Million), by Country 2024 & 2032
- Figure 31: Asia Pacific LNG Regasification Terminals Industry Revenue Share (%), by Country 2024 & 2032
- Figure 32: Europe LNG Regasification Terminals Industry Revenue (Million), by Terminal Type 2024 & 2032
- Figure 33: Europe LNG Regasification Terminals Industry Revenue Share (%), by Terminal Type 2024 & 2032
- Figure 34: Europe LNG Regasification Terminals Industry Revenue (Million), by Deployment 2024 & 2032
- Figure 35: Europe LNG Regasification Terminals Industry Revenue Share (%), by Deployment 2024 & 2032
- Figure 36: Europe LNG Regasification Terminals Industry Revenue (Million), by Country 2024 & 2032
- Figure 37: Europe LNG Regasification Terminals Industry Revenue Share (%), by Country 2024 & 2032
- Figure 38: Middle East and Africa LNG Regasification Terminals Industry Revenue (Million), by Terminal Type 2024 & 2032
- Figure 39: Middle East and Africa LNG Regasification Terminals Industry Revenue Share (%), by Terminal Type 2024 & 2032
- Figure 40: Middle East and Africa LNG Regasification Terminals Industry Revenue (Million), by Deployment 2024 & 2032
- Figure 41: Middle East and Africa LNG Regasification Terminals Industry Revenue Share (%), by Deployment 2024 & 2032
- Figure 42: Middle East and Africa LNG Regasification Terminals Industry Revenue (Million), by Country 2024 & 2032
- Figure 43: Middle East and Africa LNG Regasification Terminals Industry Revenue Share (%), by Country 2024 & 2032
List of Tables
- Table 1: Global LNG Regasification Terminals Industry Revenue Million Forecast, by Region 2019 & 2032
- Table 2: Global LNG Regasification Terminals Industry Revenue Million Forecast, by Terminal Type 2019 & 2032
- Table 3: Global LNG Regasification Terminals Industry Revenue Million Forecast, by Deployment 2019 & 2032
- Table 4: Global LNG Regasification Terminals Industry Revenue Million Forecast, by Region 2019 & 2032
- Table 5: Global LNG Regasification Terminals Industry Revenue Million Forecast, by Country 2019 & 2032
- Table 6: United States LNG Regasification Terminals Industry Revenue (Million) Forecast, by Application 2019 & 2032
- Table 7: Canada LNG Regasification Terminals Industry Revenue (Million) Forecast, by Application 2019 & 2032
- Table 8: Mexico LNG Regasification Terminals Industry Revenue (Million) Forecast, by Application 2019 & 2032
- Table 9: Global LNG Regasification Terminals Industry Revenue Million Forecast, by Country 2019 & 2032
- Table 10: Germany LNG Regasification Terminals Industry Revenue (Million) Forecast, by Application 2019 & 2032
- Table 11: United Kingdom LNG Regasification Terminals Industry Revenue (Million) Forecast, by Application 2019 & 2032
- Table 12: France LNG Regasification Terminals Industry Revenue (Million) Forecast, by Application 2019 & 2032
- Table 13: Spain LNG Regasification Terminals Industry Revenue (Million) Forecast, by Application 2019 & 2032
- Table 14: Italy LNG Regasification Terminals Industry Revenue (Million) Forecast, by Application 2019 & 2032
- Table 15: Spain LNG Regasification Terminals Industry Revenue (Million) Forecast, by Application 2019 & 2032
- Table 16: Belgium LNG Regasification Terminals Industry Revenue (Million) Forecast, by Application 2019 & 2032
- Table 17: Netherland LNG Regasification Terminals Industry Revenue (Million) Forecast, by Application 2019 & 2032
- Table 18: Nordics LNG Regasification Terminals Industry Revenue (Million) Forecast, by Application 2019 & 2032
- Table 19: Rest of Europe LNG Regasification Terminals Industry Revenue (Million) Forecast, by Application 2019 & 2032
- Table 20: Global LNG Regasification Terminals Industry Revenue Million Forecast, by Country 2019 & 2032
- Table 21: China LNG Regasification Terminals Industry Revenue (Million) Forecast, by Application 2019 & 2032
- Table 22: Japan LNG Regasification Terminals Industry Revenue (Million) Forecast, by Application 2019 & 2032
- Table 23: India LNG Regasification Terminals Industry Revenue (Million) Forecast, by Application 2019 & 2032
- Table 24: South Korea LNG Regasification Terminals Industry Revenue (Million) Forecast, by Application 2019 & 2032
- Table 25: Southeast Asia LNG Regasification Terminals Industry Revenue (Million) Forecast, by Application 2019 & 2032
- Table 26: Australia LNG Regasification Terminals Industry Revenue (Million) Forecast, by Application 2019 & 2032
- Table 27: Indonesia LNG Regasification Terminals Industry Revenue (Million) Forecast, by Application 2019 & 2032
- Table 28: Phillipes LNG Regasification Terminals Industry Revenue (Million) Forecast, by Application 2019 & 2032
- Table 29: Singapore LNG Regasification Terminals Industry Revenue (Million) Forecast, by Application 2019 & 2032
- Table 30: Thailandc LNG Regasification Terminals Industry Revenue (Million) Forecast, by Application 2019 & 2032
- Table 31: Rest of Asia Pacific LNG Regasification Terminals Industry Revenue (Million) Forecast, by Application 2019 & 2032
- Table 32: Global LNG Regasification Terminals Industry Revenue Million Forecast, by Country 2019 & 2032
- Table 33: Brazil LNG Regasification Terminals Industry Revenue (Million) Forecast, by Application 2019 & 2032
- Table 34: Argentina LNG Regasification Terminals Industry Revenue (Million) Forecast, by Application 2019 & 2032
- Table 35: Peru LNG Regasification Terminals Industry Revenue (Million) Forecast, by Application 2019 & 2032
- Table 36: Chile LNG Regasification Terminals Industry Revenue (Million) Forecast, by Application 2019 & 2032
- Table 37: Colombia LNG Regasification Terminals Industry Revenue (Million) Forecast, by Application 2019 & 2032
- Table 38: Ecuador LNG Regasification Terminals Industry Revenue (Million) Forecast, by Application 2019 & 2032
- Table 39: Venezuela LNG Regasification Terminals Industry Revenue (Million) Forecast, by Application 2019 & 2032
- Table 40: Rest of South America LNG Regasification Terminals Industry Revenue (Million) Forecast, by Application 2019 & 2032
- Table 41: Global LNG Regasification Terminals Industry Revenue Million Forecast, by Country 2019 & 2032
- Table 42: United States LNG Regasification Terminals Industry Revenue (Million) Forecast, by Application 2019 & 2032
- Table 43: Canada LNG Regasification Terminals Industry Revenue (Million) Forecast, by Application 2019 & 2032
- Table 44: Mexico LNG Regasification Terminals Industry Revenue (Million) Forecast, by Application 2019 & 2032
- Table 45: Global LNG Regasification Terminals Industry Revenue Million Forecast, by Country 2019 & 2032
- Table 46: United Arab Emirates LNG Regasification Terminals Industry Revenue (Million) Forecast, by Application 2019 & 2032
- Table 47: Saudi Arabia LNG Regasification Terminals Industry Revenue (Million) Forecast, by Application 2019 & 2032
- Table 48: South Africa LNG Regasification Terminals Industry Revenue (Million) Forecast, by Application 2019 & 2032
- Table 49: Rest of Middle East and Africa LNG Regasification Terminals Industry Revenue (Million) Forecast, by Application 2019 & 2032
- Table 50: Global LNG Regasification Terminals Industry Revenue Million Forecast, by Terminal Type 2019 & 2032
- Table 51: Global LNG Regasification Terminals Industry Revenue Million Forecast, by Deployment 2019 & 2032
- Table 52: Global LNG Regasification Terminals Industry Revenue Million Forecast, by Country 2019 & 2032
- Table 53: Global LNG Regasification Terminals Industry Revenue Million Forecast, by Terminal Type 2019 & 2032
- Table 54: Global LNG Regasification Terminals Industry Revenue Million Forecast, by Deployment 2019 & 2032
- Table 55: Global LNG Regasification Terminals Industry Revenue Million Forecast, by Country 2019 & 2032
- Table 56: Global LNG Regasification Terminals Industry Revenue Million Forecast, by Terminal Type 2019 & 2032
- Table 57: Global LNG Regasification Terminals Industry Revenue Million Forecast, by Deployment 2019 & 2032
- Table 58: Global LNG Regasification Terminals Industry Revenue Million Forecast, by Country 2019 & 2032
- Table 59: Global LNG Regasification Terminals Industry Revenue Million Forecast, by Terminal Type 2019 & 2032
- Table 60: Global LNG Regasification Terminals Industry Revenue Million Forecast, by Deployment 2019 & 2032
- Table 61: Global LNG Regasification Terminals Industry Revenue Million Forecast, by Country 2019 & 2032
- Table 62: Global LNG Regasification Terminals Industry Revenue Million Forecast, by Terminal Type 2019 & 2032
- Table 63: Global LNG Regasification Terminals Industry Revenue Million Forecast, by Deployment 2019 & 2032
- Table 64: Global LNG Regasification Terminals Industry Revenue Million Forecast, by Country 2019 & 2032
Frequently Asked Questions
1. What is the projected Compound Annual Growth Rate (CAGR) of the LNG Regasification Terminals Industry?
The projected CAGR is approximately 5.60%.
2. Which companies are prominent players in the LNG Regasification Terminals Industry?
Key companies in the market include Shell PLC, Engie SA, Fluor Corpoartion*List Not Exhaustive, Weatherford International PLC, Wartsila Oyj ABP, Linde plc, Baker Hughes Company, Schlumberger Limited.
3. What are the main segments of the LNG Regasification Terminals Industry?
The market segments include Terminal Type, Deployment.
4. Can you provide details about the market size?
The market size is estimated to be USD XX Million as of 2022.
5. What are some drivers contributing to market growth?
4.; The Rise in Oil and Gas Drilling Activities4.; Increased Shale Gas Exploration.
6. What are the notable trends driving market growth?
The Floating Regasification Terminals Segment is Expected to Dominate the Market.
7. Are there any restraints impacting market growth?
4.; Increasing Share of Renewable Energy.
8. Can you provide examples of recent developments in the market?
In September 2021, South Africa's state-owned Central Energy Fund (CEF) and its partners, state-owned logistics firm Transnet and the Coega Development Corporation (CDC) joined together for establishing the country's first LNG import and distribution terminal at the Ngqura (Coega) deepwater port in the Eastern Cape. According to the joint committee, A floating storage and regasification unit (FSRU) has been identified as the preferred terminal configuration for LNG import and distribution
9. What pricing options are available for accessing the report?
Pricing options include single-user, multi-user, and enterprise licenses priced at USD 4750, USD 5250, and USD 8750 respectively.
10. Is the market size provided in terms of value or volume?
The market size is provided in terms of value, measured in Million.
11. Are there any specific market keywords associated with the report?
Yes, the market keyword associated with the report is "LNG Regasification Terminals Industry," which aids in identifying and referencing the specific market segment covered.
12. How do I determine which pricing option suits my needs best?
The pricing options vary based on user requirements and access needs. Individual users may opt for single-user licenses, while businesses requiring broader access may choose multi-user or enterprise licenses for cost-effective access to the report.
13. Are there any additional resources or data provided in the LNG Regasification Terminals Industry report?
While the report offers comprehensive insights, it's advisable to review the specific contents or supplementary materials provided to ascertain if additional resources or data are available.
14. How can I stay updated on further developments or reports in the LNG Regasification Terminals Industry?
To stay informed about further developments, trends, and reports in the LNG Regasification Terminals Industry, consider subscribing to industry newsletters, following relevant companies and organizations, or regularly checking reputable industry news sources and publications.
Methodology
Step 1 - Identification of Relevant Samples Size from Population Database


Step 2 - Approaches for Defining Global Market Size (Value, Volume* & Price*)

Note*: In applicable scenarios
Step 3 - Data Sources
Primary Research
- Web Analytics
- Survey Reports
- Research Institute
- Latest Research Reports
- Opinion Leaders
Secondary Research
- Annual Reports
- White Paper
- Latest Press Release
- Industry Association
- Paid Database
- Investor Presentations

Step 4 - Data Triangulation
Involves using different sources of information in order to increase the validity of a study
These sources are likely to be stakeholders in a program - participants, other researchers, program staff, other community members, and so on.
Then we put all data in single framework & apply various statistical tools to find out the dynamic on the market.
During the analysis stage, feedback from the stakeholder groups would be compared to determine areas of agreement as well as areas of divergence


