


Key Insights
The global machine vision camera market is poised for substantial expansion, driven by escalating industrial automation and the increasing adoption of advanced imaging solutions. The market, currently valued at $20378.6 million, is projected to grow at a Compound Annual Growth Rate (CAGR) of 13% from 2024 (base year) to 2033. Key growth drivers include the widespread integration of automation in sectors such as manufacturing (electronics, semiconductors, automotive), and healthcare, necessitating high-performance machine vision cameras. Continuous technological evolution in camera sensors, image processing, and artificial intelligence further expands application scope and efficiency. The imperative for enhanced quality control and process optimization across industries also significantly fuels market demand. The market is segmented by camera type and end-user industries, with electronics, semiconductors, automotive, and healthcare leading adoption.
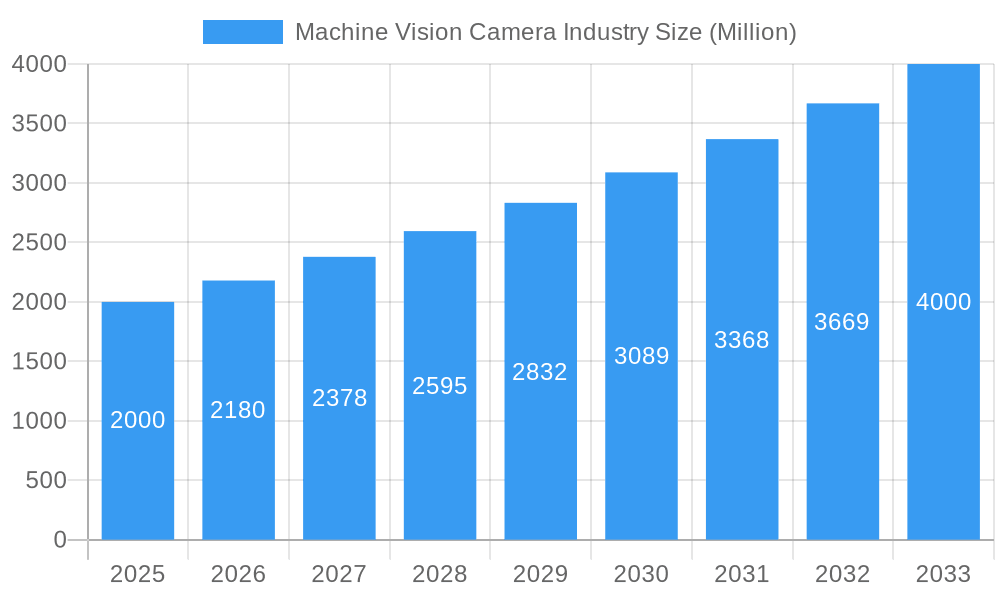
Machine Vision Camera Industry Market Size (In Billion)

While significant opportunities exist, high initial investment and integration complexities may pose challenges. However, innovations in cost-effective solutions and simplified integration are expected to address these concerns. The competitive environment features established leaders such as Keyence Corporation, Cognex Corporation, and Teledyne DALSA Inc., alongside agile emerging players, fostering continuous innovation. Robust regional growth is anticipated in North America, Europe, and Asia-Pacific, with the latter expected to be a primary growth engine due to rapid industrialization and technological advancements. The machine vision camera market demonstrates a strong positive trajectory, with considerable growth anticipated throughout the forecast period.
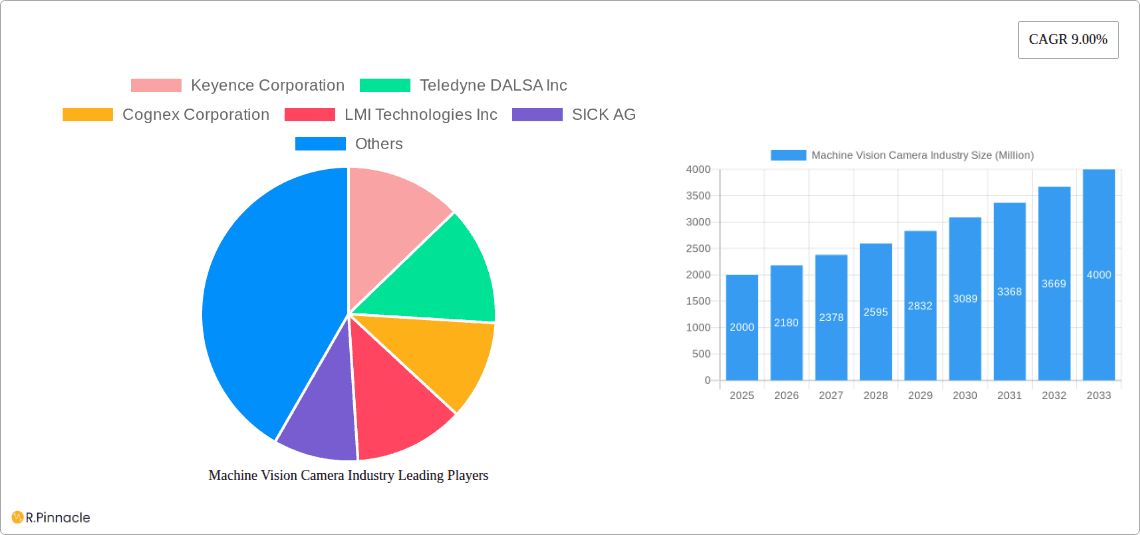
Machine Vision Camera Industry Company Market Share
Machine Vision Camera Industry Market Report: 2019-2033
This comprehensive report provides an in-depth analysis of the global Machine Vision Camera industry, offering invaluable insights for industry professionals, investors, and strategic decision-makers. Covering the period from 2019 to 2033, with a focus on 2025, this report unveils market dynamics, growth drivers, challenges, and future opportunities. The report leverages rigorous data analysis and expert insights to provide a clear picture of this rapidly evolving market, valued at xx Million in 2025 and projected to reach xx Million by 2033.
Machine Vision Camera Industry Market Structure & Innovation Trends
The Machine Vision Camera market is characterized by a moderately concentrated structure, with key players like Keyence Corporation, Teledyne DALSA Inc, and Cognex Corporation holding significant market share. The combined market share of the top 5 players is estimated at xx%. Innovation is driven by advancements in image sensor technology, artificial intelligence (AI) integration, and the increasing demand for high-resolution, high-speed imaging solutions. Regulatory frameworks, particularly those concerning data privacy and safety, are influencing product development and market access. Product substitutes, such as lidar and radar systems, pose a competitive challenge, although the superior image quality and versatility of machine vision cameras continue to drive market demand. End-user demographics show a strong presence across diverse sectors, with significant growth expected in electronics, automotive, and healthcare. The market has witnessed several mergers and acquisitions (M&A) in recent years, with deal values totaling xx Million in 2024, primarily focused on expanding product portfolios and geographic reach.
- Market Concentration: Top 5 players hold xx% market share.
- Innovation Drivers: AI integration, high-resolution sensors, high-speed imaging.
- M&A Activity: Total deal value in 2024 estimated at xx Million.
Machine Vision Camera Industry Market Dynamics & Trends
The global Machine Vision Camera market exhibits robust growth, driven by the increasing automation across diverse industries, the rising adoption of Industry 4.0 technologies, and the expanding applications in areas like quality control, robotics, and medical imaging. Technological advancements, such as the development of 3D vision systems and improved image processing algorithms, are significantly disrupting the market, leading to higher accuracy, speed, and efficiency. Consumer preferences are shifting towards solutions that offer greater ease of use, seamless integration, and enhanced data analytics capabilities. The competitive landscape is highly dynamic, with existing players focusing on innovation and strategic partnerships to maintain market leadership, while new entrants are leveraging niche technologies and specialized applications to gain a foothold. The market is projected to register a Compound Annual Growth Rate (CAGR) of xx% during the forecast period (2025-2033), with market penetration increasing significantly in emerging economies.
Dominant Regions & Segments in Machine Vision Camera Industry
The Asia-Pacific region dominates the Machine Vision Camera market, driven by robust economic growth, rapid industrialization, and a high concentration of manufacturing facilities in countries like China, Japan, and South Korea.
- Key Drivers for Asia-Pacific Dominance:
- Strong economic growth and industrialization.
- High concentration of manufacturing hubs.
- Increasing automation adoption.
- Favorable government policies supporting technological advancements.
Within the product type segment, Area Scan cameras hold the largest market share, owing to their versatility and suitability for a wide range of applications. The Electronics & Semiconductor industry is the leading end-user segment, driven by the need for high-precision inspection and quality control in manufacturing processes.
- Dominant Segment: Area Scan cameras by type, Electronics & Semiconductor by end-user industry.
Machine Vision Camera Industry Product Innovations
Recent product innovations in the Machine Vision Camera industry focus on improving image quality, increasing processing speed, and enhancing functionalities such as 3D vision and AI integration. These innovations are primarily driven by the need for enhanced precision, automation, and data analysis in various applications. New cameras boast higher resolution, improved low-light performance, and smaller form factors, allowing for easier integration into diverse systems. The market fit for these advancements is strong across industries seeking enhanced efficiency and quality control in their production processes.
Report Scope & Segmentation Analysis
This report segments the Machine Vision Camera market based on Type (Inline, Area Scan) and End-user Industries (Electronics & Semiconductor, Automotive, Healthcare, Food Processing, Aerospace, Other). Each segment's growth projections, market sizes, and competitive dynamics are detailed within the report. The Electronics & Semiconductor segment is projected to maintain its leading position throughout the forecast period. The Area Scan segment is expected to witness robust growth owing to its widespread applicability. Competitive dynamics within each segment vary, with some characterized by intense competition and others exhibiting more fragmented structures.
Key Drivers of Machine Vision Camera Industry Growth
Several factors contribute to the growth of the Machine Vision Camera industry. Technological advancements, such as the development of high-resolution sensors and AI-powered image processing, are driving market expansion. Economic factors, including the increasing adoption of automation across various industries, play a significant role. Favorable government policies and regulations promoting industrial automation also fuel market growth. Specific examples include government initiatives focused on smart manufacturing and Industry 4.0 adoption.
Challenges in the Machine Vision Camera Industry Sector
The Machine Vision Camera industry faces challenges such as the high initial investment costs associated with implementing machine vision systems and the complexity of integrating these systems into existing production lines. Supply chain disruptions and fluctuations in raw material prices can also impact profitability. Competitive pressures from both established players and new entrants pose a constant threat. These challenges, if not addressed effectively, could potentially hinder market growth. The overall impact of these challenges on market growth is estimated at xx%.
Emerging Opportunities in Machine Vision Camera Industry
Emerging opportunities exist in the Machine Vision Camera industry, particularly in new and developing markets. The growing demand for automated quality control in food processing and healthcare sectors presents substantial growth potential. Advancements in 3D vision and AI-based image processing open new avenues for applications in autonomous vehicles, robotics, and other advanced technologies. Consumer preference for personalized and customized products also boosts demand for advanced machine vision systems.
Leading Players in the Machine Vision Camera Industry Market
- Keyence Corporation
- Teledyne DALSA Inc
- Cognex Corporation
- LMI Technologies Inc
- SICK AG
- Allied Vision Technologies GmbH
- National Instruments Corporation
- Tordivel AS
- Adimec Advanced Image Systems bv
- Omron Microscan Systems Inc
- Basler AG
Key Developments in Machine Vision Camera Industry
- Jan 2023: Cognex Corporation launched a new high-resolution 3D vision system.
- May 2022: Keyence Corporation acquired a smaller competitor specializing in AI-powered image processing.
- Oct 2021: Teledyne DALSA Inc. released a new line of high-speed area scan cameras. (Further developments to be added in the full report)
Future Outlook for Machine Vision Camera Industry Market
The future outlook for the Machine Vision Camera market is highly promising, driven by the continued growth of automation across various industries and the accelerating adoption of advanced technologies such as AI and 3D vision. New applications in areas like autonomous vehicles and robotics are expected to fuel significant market expansion. Strategic partnerships and M&A activities will continue to shape the market landscape, driving innovation and enhancing product offerings. The market is poised for substantial growth, presenting lucrative opportunities for both established players and new entrants.
Machine Vision Camera Industry Segmentation
-
1. Type
- 1.1. Inline
- 1.2. Area Scan
-
2. End-user Industries
- 2.1. Electronics & Semiconductor
- 2.2. Automotive
- 2.3. Heathcare
- 2.4. Food Processing
- 2.5. Aerospace
- 2.6. Other End-user Industries
Machine Vision Camera Industry Segmentation By Geography
- 1. North America
- 2. Europe
- 3. Asia Pacific
- 4. Rest of the World
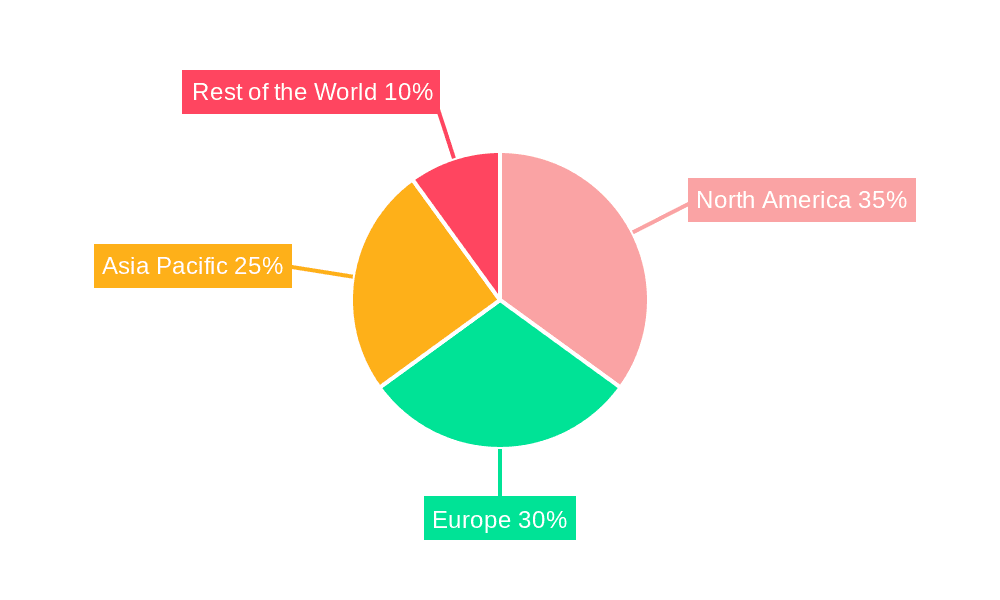
Machine Vision Camera Industry Regional Market Share
Geographic Coverage of Machine Vision Camera Industry
Machine Vision Camera Industry REPORT HIGHLIGHTS
| Aspects | Details |
|---|---|
| Study Period | 2020-2034 |
| Base Year | 2025 |
| Estimated Year | 2026 |
| Forecast Period | 2026-2034 |
| Historical Period | 2020-2025 |
| Growth Rate | CAGR of 13% from 2020-2034 |
| Segmentation |
|
Table of Contents
- 1. Introduction
- 1.1. Research Scope
- 1.2. Market Segmentation
- 1.3. Research Methodology
- 1.4. Definitions and Assumptions
- 2. Executive Summary
- 2.1. Introduction
- 3. Market Dynamics
- 3.1. Introduction
- 3.2. Market Drivers
- 3.2.1. ; Increasing Implementation of Advanced Technologies in Industries
- 3.3. Market Restrains
- 3.3.1. ; Lack of Skilled Labour and Inconsistency in the End-user Requirements/Demands
- 3.4. Market Trends
- 3.4.1. The Demand from Automotive Industry to Grow Significantly
- 4. Market Factor Analysis
- 4.1. Porters Five Forces
- 4.2. Supply/Value Chain
- 4.3. PESTEL analysis
- 4.4. Market Entropy
- 4.5. Patent/Trademark Analysis
- 5. Global Machine Vision Camera Industry Analysis, Insights and Forecast, 2020-2032
- 5.1. Market Analysis, Insights and Forecast - by Type
- 5.1.1. Inline
- 5.1.2. Area Scan
- 5.2. Market Analysis, Insights and Forecast - by End-user Industries
- 5.2.1. Electronics & Semiconductor
- 5.2.2. Automotive
- 5.2.3. Heathcare
- 5.2.4. Food Processing
- 5.2.5. Aerospace
- 5.2.6. Other End-user Industries
- 5.3. Market Analysis, Insights and Forecast - by Region
- 5.3.1. North America
- 5.3.2. Europe
- 5.3.3. Asia Pacific
- 5.3.4. Rest of the World
- 5.1. Market Analysis, Insights and Forecast - by Type
- 6. North America Machine Vision Camera Industry Analysis, Insights and Forecast, 2020-2032
- 6.1. Market Analysis, Insights and Forecast - by Type
- 6.1.1. Inline
- 6.1.2. Area Scan
- 6.2. Market Analysis, Insights and Forecast - by End-user Industries
- 6.2.1. Electronics & Semiconductor
- 6.2.2. Automotive
- 6.2.3. Heathcare
- 6.2.4. Food Processing
- 6.2.5. Aerospace
- 6.2.6. Other End-user Industries
- 6.1. Market Analysis, Insights and Forecast - by Type
- 7. Europe Machine Vision Camera Industry Analysis, Insights and Forecast, 2020-2032
- 7.1. Market Analysis, Insights and Forecast - by Type
- 7.1.1. Inline
- 7.1.2. Area Scan
- 7.2. Market Analysis, Insights and Forecast - by End-user Industries
- 7.2.1. Electronics & Semiconductor
- 7.2.2. Automotive
- 7.2.3. Heathcare
- 7.2.4. Food Processing
- 7.2.5. Aerospace
- 7.2.6. Other End-user Industries
- 7.1. Market Analysis, Insights and Forecast - by Type
- 8. Asia Pacific Machine Vision Camera Industry Analysis, Insights and Forecast, 2020-2032
- 8.1. Market Analysis, Insights and Forecast - by Type
- 8.1.1. Inline
- 8.1.2. Area Scan
- 8.2. Market Analysis, Insights and Forecast - by End-user Industries
- 8.2.1. Electronics & Semiconductor
- 8.2.2. Automotive
- 8.2.3. Heathcare
- 8.2.4. Food Processing
- 8.2.5. Aerospace
- 8.2.6. Other End-user Industries
- 8.1. Market Analysis, Insights and Forecast - by Type
- 9. Rest of the World Machine Vision Camera Industry Analysis, Insights and Forecast, 2020-2032
- 9.1. Market Analysis, Insights and Forecast - by Type
- 9.1.1. Inline
- 9.1.2. Area Scan
- 9.2. Market Analysis, Insights and Forecast - by End-user Industries
- 9.2.1. Electronics & Semiconductor
- 9.2.2. Automotive
- 9.2.3. Heathcare
- 9.2.4. Food Processing
- 9.2.5. Aerospace
- 9.2.6. Other End-user Industries
- 9.1. Market Analysis, Insights and Forecast - by Type
- 10. Competitive Analysis
- 10.1. Global Market Share Analysis 2025
- 10.2. Company Profiles
- 10.2.1 Keyence Corporation
- 10.2.1.1. Overview
- 10.2.1.2. Products
- 10.2.1.3. SWOT Analysis
- 10.2.1.4. Recent Developments
- 10.2.1.5. Financials (Based on Availability)
- 10.2.2 Teledyne DALSA Inc
- 10.2.2.1. Overview
- 10.2.2.2. Products
- 10.2.2.3. SWOT Analysis
- 10.2.2.4. Recent Developments
- 10.2.2.5. Financials (Based on Availability)
- 10.2.3 Cognex Corporation
- 10.2.3.1. Overview
- 10.2.3.2. Products
- 10.2.3.3. SWOT Analysis
- 10.2.3.4. Recent Developments
- 10.2.3.5. Financials (Based on Availability)
- 10.2.4 LMI Technologies Inc
- 10.2.4.1. Overview
- 10.2.4.2. Products
- 10.2.4.3. SWOT Analysis
- 10.2.4.4. Recent Developments
- 10.2.4.5. Financials (Based on Availability)
- 10.2.5 SICK AG
- 10.2.5.1. Overview
- 10.2.5.2. Products
- 10.2.5.3. SWOT Analysis
- 10.2.5.4. Recent Developments
- 10.2.5.5. Financials (Based on Availability)
- 10.2.6 Allied Vision Technologies GmbH
- 10.2.6.1. Overview
- 10.2.6.2. Products
- 10.2.6.3. SWOT Analysis
- 10.2.6.4. Recent Developments
- 10.2.6.5. Financials (Based on Availability)
- 10.2.7 National Instruments Corporation
- 10.2.7.1. Overview
- 10.2.7.2. Products
- 10.2.7.3. SWOT Analysis
- 10.2.7.4. Recent Developments
- 10.2.7.5. Financials (Based on Availability)
- 10.2.8 Tordivel AS
- 10.2.8.1. Overview
- 10.2.8.2. Products
- 10.2.8.3. SWOT Analysis
- 10.2.8.4. Recent Developments
- 10.2.8.5. Financials (Based on Availability)
- 10.2.9 Adimec Advanced Image Systems bv
- 10.2.9.1. Overview
- 10.2.9.2. Products
- 10.2.9.3. SWOT Analysis
- 10.2.9.4. Recent Developments
- 10.2.9.5. Financials (Based on Availability)
- 10.2.10 Omron Microscan Systems Inc
- 10.2.10.1. Overview
- 10.2.10.2. Products
- 10.2.10.3. SWOT Analysis
- 10.2.10.4. Recent Developments
- 10.2.10.5. Financials (Based on Availability)
- 10.2.11 Basler AG
- 10.2.11.1. Overview
- 10.2.11.2. Products
- 10.2.11.3. SWOT Analysis
- 10.2.11.4. Recent Developments
- 10.2.11.5. Financials (Based on Availability)
- 10.2.1 Keyence Corporation
List of Figures
- Figure 1: Global Machine Vision Camera Industry Revenue Breakdown (million, %) by Region 2025 & 2033
- Figure 2: Global Machine Vision Camera Industry Volume Breakdown (K Unit, %) by Region 2025 & 2033
- Figure 3: North America Machine Vision Camera Industry Revenue (million), by Type 2025 & 2033
- Figure 4: North America Machine Vision Camera Industry Volume (K Unit), by Type 2025 & 2033
- Figure 5: North America Machine Vision Camera Industry Revenue Share (%), by Type 2025 & 2033
- Figure 6: North America Machine Vision Camera Industry Volume Share (%), by Type 2025 & 2033
- Figure 7: North America Machine Vision Camera Industry Revenue (million), by End-user Industries 2025 & 2033
- Figure 8: North America Machine Vision Camera Industry Volume (K Unit), by End-user Industries 2025 & 2033
- Figure 9: North America Machine Vision Camera Industry Revenue Share (%), by End-user Industries 2025 & 2033
- Figure 10: North America Machine Vision Camera Industry Volume Share (%), by End-user Industries 2025 & 2033
- Figure 11: North America Machine Vision Camera Industry Revenue (million), by Country 2025 & 2033
- Figure 12: North America Machine Vision Camera Industry Volume (K Unit), by Country 2025 & 2033
- Figure 13: North America Machine Vision Camera Industry Revenue Share (%), by Country 2025 & 2033
- Figure 14: North America Machine Vision Camera Industry Volume Share (%), by Country 2025 & 2033
- Figure 15: Europe Machine Vision Camera Industry Revenue (million), by Type 2025 & 2033
- Figure 16: Europe Machine Vision Camera Industry Volume (K Unit), by Type 2025 & 2033
- Figure 17: Europe Machine Vision Camera Industry Revenue Share (%), by Type 2025 & 2033
- Figure 18: Europe Machine Vision Camera Industry Volume Share (%), by Type 2025 & 2033
- Figure 19: Europe Machine Vision Camera Industry Revenue (million), by End-user Industries 2025 & 2033
- Figure 20: Europe Machine Vision Camera Industry Volume (K Unit), by End-user Industries 2025 & 2033
- Figure 21: Europe Machine Vision Camera Industry Revenue Share (%), by End-user Industries 2025 & 2033
- Figure 22: Europe Machine Vision Camera Industry Volume Share (%), by End-user Industries 2025 & 2033
- Figure 23: Europe Machine Vision Camera Industry Revenue (million), by Country 2025 & 2033
- Figure 24: Europe Machine Vision Camera Industry Volume (K Unit), by Country 2025 & 2033
- Figure 25: Europe Machine Vision Camera Industry Revenue Share (%), by Country 2025 & 2033
- Figure 26: Europe Machine Vision Camera Industry Volume Share (%), by Country 2025 & 2033
- Figure 27: Asia Pacific Machine Vision Camera Industry Revenue (million), by Type 2025 & 2033
- Figure 28: Asia Pacific Machine Vision Camera Industry Volume (K Unit), by Type 2025 & 2033
- Figure 29: Asia Pacific Machine Vision Camera Industry Revenue Share (%), by Type 2025 & 2033
- Figure 30: Asia Pacific Machine Vision Camera Industry Volume Share (%), by Type 2025 & 2033
- Figure 31: Asia Pacific Machine Vision Camera Industry Revenue (million), by End-user Industries 2025 & 2033
- Figure 32: Asia Pacific Machine Vision Camera Industry Volume (K Unit), by End-user Industries 2025 & 2033
- Figure 33: Asia Pacific Machine Vision Camera Industry Revenue Share (%), by End-user Industries 2025 & 2033
- Figure 34: Asia Pacific Machine Vision Camera Industry Volume Share (%), by End-user Industries 2025 & 2033
- Figure 35: Asia Pacific Machine Vision Camera Industry Revenue (million), by Country 2025 & 2033
- Figure 36: Asia Pacific Machine Vision Camera Industry Volume (K Unit), by Country 2025 & 2033
- Figure 37: Asia Pacific Machine Vision Camera Industry Revenue Share (%), by Country 2025 & 2033
- Figure 38: Asia Pacific Machine Vision Camera Industry Volume Share (%), by Country 2025 & 2033
- Figure 39: Rest of the World Machine Vision Camera Industry Revenue (million), by Type 2025 & 2033
- Figure 40: Rest of the World Machine Vision Camera Industry Volume (K Unit), by Type 2025 & 2033
- Figure 41: Rest of the World Machine Vision Camera Industry Revenue Share (%), by Type 2025 & 2033
- Figure 42: Rest of the World Machine Vision Camera Industry Volume Share (%), by Type 2025 & 2033
- Figure 43: Rest of the World Machine Vision Camera Industry Revenue (million), by End-user Industries 2025 & 2033
- Figure 44: Rest of the World Machine Vision Camera Industry Volume (K Unit), by End-user Industries 2025 & 2033
- Figure 45: Rest of the World Machine Vision Camera Industry Revenue Share (%), by End-user Industries 2025 & 2033
- Figure 46: Rest of the World Machine Vision Camera Industry Volume Share (%), by End-user Industries 2025 & 2033
- Figure 47: Rest of the World Machine Vision Camera Industry Revenue (million), by Country 2025 & 2033
- Figure 48: Rest of the World Machine Vision Camera Industry Volume (K Unit), by Country 2025 & 2033
- Figure 49: Rest of the World Machine Vision Camera Industry Revenue Share (%), by Country 2025 & 2033
- Figure 50: Rest of the World Machine Vision Camera Industry Volume Share (%), by Country 2025 & 2033
List of Tables
- Table 1: Global Machine Vision Camera Industry Revenue million Forecast, by Type 2020 & 2033
- Table 2: Global Machine Vision Camera Industry Volume K Unit Forecast, by Type 2020 & 2033
- Table 3: Global Machine Vision Camera Industry Revenue million Forecast, by End-user Industries 2020 & 2033
- Table 4: Global Machine Vision Camera Industry Volume K Unit Forecast, by End-user Industries 2020 & 2033
- Table 5: Global Machine Vision Camera Industry Revenue million Forecast, by Region 2020 & 2033
- Table 6: Global Machine Vision Camera Industry Volume K Unit Forecast, by Region 2020 & 2033
- Table 7: Global Machine Vision Camera Industry Revenue million Forecast, by Type 2020 & 2033
- Table 8: Global Machine Vision Camera Industry Volume K Unit Forecast, by Type 2020 & 2033
- Table 9: Global Machine Vision Camera Industry Revenue million Forecast, by End-user Industries 2020 & 2033
- Table 10: Global Machine Vision Camera Industry Volume K Unit Forecast, by End-user Industries 2020 & 2033
- Table 11: Global Machine Vision Camera Industry Revenue million Forecast, by Country 2020 & 2033
- Table 12: Global Machine Vision Camera Industry Volume K Unit Forecast, by Country 2020 & 2033
- Table 13: Global Machine Vision Camera Industry Revenue million Forecast, by Type 2020 & 2033
- Table 14: Global Machine Vision Camera Industry Volume K Unit Forecast, by Type 2020 & 2033
- Table 15: Global Machine Vision Camera Industry Revenue million Forecast, by End-user Industries 2020 & 2033
- Table 16: Global Machine Vision Camera Industry Volume K Unit Forecast, by End-user Industries 2020 & 2033
- Table 17: Global Machine Vision Camera Industry Revenue million Forecast, by Country 2020 & 2033
- Table 18: Global Machine Vision Camera Industry Volume K Unit Forecast, by Country 2020 & 2033
- Table 19: Global Machine Vision Camera Industry Revenue million Forecast, by Type 2020 & 2033
- Table 20: Global Machine Vision Camera Industry Volume K Unit Forecast, by Type 2020 & 2033
- Table 21: Global Machine Vision Camera Industry Revenue million Forecast, by End-user Industries 2020 & 2033
- Table 22: Global Machine Vision Camera Industry Volume K Unit Forecast, by End-user Industries 2020 & 2033
- Table 23: Global Machine Vision Camera Industry Revenue million Forecast, by Country 2020 & 2033
- Table 24: Global Machine Vision Camera Industry Volume K Unit Forecast, by Country 2020 & 2033
- Table 25: Global Machine Vision Camera Industry Revenue million Forecast, by Type 2020 & 2033
- Table 26: Global Machine Vision Camera Industry Volume K Unit Forecast, by Type 2020 & 2033
- Table 27: Global Machine Vision Camera Industry Revenue million Forecast, by End-user Industries 2020 & 2033
- Table 28: Global Machine Vision Camera Industry Volume K Unit Forecast, by End-user Industries 2020 & 2033
- Table 29: Global Machine Vision Camera Industry Revenue million Forecast, by Country 2020 & 2033
- Table 30: Global Machine Vision Camera Industry Volume K Unit Forecast, by Country 2020 & 2033
Frequently Asked Questions
1. What is the projected Compound Annual Growth Rate (CAGR) of the Machine Vision Camera Industry?
The projected CAGR is approximately 13%.
2. Which companies are prominent players in the Machine Vision Camera Industry?
Key companies in the market include Keyence Corporation, Teledyne DALSA Inc, Cognex Corporation, LMI Technologies Inc, SICK AG, Allied Vision Technologies GmbH, National Instruments Corporation, Tordivel AS, Adimec Advanced Image Systems bv, Omron Microscan Systems Inc, Basler AG.
3. What are the main segments of the Machine Vision Camera Industry?
The market segments include Type, End-user Industries.
4. Can you provide details about the market size?
The market size is estimated to be USD 20378.6 million as of 2022.
5. What are some drivers contributing to market growth?
; Increasing Implementation of Advanced Technologies in Industries.
6. What are the notable trends driving market growth?
The Demand from Automotive Industry to Grow Significantly.
7. Are there any restraints impacting market growth?
; Lack of Skilled Labour and Inconsistency in the End-user Requirements/Demands.
8. Can you provide examples of recent developments in the market?
N/A
9. What pricing options are available for accessing the report?
Pricing options include single-user, multi-user, and enterprise licenses priced at USD 4750, USD 5250, and USD 8750 respectively.
10. Is the market size provided in terms of value or volume?
The market size is provided in terms of value, measured in million and volume, measured in K Unit.
11. Are there any specific market keywords associated with the report?
Yes, the market keyword associated with the report is "Machine Vision Camera Industry," which aids in identifying and referencing the specific market segment covered.
12. How do I determine which pricing option suits my needs best?
The pricing options vary based on user requirements and access needs. Individual users may opt for single-user licenses, while businesses requiring broader access may choose multi-user or enterprise licenses for cost-effective access to the report.
13. Are there any additional resources or data provided in the Machine Vision Camera Industry report?
While the report offers comprehensive insights, it's advisable to review the specific contents or supplementary materials provided to ascertain if additional resources or data are available.
14. How can I stay updated on further developments or reports in the Machine Vision Camera Industry?
To stay informed about further developments, trends, and reports in the Machine Vision Camera Industry, consider subscribing to industry newsletters, following relevant companies and organizations, or regularly checking reputable industry news sources and publications.
Methodology
Step 1 - Identification of Relevant Samples Size from Population Database


Step 2 - Approaches for Defining Global Market Size (Value, Volume* & Price*)

Note*: In applicable scenarios
Step 3 - Data Sources
Primary Research
- Web Analytics
- Survey Reports
- Research Institute
- Latest Research Reports
- Opinion Leaders
Secondary Research
- Annual Reports
- White Paper
- Latest Press Release
- Industry Association
- Paid Database
- Investor Presentations

Step 4 - Data Triangulation
Involves using different sources of information in order to increase the validity of a study
These sources are likely to be stakeholders in a program - participants, other researchers, program staff, other community members, and so on.
Then we put all data in single framework & apply various statistical tools to find out the dynamic on the market.
During the analysis stage, feedback from the stakeholder groups would be compared to determine areas of agreement as well as areas of divergence