


Key Insights
The global Marketing Activation Service market is poised for robust expansion, projecting a current market size of $8,500.75 million in 2024, with a Compound Annual Growth Rate (CAGR) of 7.8%. This growth trajectory is fueled by an increasing demand from both large enterprises and Small and Medium-sized Enterprises (SMEs) seeking to enhance brand visibility and customer engagement through strategic, experience-driven campaigns. The market is predominantly driven by the imperative for businesses to create memorable interactions that resonate with target audiences, moving beyond traditional advertising to foster deeper connections. Key growth drivers include the rise of experiential marketing, the need for personalized brand experiences, and the increasing integration of digital and physical activation strategies. The focus on driving sales conversions and building brand loyalty further propels market expansion, as companies recognize the tangible return on investment from well-executed activation campaigns.
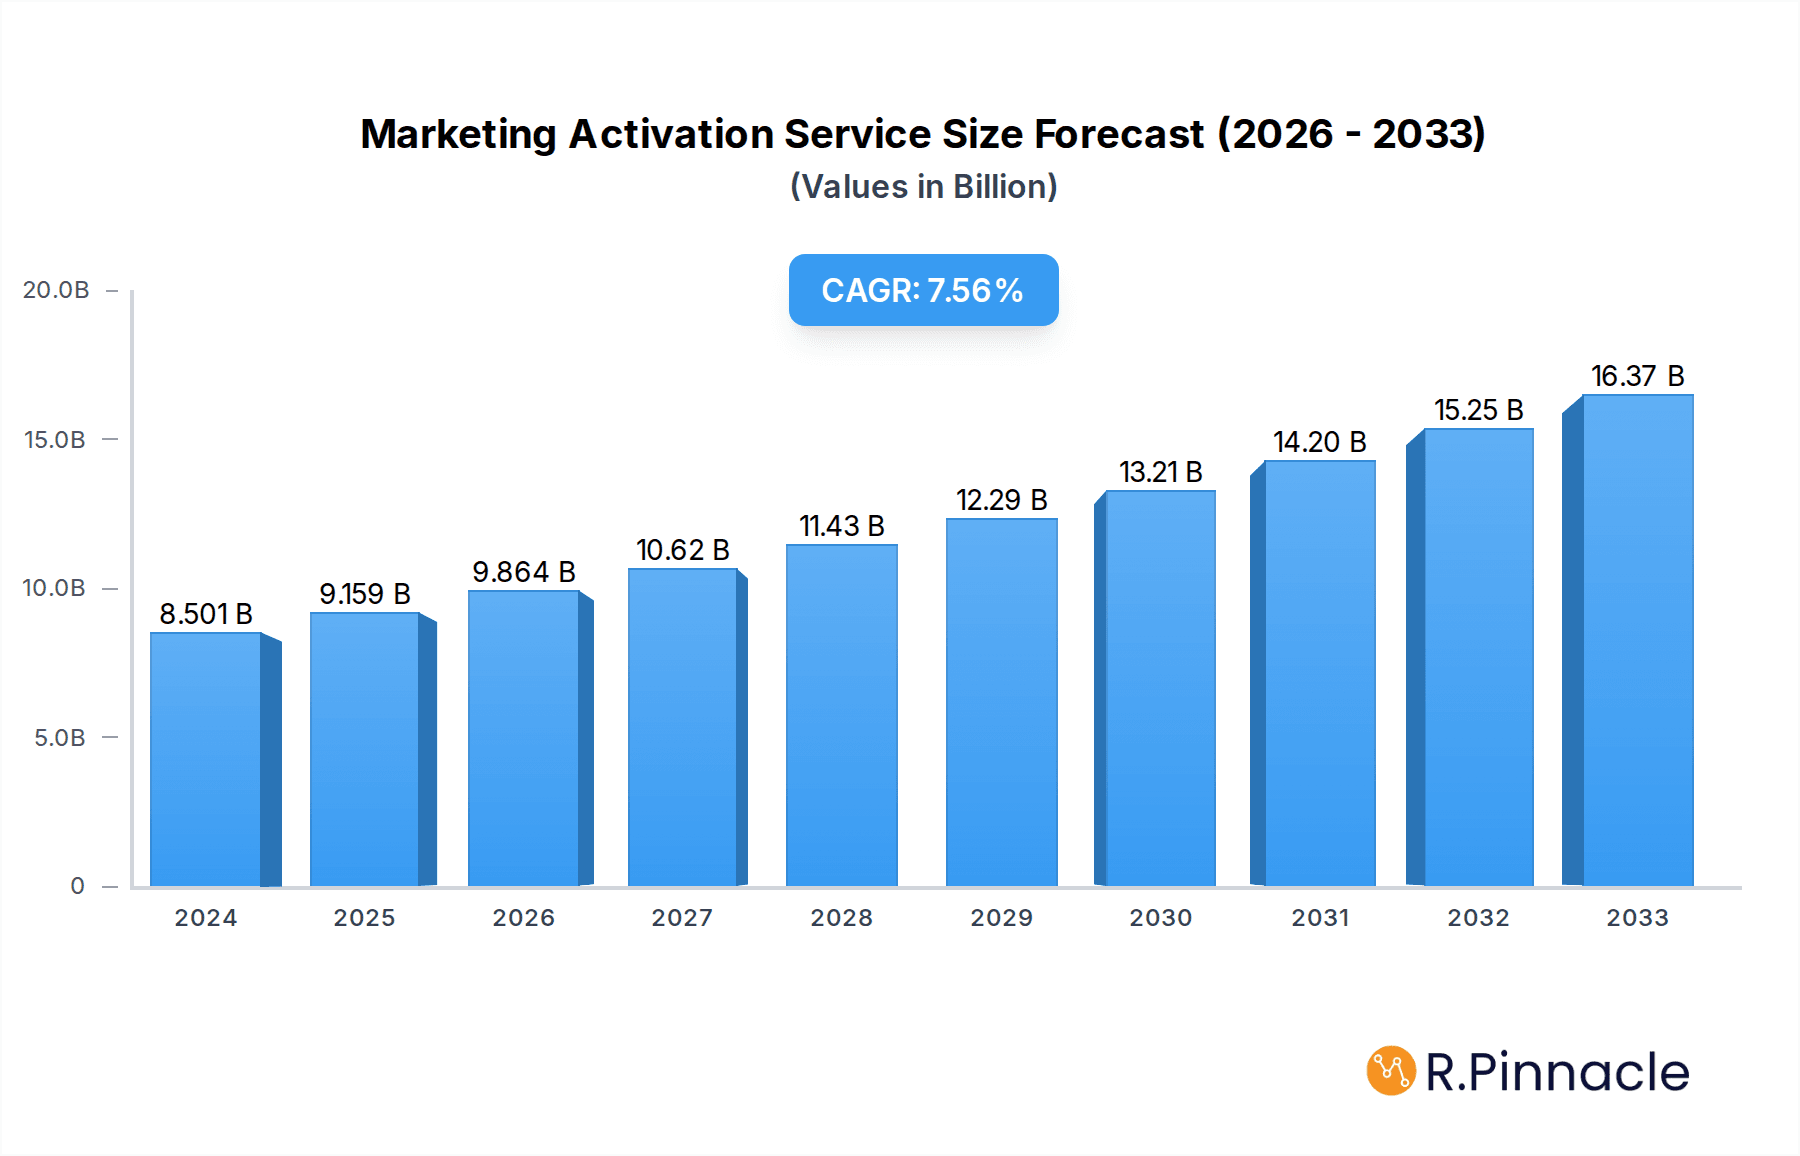
Marketing Activation Service Market Size (In Billion)

The Marketing Activation Service market is characterized by a diverse range of applications, from large-scale incentive programs and corporate meetings & conventions to impactful exhibitions and other innovative promotional activities. Leading companies like Pico, Uniplan, and Cheil are at the forefront, offering comprehensive solutions that encompass strategic planning, creative development, execution, and measurement. Emerging trends point towards hyper-personalization, leveraging data analytics to tailor activations to specific customer segments, and the adoption of augmented reality (AR) and virtual reality (VR) to create immersive brand experiences. While the market exhibits strong growth potential, challenges such as budget constraints for SMEs and the complexity of measuring ROI for certain activation types can act as moderating forces. However, the overarching trend of businesses prioritizing authentic customer engagement to differentiate themselves in a crowded marketplace ensures a positive outlook for the Marketing Activation Service sector.

Marketing Activation Service Company Market Share
Unlock Marketing Activation Excellence: Comprehensive Market Report 2024-2033
This in-depth report provides an exhaustive analysis of the global Marketing Activation Service market, offering critical insights for industry professionals and stakeholders. Spanning from 2019 to 2033, with a base year of 2025 and a forecast period extending to 2033, this research delves into market structure, dynamics, dominant segments, product innovations, and future outlook. With an estimated market size projected to reach over one million by the estimated year of 2025 and a robust CAGR, this report is your definitive guide to navigating the evolving landscape of marketing activation strategies. Discover actionable intelligence to drive growth, identify opportunities, and overcome challenges within this dynamic sector.
Marketing Activation Service Market Structure & Innovation Trends
The Marketing Activation Service market exhibits a moderately concentrated structure, with a few key players holding significant market share. Innovation is a primary driver, fueled by advancements in digital technologies, data analytics, and immersive experiences. Regulatory frameworks, while evolving, are largely supportive of market growth, focusing on consumer data protection and fair competition. Product substitutes exist, primarily in the form of in-house marketing teams and simpler advertising channels; however, specialized activation services offer unique value propositions. End-user demographics are diverse, ranging from large enterprises seeking comprehensive campaign execution to SMEs requiring targeted, cost-effective solutions. Mergers and acquisitions (M&A) activities are prevalent, with estimated M&A deal values in the hundreds of millions, indicating consolidation and strategic expansion within the industry. The market share of leading companies is projected to shift, with innovative players gaining traction.
Marketing Activation Service Market Dynamics & Trends
The Marketing Activation Service market is experiencing robust growth, driven by an escalating demand for experiential marketing, personalized customer journeys, and measurable campaign ROI. The Compound Annual Growth Rate (CAGR) is estimated to be approximately xx% during the forecast period. Technological disruptions, particularly the integration of AI, AR/VR, and IoT, are revolutionizing how brands connect with their audiences, enabling hyper-personalized activations and seamless omnichannel experiences. Consumer preferences are shifting towards authentic brand interactions, user-generated content, and socially responsible campaigns, forcing service providers to adapt their strategies. Competitive dynamics are intensifying, with a blend of established agencies and agile tech-forward startups vying for market dominance. Market penetration is expanding across various industries, as businesses recognize the critical role of effective marketing activation in achieving strategic objectives and building lasting customer loyalty. The overall market size is anticipated to surge beyond one million in revenue.
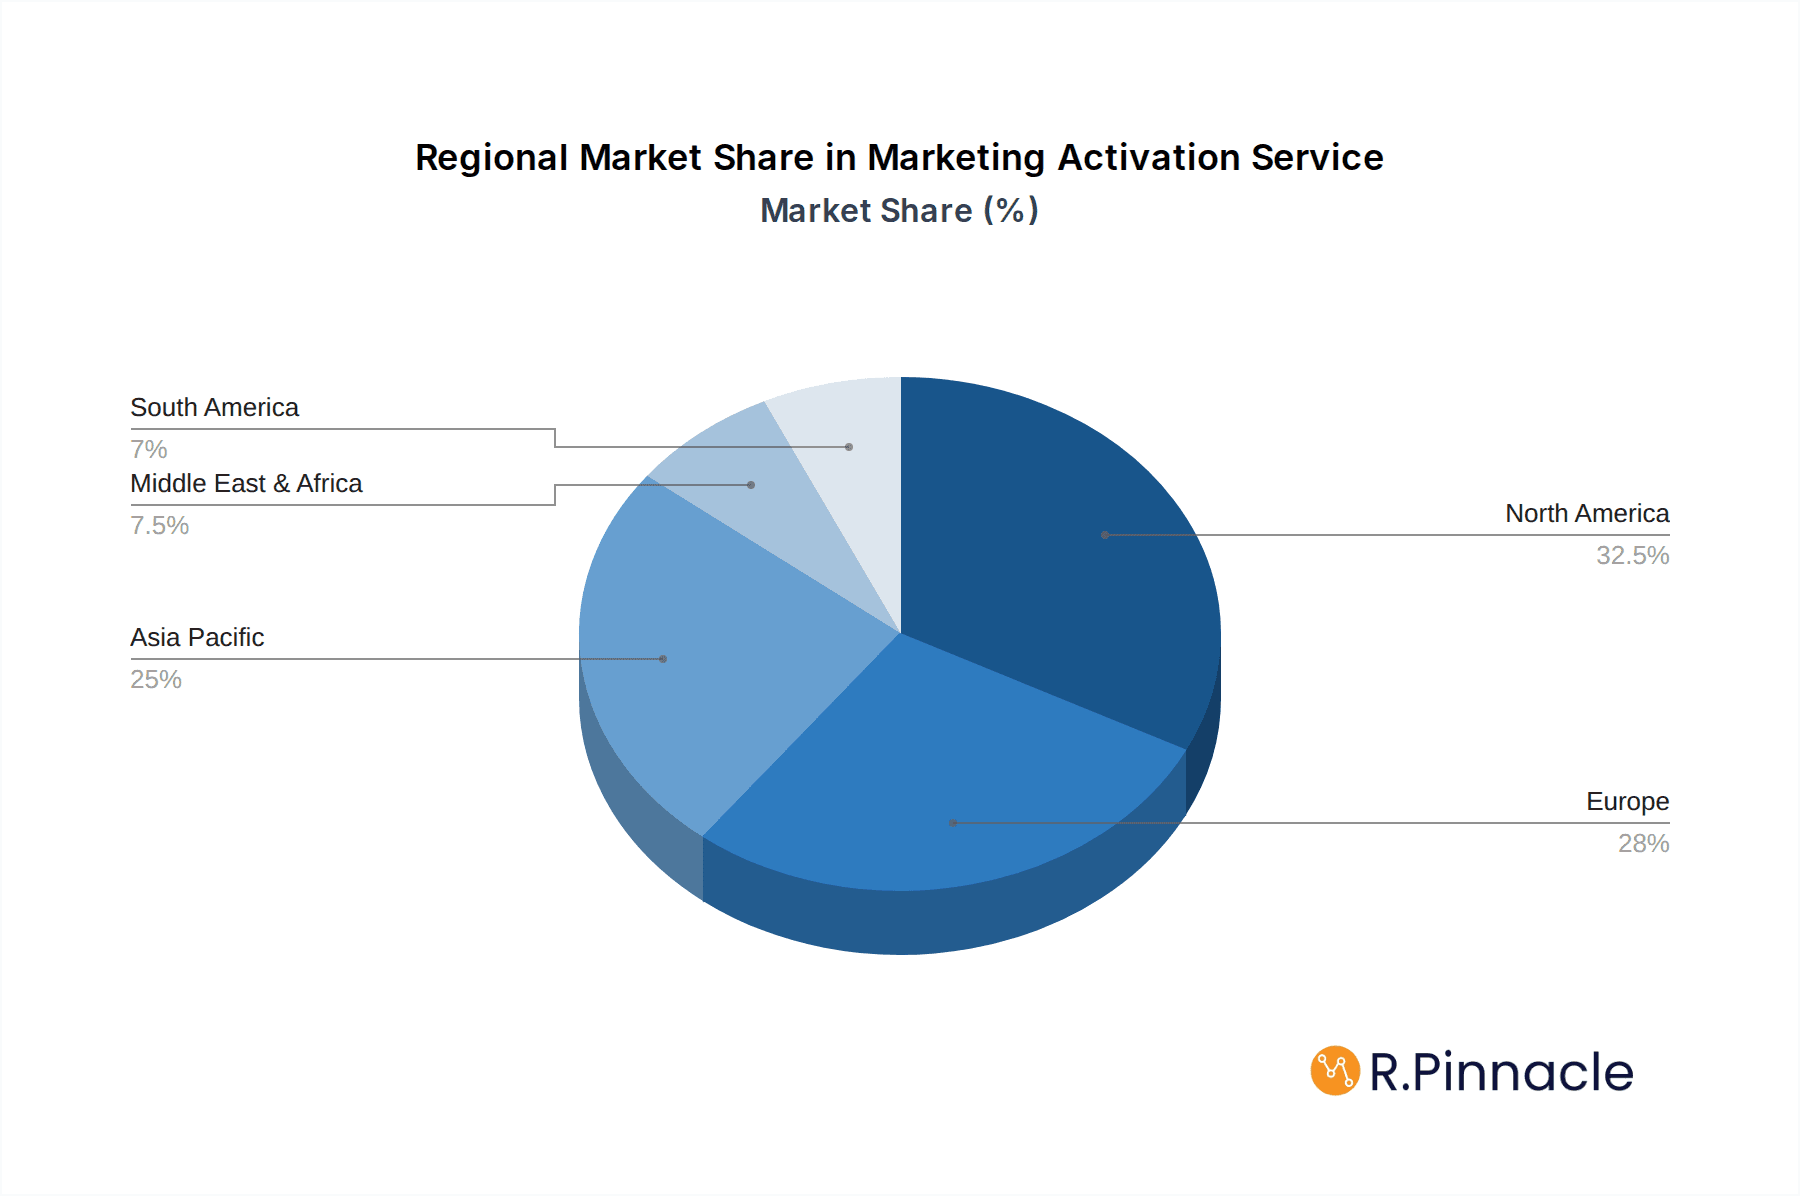
Dominant Regions & Segments in Marketing Activation Service
North America currently stands as the dominant region in the Marketing Activation Service market, driven by a mature economy, high adoption of digital technologies, and a strong presence of large enterprises. Within this region, the United States spearheads market penetration and innovation.
Application:
- Large Enterprises: This segment represents a significant portion of the market, leveraging activation services for complex, multi-channel campaigns, product launches, and brand building initiatives. Their substantial budgets and need for sophisticated execution fuel demand.
- Small and Medium-sized Enterprises (SMEs): This segment is a rapidly growing area, with SMEs increasingly recognizing the value of specialized activation services to compete effectively and reach niche audiences, often requiring more agile and cost-efficient solutions.
Types:
- Incentives: Programs designed to motivate sales teams, partners, and consumers are a key driver, with brands investing heavily in experiential rewards and recognition.
- Meetings & Conventions: The resurgence of in-person events, coupled with the integration of virtual and hybrid elements, positions this segment for substantial growth, demanding innovative activation strategies to enhance engagement.
- Exhibitions: Trade shows and exhibitions remain vital platforms for product showcasing and lead generation, requiring dynamic activation services to create impactful brand experiences and capture attendee attention.
- Others: This broad category encompasses a range of specialized activations, including influencer marketing, pop-up events, experiential retail, and digital campaign amplification, all contributing to market diversity.
Economic policies, robust infrastructure for digital connectivity, and a receptive consumer base contribute to the dominance of these segments and regions.
Marketing Activation Service Product Innovations
Product innovations in Marketing Activation Services are centered around enhancing personalization, measurability, and engagement. The integration of AI-powered analytics provides deeper audience insights, enabling hyper-targeted campaigns. AR/VR technologies are being leveraged to create immersive brand experiences, from virtual showrooms to interactive product demonstrations. Furthermore, advancements in data visualization tools empower clients with real-time performance tracking and ROI measurement. These innovations offer a significant competitive advantage by delivering more impactful and efficient marketing activations.
Report Scope & Segmentation Analysis
This report meticulously examines the Marketing Activation Service market across key segmentations. The Large Enterprises segment is expected to maintain its leading position due to higher spending power and the complexity of their activation needs, with projected market sizes in the hundreds of millions. Small and Medium-sized Enterprises (SMEs) represent a rapidly expanding segment, driven by the democratization of marketing tools and a growing need for competitive differentiation, with growth projections indicating significant upward trends.
In terms of Types, Incentives are a consistent growth area, fueled by performance-driven economies. Meetings & Conventions, including hybrid models, are poised for strong recovery and innovation, with market sizes in the tens of millions. Exhibitions continue to be a vital channel, with activation services enhancing attendee engagement and ROI. The Others category, encompassing diverse experiential and digital activations, showcases the market's adaptability and expansion into new frontiers.
Key Drivers of Marketing Activation Service Growth
The Marketing Activation Service market is propelled by several key drivers. Technologically, the pervasive adoption of digital platforms, AI, and data analytics allows for hyper-personalized and measurable campaign execution. Economically, an increasing emphasis on customer experience and brand loyalty is pushing companies to invest more in impactful activations. Regulatory factors, such as evolving data privacy laws, necessitate sophisticated and compliant activation strategies, creating a demand for expert services. The growing need for experiential marketing to cut through digital clutter and build genuine consumer connections is a significant accelerant.
Challenges in the Marketing Activation Service Sector
Despite its growth, the Marketing Activation Service sector faces several challenges. Regulatory hurdles, particularly concerning data privacy and consumer consent, can complicate campaign execution and increase compliance costs. Intense competitive pressures from established agencies, in-house teams, and technology disruptors can lead to pricing wars and margin erosion, impacting profitability. The ever-evolving digital landscape demands continuous investment in new technologies and talent, posing a significant financial strain. Furthermore, proving tangible ROI for experiential activations can sometimes be difficult, requiring sophisticated measurement tools and strategies.
Emerging Opportunities in Marketing Activation Service
Emerging opportunities in the Marketing Activation Service sector are abundant. The metaverse and Web3 technologies present a frontier for innovative, immersive brand activations, creating entirely new engagement paradigms. The growing demand for sustainable and ethical marketing practices opens avenues for eco-conscious activation strategies. Personalization at scale, powered by advanced AI and machine learning, offers the potential for hyper-relevant and impactful consumer experiences. Furthermore, the expansion into emerging economies with a burgeoning middle class and increasing digital penetration provides significant untapped market potential.
Leading Players in the Marketing Activation Service Market
Pico, Uniplan, Cheil, Eventive, Interbrand, Ruckus, Sagon Phior, CBA Design, KEXINO, Sid Lee, Brandimage, Brand Brothers, Radish Lab, adlicious, Tronvig Group, Startling Brands, Invasione Creativa, EWT, Boumaka.
Key Developments in Marketing Activation Service Industry
- 2024: Increased adoption of AI for hyper-personalization in event marketing.
- 2024: Rise of metaverse-specific brand activation strategies and virtual event platforms.
- 2023: Focus on data-driven ROI measurement for experiential marketing campaigns.
- 2023: Strategic partnerships between tech companies and activation agencies to leverage emerging technologies.
- 2022: Growing demand for sustainable and eco-friendly marketing activation solutions.
- 2021: Resurgence of in-person events with hybrid integration strategies.
- 2020: Accelerated digital transformation and shift towards online activations due to global events.
Future Outlook for Marketing Activation Service Market
The future outlook for the Marketing Activation Service market is exceptionally positive, driven by a persistent need for brands to forge deeper connections with consumers in an increasingly fragmented marketplace. Technological advancements will continue to be a significant growth accelerator, enabling more sophisticated personalization, immersive experiences, and robust analytics. The integration of AI, AR/VR, and the exploration of Web3 technologies will unlock new avenues for engagement. Strategic opportunities lie in developing specialized solutions for emerging markets and focusing on sustainable and socially responsible activation practices. The market is poised for continued expansion, with a projected increase in overall market value beyond one million in the coming years.
Marketing Activation Service Segmentation
-
1. Application
- 1.1. Large Enterprises
- 1.2. Small and Medium-sized Enterprises (SMEs)
-
2. Types
- 2.1. Incentives
- 2.2. Meetings & Conventions
- 2.3. Exhibitions
- 2.4. Others
Marketing Activation Service Segmentation By Geography
-
1. North America
- 1.1. United States
- 1.2. Canada
- 1.3. Mexico
-
2. South America
- 2.1. Brazil
- 2.2. Argentina
- 2.3. Rest of South America
-
3. Europe
- 3.1. United Kingdom
- 3.2. Germany
- 3.3. France
- 3.4. Italy
- 3.5. Spain
- 3.6. Russia
- 3.7. Benelux
- 3.8. Nordics
- 3.9. Rest of Europe
-
4. Middle East & Africa
- 4.1. Turkey
- 4.2. Israel
- 4.3. GCC
- 4.4. North Africa
- 4.5. South Africa
- 4.6. Rest of Middle East & Africa
-
5. Asia Pacific
- 5.1. China
- 5.2. India
- 5.3. Japan
- 5.4. South Korea
- 5.5. ASEAN
- 5.6. Oceania
- 5.7. Rest of Asia Pacific
Marketing Activation Service Regional Market Share
Geographic Coverage of Marketing Activation Service
Marketing Activation Service REPORT HIGHLIGHTS
| Aspects | Details |
|---|---|
| Study Period | 2020-2034 |
| Base Year | 2025 |
| Estimated Year | 2026 |
| Forecast Period | 2026-2034 |
| Historical Period | 2020-2025 |
| Growth Rate | CAGR of 7.8% from 2020-2034 |
| Segmentation |
|
Table of Contents
- 1. Introduction
- 1.1. Research Scope
- 1.2. Market Segmentation
- 1.3. Research Methodology
- 1.4. Definitions and Assumptions
- 2. Executive Summary
- 2.1. Introduction
- 3. Market Dynamics
- 3.1. Introduction
- 3.2. Market Drivers
- 3.3. Market Restrains
- 3.4. Market Trends
- 4. Market Factor Analysis
- 4.1. Porters Five Forces
- 4.2. Supply/Value Chain
- 4.3. PESTEL analysis
- 4.4. Market Entropy
- 4.5. Patent/Trademark Analysis
- 5. Global Marketing Activation Service Analysis, Insights and Forecast, 2020-2032
- 5.1. Market Analysis, Insights and Forecast - by Application
- 5.1.1. Large Enterprises
- 5.1.2. Small and Medium-sized Enterprises (SMEs)
- 5.2. Market Analysis, Insights and Forecast - by Types
- 5.2.1. Incentives
- 5.2.2. Meetings & Conventions
- 5.2.3. Exhibitions
- 5.2.4. Others
- 5.3. Market Analysis, Insights and Forecast - by Region
- 5.3.1. North America
- 5.3.2. South America
- 5.3.3. Europe
- 5.3.4. Middle East & Africa
- 5.3.5. Asia Pacific
- 5.1. Market Analysis, Insights and Forecast - by Application
- 6. North America Marketing Activation Service Analysis, Insights and Forecast, 2020-2032
- 6.1. Market Analysis, Insights and Forecast - by Application
- 6.1.1. Large Enterprises
- 6.1.2. Small and Medium-sized Enterprises (SMEs)
- 6.2. Market Analysis, Insights and Forecast - by Types
- 6.2.1. Incentives
- 6.2.2. Meetings & Conventions
- 6.2.3. Exhibitions
- 6.2.4. Others
- 6.1. Market Analysis, Insights and Forecast - by Application
- 7. South America Marketing Activation Service Analysis, Insights and Forecast, 2020-2032
- 7.1. Market Analysis, Insights and Forecast - by Application
- 7.1.1. Large Enterprises
- 7.1.2. Small and Medium-sized Enterprises (SMEs)
- 7.2. Market Analysis, Insights and Forecast - by Types
- 7.2.1. Incentives
- 7.2.2. Meetings & Conventions
- 7.2.3. Exhibitions
- 7.2.4. Others
- 7.1. Market Analysis, Insights and Forecast - by Application
- 8. Europe Marketing Activation Service Analysis, Insights and Forecast, 2020-2032
- 8.1. Market Analysis, Insights and Forecast - by Application
- 8.1.1. Large Enterprises
- 8.1.2. Small and Medium-sized Enterprises (SMEs)
- 8.2. Market Analysis, Insights and Forecast - by Types
- 8.2.1. Incentives
- 8.2.2. Meetings & Conventions
- 8.2.3. Exhibitions
- 8.2.4. Others
- 8.1. Market Analysis, Insights and Forecast - by Application
- 9. Middle East & Africa Marketing Activation Service Analysis, Insights and Forecast, 2020-2032
- 9.1. Market Analysis, Insights and Forecast - by Application
- 9.1.1. Large Enterprises
- 9.1.2. Small and Medium-sized Enterprises (SMEs)
- 9.2. Market Analysis, Insights and Forecast - by Types
- 9.2.1. Incentives
- 9.2.2. Meetings & Conventions
- 9.2.3. Exhibitions
- 9.2.4. Others
- 9.1. Market Analysis, Insights and Forecast - by Application
- 10. Asia Pacific Marketing Activation Service Analysis, Insights and Forecast, 2020-2032
- 10.1. Market Analysis, Insights and Forecast - by Application
- 10.1.1. Large Enterprises
- 10.1.2. Small and Medium-sized Enterprises (SMEs)
- 10.2. Market Analysis, Insights and Forecast - by Types
- 10.2.1. Incentives
- 10.2.2. Meetings & Conventions
- 10.2.3. Exhibitions
- 10.2.4. Others
- 10.1. Market Analysis, Insights and Forecast - by Application
- 11. Competitive Analysis
- 11.1. Global Market Share Analysis 2025
- 11.2. Company Profiles
- 11.2.1 Pico
- 11.2.1.1. Overview
- 11.2.1.2. Products
- 11.2.1.3. SWOT Analysis
- 11.2.1.4. Recent Developments
- 11.2.1.5. Financials (Based on Availability)
- 11.2.2 Uniplan
- 11.2.2.1. Overview
- 11.2.2.2. Products
- 11.2.2.3. SWOT Analysis
- 11.2.2.4. Recent Developments
- 11.2.2.5. Financials (Based on Availability)
- 11.2.3 Cheil
- 11.2.3.1. Overview
- 11.2.3.2. Products
- 11.2.3.3. SWOT Analysis
- 11.2.3.4. Recent Developments
- 11.2.3.5. Financials (Based on Availability)
- 11.2.4 Eventive
- 11.2.4.1. Overview
- 11.2.4.2. Products
- 11.2.4.3. SWOT Analysis
- 11.2.4.4. Recent Developments
- 11.2.4.5. Financials (Based on Availability)
- 11.2.5 Interbrand
- 11.2.5.1. Overview
- 11.2.5.2. Products
- 11.2.5.3. SWOT Analysis
- 11.2.5.4. Recent Developments
- 11.2.5.5. Financials (Based on Availability)
- 11.2.6 Ruckus
- 11.2.6.1. Overview
- 11.2.6.2. Products
- 11.2.6.3. SWOT Analysis
- 11.2.6.4. Recent Developments
- 11.2.6.5. Financials (Based on Availability)
- 11.2.7 Sagon Phior
- 11.2.7.1. Overview
- 11.2.7.2. Products
- 11.2.7.3. SWOT Analysis
- 11.2.7.4. Recent Developments
- 11.2.7.5. Financials (Based on Availability)
- 11.2.8 CBA Design
- 11.2.8.1. Overview
- 11.2.8.2. Products
- 11.2.8.3. SWOT Analysis
- 11.2.8.4. Recent Developments
- 11.2.8.5. Financials (Based on Availability)
- 11.2.9 KEXINO
- 11.2.9.1. Overview
- 11.2.9.2. Products
- 11.2.9.3. SWOT Analysis
- 11.2.9.4. Recent Developments
- 11.2.9.5. Financials (Based on Availability)
- 11.2.10 Sid Lee
- 11.2.10.1. Overview
- 11.2.10.2. Products
- 11.2.10.3. SWOT Analysis
- 11.2.10.4. Recent Developments
- 11.2.10.5. Financials (Based on Availability)
- 11.2.11 Brandimage
- 11.2.11.1. Overview
- 11.2.11.2. Products
- 11.2.11.3. SWOT Analysis
- 11.2.11.4. Recent Developments
- 11.2.11.5. Financials (Based on Availability)
- 11.2.12 Brand Brothers
- 11.2.12.1. Overview
- 11.2.12.2. Products
- 11.2.12.3. SWOT Analysis
- 11.2.12.4. Recent Developments
- 11.2.12.5. Financials (Based on Availability)
- 11.2.13 Radish Lab
- 11.2.13.1. Overview
- 11.2.13.2. Products
- 11.2.13.3. SWOT Analysis
- 11.2.13.4. Recent Developments
- 11.2.13.5. Financials (Based on Availability)
- 11.2.14 adlicious
- 11.2.14.1. Overview
- 11.2.14.2. Products
- 11.2.14.3. SWOT Analysis
- 11.2.14.4. Recent Developments
- 11.2.14.5. Financials (Based on Availability)
- 11.2.15 Tronvig Group
- 11.2.15.1. Overview
- 11.2.15.2. Products
- 11.2.15.3. SWOT Analysis
- 11.2.15.4. Recent Developments
- 11.2.15.5. Financials (Based on Availability)
- 11.2.16 Startling Brands
- 11.2.16.1. Overview
- 11.2.16.2. Products
- 11.2.16.3. SWOT Analysis
- 11.2.16.4. Recent Developments
- 11.2.16.5. Financials (Based on Availability)
- 11.2.17 Invasione Creativa
- 11.2.17.1. Overview
- 11.2.17.2. Products
- 11.2.17.3. SWOT Analysis
- 11.2.17.4. Recent Developments
- 11.2.17.5. Financials (Based on Availability)
- 11.2.18 EWT
- 11.2.18.1. Overview
- 11.2.18.2. Products
- 11.2.18.3. SWOT Analysis
- 11.2.18.4. Recent Developments
- 11.2.18.5. Financials (Based on Availability)
- 11.2.19 Boumaka
- 11.2.19.1. Overview
- 11.2.19.2. Products
- 11.2.19.3. SWOT Analysis
- 11.2.19.4. Recent Developments
- 11.2.19.5. Financials (Based on Availability)
- 11.2.1 Pico
List of Figures
- Figure 1: Global Marketing Activation Service Revenue Breakdown (undefined, %) by Region 2025 & 2033
- Figure 2: North America Marketing Activation Service Revenue (undefined), by Application 2025 & 2033
- Figure 3: North America Marketing Activation Service Revenue Share (%), by Application 2025 & 2033
- Figure 4: North America Marketing Activation Service Revenue (undefined), by Types 2025 & 2033
- Figure 5: North America Marketing Activation Service Revenue Share (%), by Types 2025 & 2033
- Figure 6: North America Marketing Activation Service Revenue (undefined), by Country 2025 & 2033
- Figure 7: North America Marketing Activation Service Revenue Share (%), by Country 2025 & 2033
- Figure 8: South America Marketing Activation Service Revenue (undefined), by Application 2025 & 2033
- Figure 9: South America Marketing Activation Service Revenue Share (%), by Application 2025 & 2033
- Figure 10: South America Marketing Activation Service Revenue (undefined), by Types 2025 & 2033
- Figure 11: South America Marketing Activation Service Revenue Share (%), by Types 2025 & 2033
- Figure 12: South America Marketing Activation Service Revenue (undefined), by Country 2025 & 2033
- Figure 13: South America Marketing Activation Service Revenue Share (%), by Country 2025 & 2033
- Figure 14: Europe Marketing Activation Service Revenue (undefined), by Application 2025 & 2033
- Figure 15: Europe Marketing Activation Service Revenue Share (%), by Application 2025 & 2033
- Figure 16: Europe Marketing Activation Service Revenue (undefined), by Types 2025 & 2033
- Figure 17: Europe Marketing Activation Service Revenue Share (%), by Types 2025 & 2033
- Figure 18: Europe Marketing Activation Service Revenue (undefined), by Country 2025 & 2033
- Figure 19: Europe Marketing Activation Service Revenue Share (%), by Country 2025 & 2033
- Figure 20: Middle East & Africa Marketing Activation Service Revenue (undefined), by Application 2025 & 2033
- Figure 21: Middle East & Africa Marketing Activation Service Revenue Share (%), by Application 2025 & 2033
- Figure 22: Middle East & Africa Marketing Activation Service Revenue (undefined), by Types 2025 & 2033
- Figure 23: Middle East & Africa Marketing Activation Service Revenue Share (%), by Types 2025 & 2033
- Figure 24: Middle East & Africa Marketing Activation Service Revenue (undefined), by Country 2025 & 2033
- Figure 25: Middle East & Africa Marketing Activation Service Revenue Share (%), by Country 2025 & 2033
- Figure 26: Asia Pacific Marketing Activation Service Revenue (undefined), by Application 2025 & 2033
- Figure 27: Asia Pacific Marketing Activation Service Revenue Share (%), by Application 2025 & 2033
- Figure 28: Asia Pacific Marketing Activation Service Revenue (undefined), by Types 2025 & 2033
- Figure 29: Asia Pacific Marketing Activation Service Revenue Share (%), by Types 2025 & 2033
- Figure 30: Asia Pacific Marketing Activation Service Revenue (undefined), by Country 2025 & 2033
- Figure 31: Asia Pacific Marketing Activation Service Revenue Share (%), by Country 2025 & 2033
List of Tables
- Table 1: Global Marketing Activation Service Revenue undefined Forecast, by Application 2020 & 2033
- Table 2: Global Marketing Activation Service Revenue undefined Forecast, by Types 2020 & 2033
- Table 3: Global Marketing Activation Service Revenue undefined Forecast, by Region 2020 & 2033
- Table 4: Global Marketing Activation Service Revenue undefined Forecast, by Application 2020 & 2033
- Table 5: Global Marketing Activation Service Revenue undefined Forecast, by Types 2020 & 2033
- Table 6: Global Marketing Activation Service Revenue undefined Forecast, by Country 2020 & 2033
- Table 7: United States Marketing Activation Service Revenue (undefined) Forecast, by Application 2020 & 2033
- Table 8: Canada Marketing Activation Service Revenue (undefined) Forecast, by Application 2020 & 2033
- Table 9: Mexico Marketing Activation Service Revenue (undefined) Forecast, by Application 2020 & 2033
- Table 10: Global Marketing Activation Service Revenue undefined Forecast, by Application 2020 & 2033
- Table 11: Global Marketing Activation Service Revenue undefined Forecast, by Types 2020 & 2033
- Table 12: Global Marketing Activation Service Revenue undefined Forecast, by Country 2020 & 2033
- Table 13: Brazil Marketing Activation Service Revenue (undefined) Forecast, by Application 2020 & 2033
- Table 14: Argentina Marketing Activation Service Revenue (undefined) Forecast, by Application 2020 & 2033
- Table 15: Rest of South America Marketing Activation Service Revenue (undefined) Forecast, by Application 2020 & 2033
- Table 16: Global Marketing Activation Service Revenue undefined Forecast, by Application 2020 & 2033
- Table 17: Global Marketing Activation Service Revenue undefined Forecast, by Types 2020 & 2033
- Table 18: Global Marketing Activation Service Revenue undefined Forecast, by Country 2020 & 2033
- Table 19: United Kingdom Marketing Activation Service Revenue (undefined) Forecast, by Application 2020 & 2033
- Table 20: Germany Marketing Activation Service Revenue (undefined) Forecast, by Application 2020 & 2033
- Table 21: France Marketing Activation Service Revenue (undefined) Forecast, by Application 2020 & 2033
- Table 22: Italy Marketing Activation Service Revenue (undefined) Forecast, by Application 2020 & 2033
- Table 23: Spain Marketing Activation Service Revenue (undefined) Forecast, by Application 2020 & 2033
- Table 24: Russia Marketing Activation Service Revenue (undefined) Forecast, by Application 2020 & 2033
- Table 25: Benelux Marketing Activation Service Revenue (undefined) Forecast, by Application 2020 & 2033
- Table 26: Nordics Marketing Activation Service Revenue (undefined) Forecast, by Application 2020 & 2033
- Table 27: Rest of Europe Marketing Activation Service Revenue (undefined) Forecast, by Application 2020 & 2033
- Table 28: Global Marketing Activation Service Revenue undefined Forecast, by Application 2020 & 2033
- Table 29: Global Marketing Activation Service Revenue undefined Forecast, by Types 2020 & 2033
- Table 30: Global Marketing Activation Service Revenue undefined Forecast, by Country 2020 & 2033
- Table 31: Turkey Marketing Activation Service Revenue (undefined) Forecast, by Application 2020 & 2033
- Table 32: Israel Marketing Activation Service Revenue (undefined) Forecast, by Application 2020 & 2033
- Table 33: GCC Marketing Activation Service Revenue (undefined) Forecast, by Application 2020 & 2033
- Table 34: North Africa Marketing Activation Service Revenue (undefined) Forecast, by Application 2020 & 2033
- Table 35: South Africa Marketing Activation Service Revenue (undefined) Forecast, by Application 2020 & 2033
- Table 36: Rest of Middle East & Africa Marketing Activation Service Revenue (undefined) Forecast, by Application 2020 & 2033
- Table 37: Global Marketing Activation Service Revenue undefined Forecast, by Application 2020 & 2033
- Table 38: Global Marketing Activation Service Revenue undefined Forecast, by Types 2020 & 2033
- Table 39: Global Marketing Activation Service Revenue undefined Forecast, by Country 2020 & 2033
- Table 40: China Marketing Activation Service Revenue (undefined) Forecast, by Application 2020 & 2033
- Table 41: India Marketing Activation Service Revenue (undefined) Forecast, by Application 2020 & 2033
- Table 42: Japan Marketing Activation Service Revenue (undefined) Forecast, by Application 2020 & 2033
- Table 43: South Korea Marketing Activation Service Revenue (undefined) Forecast, by Application 2020 & 2033
- Table 44: ASEAN Marketing Activation Service Revenue (undefined) Forecast, by Application 2020 & 2033
- Table 45: Oceania Marketing Activation Service Revenue (undefined) Forecast, by Application 2020 & 2033
- Table 46: Rest of Asia Pacific Marketing Activation Service Revenue (undefined) Forecast, by Application 2020 & 2033
Frequently Asked Questions
1. What is the projected Compound Annual Growth Rate (CAGR) of the Marketing Activation Service?
The projected CAGR is approximately 7.8%.
2. Which companies are prominent players in the Marketing Activation Service?
Key companies in the market include Pico, Uniplan, Cheil, Eventive, Interbrand, Ruckus, Sagon Phior, CBA Design, KEXINO, Sid Lee, Brandimage, Brand Brothers, Radish Lab, adlicious, Tronvig Group, Startling Brands, Invasione Creativa, EWT, Boumaka.
3. What are the main segments of the Marketing Activation Service?
The market segments include Application, Types.
4. Can you provide details about the market size?
The market size is estimated to be USD XXX N/A as of 2022.
5. What are some drivers contributing to market growth?
N/A
6. What are the notable trends driving market growth?
N/A
7. Are there any restraints impacting market growth?
N/A
8. Can you provide examples of recent developments in the market?
N/A
9. What pricing options are available for accessing the report?
Pricing options include single-user, multi-user, and enterprise licenses priced at USD 2900.00, USD 4350.00, and USD 5800.00 respectively.
10. Is the market size provided in terms of value or volume?
The market size is provided in terms of value, measured in N/A.
11. Are there any specific market keywords associated with the report?
Yes, the market keyword associated with the report is "Marketing Activation Service," which aids in identifying and referencing the specific market segment covered.
12. How do I determine which pricing option suits my needs best?
The pricing options vary based on user requirements and access needs. Individual users may opt for single-user licenses, while businesses requiring broader access may choose multi-user or enterprise licenses for cost-effective access to the report.
13. Are there any additional resources or data provided in the Marketing Activation Service report?
While the report offers comprehensive insights, it's advisable to review the specific contents or supplementary materials provided to ascertain if additional resources or data are available.
14. How can I stay updated on further developments or reports in the Marketing Activation Service?
To stay informed about further developments, trends, and reports in the Marketing Activation Service, consider subscribing to industry newsletters, following relevant companies and organizations, or regularly checking reputable industry news sources and publications.
Methodology
Step 1 - Identification of Relevant Samples Size from Population Database


Step 2 - Approaches for Defining Global Market Size (Value, Volume* & Price*)

Note*: In applicable scenarios
Step 3 - Data Sources
Primary Research
- Web Analytics
- Survey Reports
- Research Institute
- Latest Research Reports
- Opinion Leaders
Secondary Research
- Annual Reports
- White Paper
- Latest Press Release
- Industry Association
- Paid Database
- Investor Presentations

Step 4 - Data Triangulation
Involves using different sources of information in order to increase the validity of a study
These sources are likely to be stakeholders in a program - participants, other researchers, program staff, other community members, and so on.
Then we put all data in single framework & apply various statistical tools to find out the dynamic on the market.
During the analysis stage, feedback from the stakeholder groups would be compared to determine areas of agreement as well as areas of divergence