Unlocking Growth in Microgreens Market Market 2025-2033

Microgreens Market by Production Analysis, by Consumption Analysis, by Import Market Analysis (Value & Volume), by Export Market Analysis (Value & Volume), by Price Trend Analysis, by North America (United States, Canada, Mexico), by South America (Brazil, Argentina, Rest of South America), by Europe (United Kingdom, Germany, France, Italy, Spain, Russia, Benelux, Nordics, Rest of Europe), by Middle East & Africa (Turkey, Israel, GCC, North Africa, South Africa, Rest of Middle East & Africa), by Asia Pacific (China, India, Japan, South Korea, ASEAN, Oceania, Rest of Asia Pacific) Forecast 2025-2033

Jun 27 2025
Base Year: 2024

234 Pages
Main Logo

Unlocking Growth in Microgreens Market Market 2025-2033


Home
Industries
Agriculture
sponsor image

Tailored for you

  • In-depth Analysis Tailored to Specified Regions or Segments
  • Company Profiles Customized to User Preferences
  • Comprehensive Insights Focused on Specific Segments or Regions
  • Customized Evaluation of Competitive Landscape to Meet Your Needs
  • Tailored Customization to Address Other Specific Requirements
Ask for customization


Key Insights

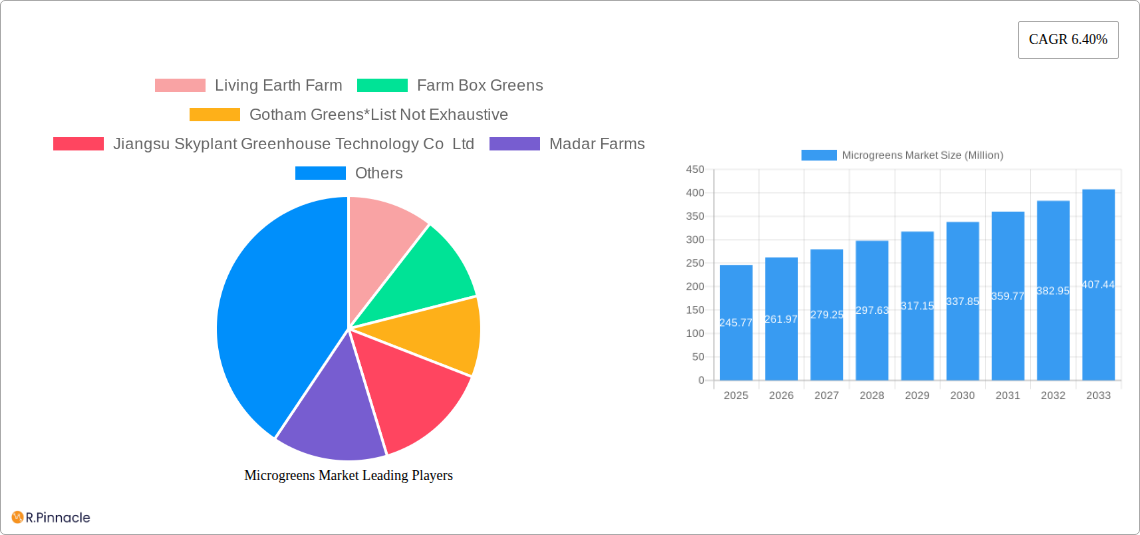
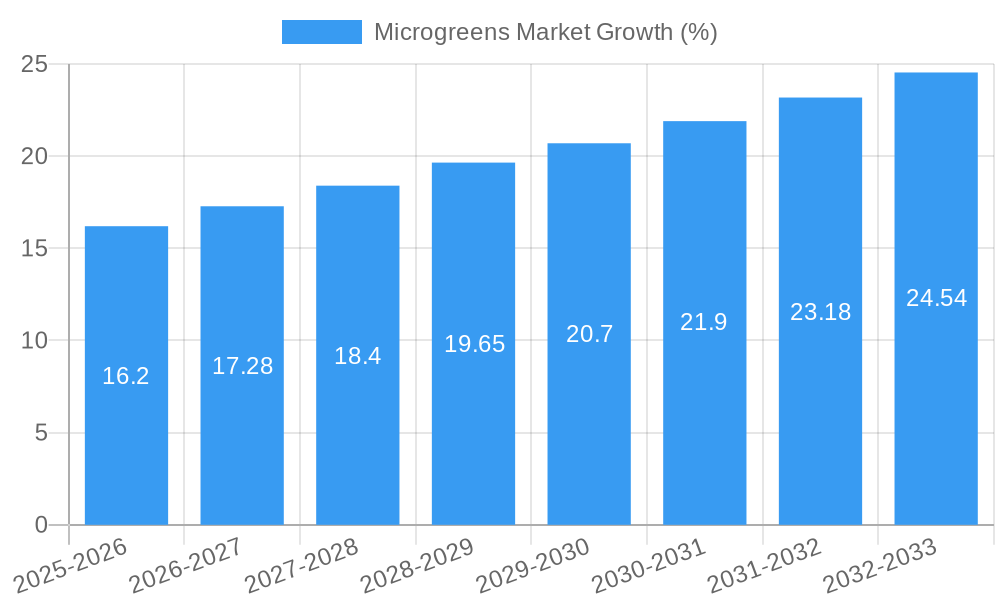
The global microgreens market, valued at $245.77 million in 2025, is poised for robust growth, exhibiting a Compound Annual Growth Rate (CAGR) of 6.40% from 2025 to 2033. This expansion is driven by several key factors. The rising consumer preference for nutritious and healthy foods fuels demand for microgreens, packed with vitamins and minerals. The increasing adoption of indoor and vertical farming techniques contributes significantly to consistent supply and year-round availability, mitigating seasonal fluctuations. Furthermore, the growing popularity of microgreens in restaurants and food service establishments, coupled with their versatile culinary applications, adds to market momentum. The diverse range of microgreen types, including broccoli, lettuce, basil, and others, caters to varied consumer preferences, further fueling market expansion. While challenges like initial investment costs for advanced farming technologies and potential competition from conventional greens exist, the overall market outlook remains positive, with substantial growth expected across various regions.

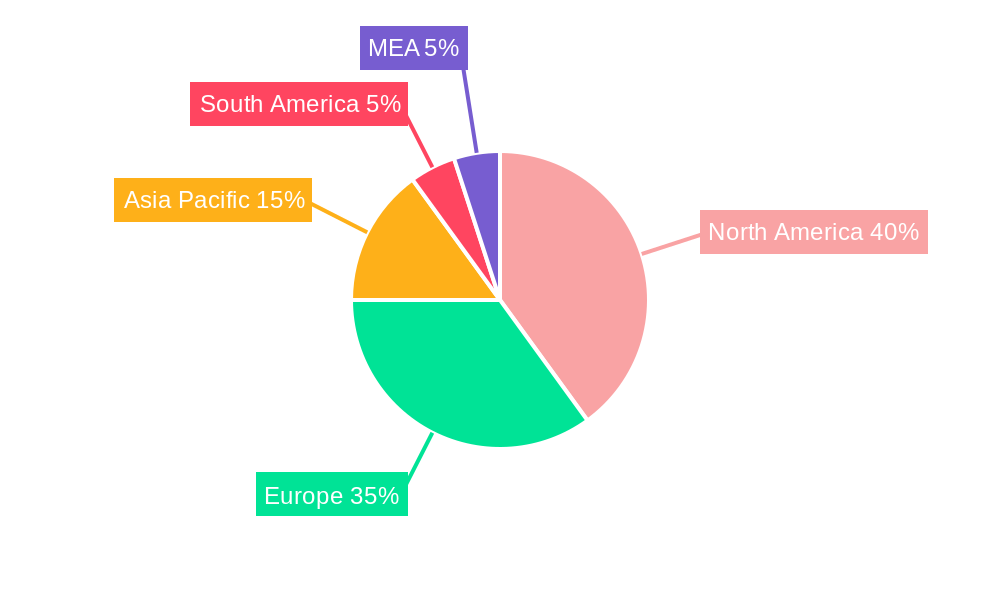
Geographical distribution reveals strong market presence in North America, Europe, and Asia Pacific. North America, particularly the United States and Canada, benefits from established consumer awareness and robust food service sectors. Europe witnesses significant growth driven by health-conscious consumers and expanding food retail channels. Asia Pacific displays high potential, fueled by increasing disposable incomes and changing dietary habits. While data on precise regional market shares is unavailable, a reasonable estimation would indicate North America holding the largest market share initially, followed by Europe, with Asia Pacific experiencing rapid growth and potentially capturing a significant share in the long term. The market segmentation by distribution channel (hypermarkets, restaurants, etc.) and growth medium (peat moss, soil, etc.) further illuminates market dynamics and presents opportunities for targeted growth strategies among various players in the industry.

Microgreens Market Research Report - Market Size, Growth & Forecast

Microgreens Market Report: A Comprehensive Analysis (2019-2033)

This in-depth report provides a comprehensive analysis of the global microgreens market, offering actionable insights for industry professionals, investors, and stakeholders. With a study period spanning 2019-2033, a base year of 2025, and a forecast period of 2025-2033, this report leverages extensive data analysis to project market trends and growth opportunities. The report covers key market segments, including various types of microgreens, distribution channels, farming methods, and growth mediums, providing a detailed understanding of the current market landscape and future prospects. The total market size is projected to reach xx Million by 2033, with a CAGR of xx% during the forecast period.

Microgreens Market Market Structure & Innovation Trends

The microgreens market exhibits a moderately fragmented structure, with several key players competing for market share. Leading companies include Living Earth Farm, Farm Box Greens, Gotham Greens, Jiangsu Skyplant Greenhouse Technology Co Ltd, Madar Farms, Chef's Garden Inc, Shanghai Dehuan Industry Co Ltd, Metro Microgreens, Goodleaf Farms, and AeroFarms LLC. However, the market is witnessing increased consolidation through mergers and acquisitions (M&A) activities. While precise M&A deal values are unavailable for all transactions, several deals in the past few years suggest significant investment and strategic maneuvering in the sector. For example, the partnership between AeroFarms and Amazon Fresh signifies a substantial investment in expanding market reach. The market share held by the top 5 players is estimated to be approximately xx%.

Innovation within the industry is driven by technological advancements in vertical farming and indoor agriculture, enabling greater control over growing conditions and increased efficiency. Regulatory frameworks focusing on food safety and sustainability are also significant drivers of innovation. Product substitutes, such as conventional leafy greens, pose competitive challenges, but the rising demand for nutrient-rich and sustainably grown foods is a key factor bolstering market growth. End-user demographics are shifting towards health-conscious consumers who prioritize convenient and nutritious food options.

Microgreens Market Growth

Microgreens Market Market Dynamics & Trends

The microgreens market is experiencing robust growth, fueled by several key factors. Rising consumer awareness of health benefits associated with microgreens, coupled with increased demand for convenient and nutritious food options, is a primary driver. Technological advancements in vertical and indoor farming have led to improved production efficiency and reduced reliance on traditional land-based agriculture. These innovations are increasing the availability and affordability of microgreens, making them more accessible to a broader consumer base. This increased accessibility is driving market penetration, with a projected market penetration rate of xx% by 2033. The market is witnessing significant technological disruption through the adoption of automation, data analytics, and precision agriculture techniques, optimizing resource utilization and enhancing product quality. The competitive landscape is dynamic, with established players facing pressure from emerging companies leveraging innovative technologies and business models. The overall market demonstrates a high growth trajectory, with a projected CAGR of xx% during the forecast period.

Microgreens Market Growth

Dominant Regions & Segments in Microgreens Market

The North American region currently holds the dominant position in the microgreens market, driven by high consumer demand, substantial investments in indoor farming technologies, and strong regulatory support for sustainable agriculture practices. Key drivers contributing to North America's dominance include:

  • Strong consumer demand for healthy and convenient food options: This fuels the growth of the microgreens market in this region.
  • Significant investments in indoor farming technologies: These advancements enhance production efficiency and reduce dependence on traditional agricultural methods.
  • Supportive government regulations and policies: These policies promote the adoption of sustainable agricultural practices.

Within the segment breakdown, the Hypermarkets/Supermarkets distribution channel dominates, accounting for approximately xx% of market share. This high market share is attributed to the widespread availability and accessibility of microgreens through major retail channels. In terms of microgreen types, Broccoli, Lettuce, and Chicory hold a significant portion of the market, driven by consumer familiarity and widespread acceptance. Indoor farming dominates the farming methods segment due to its ability to control growing conditions and ensure consistent product quality. Similarly, Peat Moss leads in the growth medium segment because of its widespread use and effectiveness in microgreen cultivation.

Microgreens Market Product Innovations

Recent product innovations focus on enhancing the nutritional value, taste, and shelf life of microgreens. Companies are experimenting with different varieties and blends to cater to diverse consumer preferences. Technological innovations such as advanced lighting systems, nutrient delivery systems, and automated harvesting techniques are improving production efficiency and reducing costs. These advancements enable the production of higher-quality microgreens with enhanced flavor profiles and longer shelf lives. Furthermore, the market is witnessing increased focus on sustainable packaging solutions to reduce environmental impact.

Report Scope & Segmentation Analysis

This report provides a comprehensive analysis of the microgreens market, segmented by distribution channel (Hypermarkets/Supermarkets, Restaurants, Other Distribution Channels), type (Broccoli, Lettuce and Chicory, Arugula, Basil, Fennel, Carrots, Sunflower, Radish, Peas, Other Types), farming method (Indoor Farming, Vertical Farming, Commercial Greenhouses, Other Farming), and growth medium (Peat Moss, Soil, Coconut Coir, Tissue Paper, Other Growth Mediums). Each segment is analyzed in terms of market size, growth projections, and competitive dynamics. Growth projections vary across segments, with indoor farming and hypermarket/supermarket channels experiencing particularly strong growth. Competitive dynamics are shaped by the balance between established players and emerging companies leveraging innovative technologies.

Key Drivers of Microgreens Market Growth

Several factors are driving the growth of the microgreens market. Technological advancements in vertical and indoor farming are increasing production efficiency and reducing costs. Growing consumer awareness of the health benefits of microgreens is driving demand, as is the rising preference for fresh, locally sourced produce. Favorable regulatory policies and government support for sustainable agriculture are also contributing to market expansion. Furthermore, the increasing integration of microgreens into various food and beverage applications is broadening the market's reach.

Challenges in the Microgreens Market Sector

The microgreens market faces challenges such as maintaining consistent product quality, managing supply chain complexities, and mitigating the impact of seasonal variations in production. Competition from conventional leafy greens and other produce substitutes can also influence market growth. Regulatory hurdles and food safety standards can add complexity to operations, impacting production costs and efficiency. Maintaining optimal growing conditions while minimizing resource consumption is another key challenge. Furthermore, fluctuating raw material prices and labor costs can affect profitability.

Emerging Opportunities in Microgreens Market

Emerging opportunities exist in expanding market penetration into new geographical regions and consumer segments. The development of new microgreen varieties with enhanced flavors and nutritional profiles offers significant potential. Exploring novel applications of microgreens in the food and beverage industry, as well as developing innovative processing and packaging technologies, can create new revenue streams. Investing in sustainable agriculture practices and incorporating advanced data analytics for optimizing production processes can strengthen market competitiveness.

Leading Players in the Microgreens Market Market

  • Living Earth Farm
  • Farm Box Greens
  • Gotham Greens
  • Jiangsu Skyplant Greenhouse Technology Co Ltd
  • Madar Farms
  • Chef's Garden Inc
  • Shanghai Dehuan Industry Co Ltd
  • Metro Microgreens
  • Goodleaf Farms
  • AeroFarms LLC

Key Developments in Microgreens Market Industry

  • August 2022: AeroFarms expanded its retail presence to 160 Fresh Market stores across 22 states.
  • February 2023: Good Leaf Farm partnered with Unfold to introduce premium vertically farmed greens.
  • May 2023: AeroFarms launched a nationwide expansion through a collaboration with Amazon Fresh.

Future Outlook for Microgreens Market Market

The microgreens market is poised for continued strong growth, driven by increasing consumer demand, technological advancements, and favorable regulatory policies. The market will likely see increased consolidation through mergers and acquisitions, as well as the emergence of new players leveraging innovative technologies and business models. Strategic investments in research and development, along with sustainable production practices, will be crucial for companies to maintain competitiveness and capture market share. Expanding into new geographic regions and exploring diverse applications of microgreens will further contribute to market expansion.

Microgreens Market Segmentation

  • 1. Production Analysis
  • 2. Consumption Analysis
  • 3. Import Market Analysis (Value & Volume)
  • 4. Export Market Analysis (Value & Volume)
  • 5. Price Trend Analysis

Microgreens Market Segmentation By Geography

  • 1. North America
    • 1.1. United States
    • 1.2. Canada
    • 1.3. Mexico
  • 2. South America
    • 2.1. Brazil
    • 2.2. Argentina
    • 2.3. Rest of South America
  • 3. Europe
    • 3.1. United Kingdom
    • 3.2. Germany
    • 3.3. France
    • 3.4. Italy
    • 3.5. Spain
    • 3.6. Russia
    • 3.7. Benelux
    • 3.8. Nordics
    • 3.9. Rest of Europe
  • 4. Middle East & Africa
    • 4.1. Turkey
    • 4.2. Israel
    • 4.3. GCC
    • 4.4. North Africa
    • 4.5. South Africa
    • 4.6. Rest of Middle East & Africa
  • 5. Asia Pacific
    • 5.1. China
    • 5.2. India
    • 5.3. Japan
    • 5.4. South Korea
    • 5.5. ASEAN
    • 5.6. Oceania
    • 5.7. Rest of Asia Pacific
Microgreens Market Regional Share


Microgreens Market REPORT HIGHLIGHTS

AspectsDetails
Study Period 2019-2033
Base Year 2024
Estimated Year 2025
Forecast Period2025-2033
Historical Period2019-2024
Growth RateCAGR of 6.40% from 2019-2033
Segmentation
    • By Production Analysis
    • By Consumption Analysis
    • By Import Market Analysis (Value & Volume)
    • By Export Market Analysis (Value & Volume)
    • By Price Trend Analysis
  • By Geography
    • North America
      • United States
      • Canada
      • Mexico
    • South America
      • Brazil
      • Argentina
      • Rest of South America
    • Europe
      • United Kingdom
      • Germany
      • France
      • Italy
      • Spain
      • Russia
      • Benelux
      • Nordics
      • Rest of Europe
    • Middle East & Africa
      • Turkey
      • Israel
      • GCC
      • North Africa
      • South Africa
      • Rest of Middle East & Africa
    • Asia Pacific
      • China
      • India
      • Japan
      • South Korea
      • ASEAN
      • Oceania
      • Rest of Asia Pacific


Table of Contents

  1. 1. Introduction
    • 1.1. Research Scope
    • 1.2. Market Segmentation
    • 1.3. Research Methodology
    • 1.4. Definitions and Assumptions
  2. 2. Executive Summary
    • 2.1. Introduction
  3. 3. Market Dynamics
    • 3.1. Introduction
      • 3.2. Market Drivers
        • 3.2.1. Seed Treatment As A Solution To Enhance Yield; Growing Awareness For Seed Treatment Among The Farmers; Rising Trend Of Organic Farming
      • 3.3. Market Restrains
        • 3.3.1. Limitations Across Farm-Level Seed Treatment; Rising Environmental Concerns
      • 3.4. Market Trends
        • 3.4.1. Rise in Adoption of Indoor Farming
  4. 4. Market Factor Analysis
    • 4.1. Porters Five Forces
    • 4.2. Supply/Value Chain
    • 4.3. PESTEL analysis
    • 4.4. Market Entropy
    • 4.5. Patent/Trademark Analysis
  5. 5. Global Microgreens Market Analysis, Insights and Forecast, 2019-2031
    • 5.1. Market Analysis, Insights and Forecast - by Production Analysis
      • 5.2. Market Analysis, Insights and Forecast - by Consumption Analysis
        • 5.3. Market Analysis, Insights and Forecast - by Import Market Analysis (Value & Volume)
          • 5.4. Market Analysis, Insights and Forecast - by Export Market Analysis (Value & Volume)
            • 5.5. Market Analysis, Insights and Forecast - by Price Trend Analysis
              • 5.6. Market Analysis, Insights and Forecast - by Region
                • 5.6.1. North America
                • 5.6.2. South America
                • 5.6.3. Europe
                • 5.6.4. Middle East & Africa
                • 5.6.5. Asia Pacific
            • 6. North America Microgreens Market Analysis, Insights and Forecast, 2019-2031
              • 6.1. Market Analysis, Insights and Forecast - by Production Analysis
                • 6.2. Market Analysis, Insights and Forecast - by Consumption Analysis
                  • 6.3. Market Analysis, Insights and Forecast - by Import Market Analysis (Value & Volume)
                    • 6.4. Market Analysis, Insights and Forecast - by Export Market Analysis (Value & Volume)
                      • 6.5. Market Analysis, Insights and Forecast - by Price Trend Analysis
                      • 7. South America Microgreens Market Analysis, Insights and Forecast, 2019-2031
                        • 7.1. Market Analysis, Insights and Forecast - by Production Analysis
                          • 7.2. Market Analysis, Insights and Forecast - by Consumption Analysis
                            • 7.3. Market Analysis, Insights and Forecast - by Import Market Analysis (Value & Volume)
                              • 7.4. Market Analysis, Insights and Forecast - by Export Market Analysis (Value & Volume)
                                • 7.5. Market Analysis, Insights and Forecast - by Price Trend Analysis
                                • 8. Europe Microgreens Market Analysis, Insights and Forecast, 2019-2031
                                  • 8.1. Market Analysis, Insights and Forecast - by Production Analysis
                                    • 8.2. Market Analysis, Insights and Forecast - by Consumption Analysis
                                      • 8.3. Market Analysis, Insights and Forecast - by Import Market Analysis (Value & Volume)
                                        • 8.4. Market Analysis, Insights and Forecast - by Export Market Analysis (Value & Volume)
                                          • 8.5. Market Analysis, Insights and Forecast - by Price Trend Analysis
                                          • 9. Middle East & Africa Microgreens Market Analysis, Insights and Forecast, 2019-2031
                                            • 9.1. Market Analysis, Insights and Forecast - by Production Analysis
                                              • 9.2. Market Analysis, Insights and Forecast - by Consumption Analysis
                                                • 9.3. Market Analysis, Insights and Forecast - by Import Market Analysis (Value & Volume)
                                                  • 9.4. Market Analysis, Insights and Forecast - by Export Market Analysis (Value & Volume)
                                                    • 9.5. Market Analysis, Insights and Forecast - by Price Trend Analysis
                                                    • 10. Asia Pacific Microgreens Market Analysis, Insights and Forecast, 2019-2031
                                                      • 10.1. Market Analysis, Insights and Forecast - by Production Analysis
                                                        • 10.2. Market Analysis, Insights and Forecast - by Consumption Analysis
                                                          • 10.3. Market Analysis, Insights and Forecast - by Import Market Analysis (Value & Volume)
                                                            • 10.4. Market Analysis, Insights and Forecast - by Export Market Analysis (Value & Volume)
                                                              • 10.5. Market Analysis, Insights and Forecast - by Price Trend Analysis
                                                              • 11. North America Microgreens Market Analysis, Insights and Forecast, 2019-2031
                                                                  • 11.1. Market Analysis, Insights and Forecast - By Country/Sub-region
                                                                    • 11.1.1 United States
                                                                    • 11.1.2 Canada
                                                                    • 11.1.3 Mexico
                                                              • 12. Europe Microgreens Market Analysis, Insights and Forecast, 2019-2031
                                                                  • 12.1. Market Analysis, Insights and Forecast - By Country/Sub-region
                                                                    • 12.1.1 Germany
                                                                    • 12.1.2 United Kingdom
                                                                    • 12.1.3 France
                                                                    • 12.1.4 Spain
                                                                    • 12.1.5 Italy
                                                                    • 12.1.6 Spain
                                                                    • 12.1.7 Belgium
                                                                    • 12.1.8 Netherland
                                                                    • 12.1.9 Nordics
                                                                    • 12.1.10 Rest of Europe
                                                              • 13. Asia Pacific Microgreens Market Analysis, Insights and Forecast, 2019-2031
                                                                  • 13.1. Market Analysis, Insights and Forecast - By Country/Sub-region
                                                                    • 13.1.1 China
                                                                    • 13.1.2 Japan
                                                                    • 13.1.3 India
                                                                    • 13.1.4 South Korea
                                                                    • 13.1.5 Southeast Asia
                                                                    • 13.1.6 Australia
                                                                    • 13.1.7 Indonesia
                                                                    • 13.1.8 Phillipes
                                                                    • 13.1.9 Singapore
                                                                    • 13.1.10 Thailandc
                                                                    • 13.1.11 Rest of Asia Pacific
                                                              • 14. South America Microgreens Market Analysis, Insights and Forecast, 2019-2031
                                                                  • 14.1. Market Analysis, Insights and Forecast - By Country/Sub-region
                                                                    • 14.1.1 Brazil
                                                                    • 14.1.2 Argentina
                                                                    • 14.1.3 Peru
                                                                    • 14.1.4 Chile
                                                                    • 14.1.5 Colombia
                                                                    • 14.1.6 Ecuador
                                                                    • 14.1.7 Venezuela
                                                                    • 14.1.8 Rest of South America
                                                              • 15. North America Microgreens Market Analysis, Insights and Forecast, 2019-2031
                                                                  • 15.1. Market Analysis, Insights and Forecast - By Country/Sub-region
                                                                    • 15.1.1 United States
                                                                    • 15.1.2 Canada
                                                                    • 15.1.3 Mexico
                                                              • 16. MEA Microgreens Market Analysis, Insights and Forecast, 2019-2031
                                                                  • 16.1. Market Analysis, Insights and Forecast - By Country/Sub-region
                                                                    • 16.1.1 United Arab Emirates
                                                                    • 16.1.2 Saudi Arabia
                                                                    • 16.1.3 South Africa
                                                                    • 16.1.4 Rest of Middle East and Africa
                                                              • 17. Competitive Analysis
                                                                • 17.1. Global Market Share Analysis 2024
                                                                  • 17.2. Company Profiles
                                                                    • 17.2.1 Living Earth Farm
                                                                      • 17.2.1.1. Overview
                                                                      • 17.2.1.2. Products
                                                                      • 17.2.1.3. SWOT Analysis
                                                                      • 17.2.1.4. Recent Developments
                                                                      • 17.2.1.5. Financials (Based on Availability)
                                                                    • 17.2.2 Farm Box Greens
                                                                      • 17.2.2.1. Overview
                                                                      • 17.2.2.2. Products
                                                                      • 17.2.2.3. SWOT Analysis
                                                                      • 17.2.2.4. Recent Developments
                                                                      • 17.2.2.5. Financials (Based on Availability)
                                                                    • 17.2.3 Gotham Greens*List Not Exhaustive
                                                                      • 17.2.3.1. Overview
                                                                      • 17.2.3.2. Products
                                                                      • 17.2.3.3. SWOT Analysis
                                                                      • 17.2.3.4. Recent Developments
                                                                      • 17.2.3.5. Financials (Based on Availability)
                                                                    • 17.2.4 Jiangsu Skyplant Greenhouse Technology Co Ltd
                                                                      • 17.2.4.1. Overview
                                                                      • 17.2.4.2. Products
                                                                      • 17.2.4.3. SWOT Analysis
                                                                      • 17.2.4.4. Recent Developments
                                                                      • 17.2.4.5. Financials (Based on Availability)
                                                                    • 17.2.5 Madar Farms
                                                                      • 17.2.5.1. Overview
                                                                      • 17.2.5.2. Products
                                                                      • 17.2.5.3. SWOT Analysis
                                                                      • 17.2.5.4. Recent Developments
                                                                      • 17.2.5.5. Financials (Based on Availability)
                                                                    • 17.2.6 Chef's Garden Inc
                                                                      • 17.2.6.1. Overview
                                                                      • 17.2.6.2. Products
                                                                      • 17.2.6.3. SWOT Analysis
                                                                      • 17.2.6.4. Recent Developments
                                                                      • 17.2.6.5. Financials (Based on Availability)
                                                                    • 17.2.7 Shanghai Dehuan Industry Co Ltd
                                                                      • 17.2.7.1. Overview
                                                                      • 17.2.7.2. Products
                                                                      • 17.2.7.3. SWOT Analysis
                                                                      • 17.2.7.4. Recent Developments
                                                                      • 17.2.7.5. Financials (Based on Availability)
                                                                    • 17.2.8 Metro Microgreens
                                                                      • 17.2.8.1. Overview
                                                                      • 17.2.8.2. Products
                                                                      • 17.2.8.3. SWOT Analysis
                                                                      • 17.2.8.4. Recent Developments
                                                                      • 17.2.8.5. Financials (Based on Availability)
                                                                    • 17.2.9 Goodleaf Farms
                                                                      • 17.2.9.1. Overview
                                                                      • 17.2.9.2. Products
                                                                      • 17.2.9.3. SWOT Analysis
                                                                      • 17.2.9.4. Recent Developments
                                                                      • 17.2.9.5. Financials (Based on Availability)
                                                                    • 17.2.10 AeroFarms LLC
                                                                      • 17.2.10.1. Overview
                                                                      • 17.2.10.2. Products
                                                                      • 17.2.10.3. SWOT Analysis
                                                                      • 17.2.10.4. Recent Developments
                                                                      • 17.2.10.5. Financials (Based on Availability)

                                                              List of Figures

                                                              1. Figure 1: Global Microgreens Market Revenue Breakdown (Million, %) by Region 2024 & 2032
                                                              2. Figure 2: North America Microgreens Market Revenue (Million), by Country 2024 & 2032
                                                              3. Figure 3: North America Microgreens Market Revenue Share (%), by Country 2024 & 2032
                                                              4. Figure 4: Europe Microgreens Market Revenue (Million), by Country 2024 & 2032
                                                              5. Figure 5: Europe Microgreens Market Revenue Share (%), by Country 2024 & 2032
                                                              6. Figure 6: Asia Pacific Microgreens Market Revenue (Million), by Country 2024 & 2032
                                                              7. Figure 7: Asia Pacific Microgreens Market Revenue Share (%), by Country 2024 & 2032
                                                              8. Figure 8: South America Microgreens Market Revenue (Million), by Country 2024 & 2032
                                                              9. Figure 9: South America Microgreens Market Revenue Share (%), by Country 2024 & 2032
                                                              10. Figure 10: North America Microgreens Market Revenue (Million), by Country 2024 & 2032
                                                              11. Figure 11: North America Microgreens Market Revenue Share (%), by Country 2024 & 2032
                                                              12. Figure 12: MEA Microgreens Market Revenue (Million), by Country 2024 & 2032
                                                              13. Figure 13: MEA Microgreens Market Revenue Share (%), by Country 2024 & 2032
                                                              14. Figure 14: North America Microgreens Market Revenue (Million), by Production Analysis 2024 & 2032
                                                              15. Figure 15: North America Microgreens Market Revenue Share (%), by Production Analysis 2024 & 2032
                                                              16. Figure 16: North America Microgreens Market Revenue (Million), by Consumption Analysis 2024 & 2032
                                                              17. Figure 17: North America Microgreens Market Revenue Share (%), by Consumption Analysis 2024 & 2032
                                                              18. Figure 18: North America Microgreens Market Revenue (Million), by Import Market Analysis (Value & Volume) 2024 & 2032
                                                              19. Figure 19: North America Microgreens Market Revenue Share (%), by Import Market Analysis (Value & Volume) 2024 & 2032
                                                              20. Figure 20: North America Microgreens Market Revenue (Million), by Export Market Analysis (Value & Volume) 2024 & 2032
                                                              21. Figure 21: North America Microgreens Market Revenue Share (%), by Export Market Analysis (Value & Volume) 2024 & 2032
                                                              22. Figure 22: North America Microgreens Market Revenue (Million), by Price Trend Analysis 2024 & 2032
                                                              23. Figure 23: North America Microgreens Market Revenue Share (%), by Price Trend Analysis 2024 & 2032
                                                              24. Figure 24: North America Microgreens Market Revenue (Million), by Country 2024 & 2032
                                                              25. Figure 25: North America Microgreens Market Revenue Share (%), by Country 2024 & 2032
                                                              26. Figure 26: South America Microgreens Market Revenue (Million), by Production Analysis 2024 & 2032
                                                              27. Figure 27: South America Microgreens Market Revenue Share (%), by Production Analysis 2024 & 2032
                                                              28. Figure 28: South America Microgreens Market Revenue (Million), by Consumption Analysis 2024 & 2032
                                                              29. Figure 29: South America Microgreens Market Revenue Share (%), by Consumption Analysis 2024 & 2032
                                                              30. Figure 30: South America Microgreens Market Revenue (Million), by Import Market Analysis (Value & Volume) 2024 & 2032
                                                              31. Figure 31: South America Microgreens Market Revenue Share (%), by Import Market Analysis (Value & Volume) 2024 & 2032
                                                              32. Figure 32: South America Microgreens Market Revenue (Million), by Export Market Analysis (Value & Volume) 2024 & 2032
                                                              33. Figure 33: South America Microgreens Market Revenue Share (%), by Export Market Analysis (Value & Volume) 2024 & 2032
                                                              34. Figure 34: South America Microgreens Market Revenue (Million), by Price Trend Analysis 2024 & 2032
                                                              35. Figure 35: South America Microgreens Market Revenue Share (%), by Price Trend Analysis 2024 & 2032
                                                              36. Figure 36: South America Microgreens Market Revenue (Million), by Country 2024 & 2032
                                                              37. Figure 37: South America Microgreens Market Revenue Share (%), by Country 2024 & 2032
                                                              38. Figure 38: Europe Microgreens Market Revenue (Million), by Production Analysis 2024 & 2032
                                                              39. Figure 39: Europe Microgreens Market Revenue Share (%), by Production Analysis 2024 & 2032
                                                              40. Figure 40: Europe Microgreens Market Revenue (Million), by Consumption Analysis 2024 & 2032
                                                              41. Figure 41: Europe Microgreens Market Revenue Share (%), by Consumption Analysis 2024 & 2032
                                                              42. Figure 42: Europe Microgreens Market Revenue (Million), by Import Market Analysis (Value & Volume) 2024 & 2032
                                                              43. Figure 43: Europe Microgreens Market Revenue Share (%), by Import Market Analysis (Value & Volume) 2024 & 2032
                                                              44. Figure 44: Europe Microgreens Market Revenue (Million), by Export Market Analysis (Value & Volume) 2024 & 2032
                                                              45. Figure 45: Europe Microgreens Market Revenue Share (%), by Export Market Analysis (Value & Volume) 2024 & 2032
                                                              46. Figure 46: Europe Microgreens Market Revenue (Million), by Price Trend Analysis 2024 & 2032
                                                              47. Figure 47: Europe Microgreens Market Revenue Share (%), by Price Trend Analysis 2024 & 2032
                                                              48. Figure 48: Europe Microgreens Market Revenue (Million), by Country 2024 & 2032
                                                              49. Figure 49: Europe Microgreens Market Revenue Share (%), by Country 2024 & 2032
                                                              50. Figure 50: Middle East & Africa Microgreens Market Revenue (Million), by Production Analysis 2024 & 2032
                                                              51. Figure 51: Middle East & Africa Microgreens Market Revenue Share (%), by Production Analysis 2024 & 2032
                                                              52. Figure 52: Middle East & Africa Microgreens Market Revenue (Million), by Consumption Analysis 2024 & 2032
                                                              53. Figure 53: Middle East & Africa Microgreens Market Revenue Share (%), by Consumption Analysis 2024 & 2032
                                                              54. Figure 54: Middle East & Africa Microgreens Market Revenue (Million), by Import Market Analysis (Value & Volume) 2024 & 2032
                                                              55. Figure 55: Middle East & Africa Microgreens Market Revenue Share (%), by Import Market Analysis (Value & Volume) 2024 & 2032
                                                              56. Figure 56: Middle East & Africa Microgreens Market Revenue (Million), by Export Market Analysis (Value & Volume) 2024 & 2032
                                                              57. Figure 57: Middle East & Africa Microgreens Market Revenue Share (%), by Export Market Analysis (Value & Volume) 2024 & 2032
                                                              58. Figure 58: Middle East & Africa Microgreens Market Revenue (Million), by Price Trend Analysis 2024 & 2032
                                                              59. Figure 59: Middle East & Africa Microgreens Market Revenue Share (%), by Price Trend Analysis 2024 & 2032
                                                              60. Figure 60: Middle East & Africa Microgreens Market Revenue (Million), by Country 2024 & 2032
                                                              61. Figure 61: Middle East & Africa Microgreens Market Revenue Share (%), by Country 2024 & 2032
                                                              62. Figure 62: Asia Pacific Microgreens Market Revenue (Million), by Production Analysis 2024 & 2032
                                                              63. Figure 63: Asia Pacific Microgreens Market Revenue Share (%), by Production Analysis 2024 & 2032
                                                              64. Figure 64: Asia Pacific Microgreens Market Revenue (Million), by Consumption Analysis 2024 & 2032
                                                              65. Figure 65: Asia Pacific Microgreens Market Revenue Share (%), by Consumption Analysis 2024 & 2032
                                                              66. Figure 66: Asia Pacific Microgreens Market Revenue (Million), by Import Market Analysis (Value & Volume) 2024 & 2032
                                                              67. Figure 67: Asia Pacific Microgreens Market Revenue Share (%), by Import Market Analysis (Value & Volume) 2024 & 2032
                                                              68. Figure 68: Asia Pacific Microgreens Market Revenue (Million), by Export Market Analysis (Value & Volume) 2024 & 2032
                                                              69. Figure 69: Asia Pacific Microgreens Market Revenue Share (%), by Export Market Analysis (Value & Volume) 2024 & 2032
                                                              70. Figure 70: Asia Pacific Microgreens Market Revenue (Million), by Price Trend Analysis 2024 & 2032
                                                              71. Figure 71: Asia Pacific Microgreens Market Revenue Share (%), by Price Trend Analysis 2024 & 2032
                                                              72. Figure 72: Asia Pacific Microgreens Market Revenue (Million), by Country 2024 & 2032
                                                              73. Figure 73: Asia Pacific Microgreens Market Revenue Share (%), by Country 2024 & 2032

                                                              List of Tables

                                                              1. Table 1: Global Microgreens Market Revenue Million Forecast, by Region 2019 & 2032
                                                              2. Table 2: Global Microgreens Market Revenue Million Forecast, by Production Analysis 2019 & 2032
                                                              3. Table 3: Global Microgreens Market Revenue Million Forecast, by Consumption Analysis 2019 & 2032
                                                              4. Table 4: Global Microgreens Market Revenue Million Forecast, by Import Market Analysis (Value & Volume) 2019 & 2032
                                                              5. Table 5: Global Microgreens Market Revenue Million Forecast, by Export Market Analysis (Value & Volume) 2019 & 2032
                                                              6. Table 6: Global Microgreens Market Revenue Million Forecast, by Price Trend Analysis 2019 & 2032
                                                              7. Table 7: Global Microgreens Market Revenue Million Forecast, by Region 2019 & 2032
                                                              8. Table 8: Global Microgreens Market Revenue Million Forecast, by Country 2019 & 2032
                                                              9. Table 9: United States Microgreens Market Revenue (Million) Forecast, by Application 2019 & 2032
                                                              10. Table 10: Canada Microgreens Market Revenue (Million) Forecast, by Application 2019 & 2032
                                                              11. Table 11: Mexico Microgreens Market Revenue (Million) Forecast, by Application 2019 & 2032
                                                              12. Table 12: Global Microgreens Market Revenue Million Forecast, by Country 2019 & 2032
                                                              13. Table 13: Germany Microgreens Market Revenue (Million) Forecast, by Application 2019 & 2032
                                                              14. Table 14: United Kingdom Microgreens Market Revenue (Million) Forecast, by Application 2019 & 2032
                                                              15. Table 15: France Microgreens Market Revenue (Million) Forecast, by Application 2019 & 2032
                                                              16. Table 16: Spain Microgreens Market Revenue (Million) Forecast, by Application 2019 & 2032
                                                              17. Table 17: Italy Microgreens Market Revenue (Million) Forecast, by Application 2019 & 2032
                                                              18. Table 18: Spain Microgreens Market Revenue (Million) Forecast, by Application 2019 & 2032
                                                              19. Table 19: Belgium Microgreens Market Revenue (Million) Forecast, by Application 2019 & 2032
                                                              20. Table 20: Netherland Microgreens Market Revenue (Million) Forecast, by Application 2019 & 2032
                                                              21. Table 21: Nordics Microgreens Market Revenue (Million) Forecast, by Application 2019 & 2032
                                                              22. Table 22: Rest of Europe Microgreens Market Revenue (Million) Forecast, by Application 2019 & 2032
                                                              23. Table 23: Global Microgreens Market Revenue Million Forecast, by Country 2019 & 2032
                                                              24. Table 24: China Microgreens Market Revenue (Million) Forecast, by Application 2019 & 2032
                                                              25. Table 25: Japan Microgreens Market Revenue (Million) Forecast, by Application 2019 & 2032
                                                              26. Table 26: India Microgreens Market Revenue (Million) Forecast, by Application 2019 & 2032
                                                              27. Table 27: South Korea Microgreens Market Revenue (Million) Forecast, by Application 2019 & 2032
                                                              28. Table 28: Southeast Asia Microgreens Market Revenue (Million) Forecast, by Application 2019 & 2032
                                                              29. Table 29: Australia Microgreens Market Revenue (Million) Forecast, by Application 2019 & 2032
                                                              30. Table 30: Indonesia Microgreens Market Revenue (Million) Forecast, by Application 2019 & 2032
                                                              31. Table 31: Phillipes Microgreens Market Revenue (Million) Forecast, by Application 2019 & 2032
                                                              32. Table 32: Singapore Microgreens Market Revenue (Million) Forecast, by Application 2019 & 2032
                                                              33. Table 33: Thailandc Microgreens Market Revenue (Million) Forecast, by Application 2019 & 2032
                                                              34. Table 34: Rest of Asia Pacific Microgreens Market Revenue (Million) Forecast, by Application 2019 & 2032
                                                              35. Table 35: Global Microgreens Market Revenue Million Forecast, by Country 2019 & 2032
                                                              36. Table 36: Brazil Microgreens Market Revenue (Million) Forecast, by Application 2019 & 2032
                                                              37. Table 37: Argentina Microgreens Market Revenue (Million) Forecast, by Application 2019 & 2032
                                                              38. Table 38: Peru Microgreens Market Revenue (Million) Forecast, by Application 2019 & 2032
                                                              39. Table 39: Chile Microgreens Market Revenue (Million) Forecast, by Application 2019 & 2032
                                                              40. Table 40: Colombia Microgreens Market Revenue (Million) Forecast, by Application 2019 & 2032
                                                              41. Table 41: Ecuador Microgreens Market Revenue (Million) Forecast, by Application 2019 & 2032
                                                              42. Table 42: Venezuela Microgreens Market Revenue (Million) Forecast, by Application 2019 & 2032
                                                              43. Table 43: Rest of South America Microgreens Market Revenue (Million) Forecast, by Application 2019 & 2032
                                                              44. Table 44: Global Microgreens Market Revenue Million Forecast, by Country 2019 & 2032
                                                              45. Table 45: United States Microgreens Market Revenue (Million) Forecast, by Application 2019 & 2032
                                                              46. Table 46: Canada Microgreens Market Revenue (Million) Forecast, by Application 2019 & 2032
                                                              47. Table 47: Mexico Microgreens Market Revenue (Million) Forecast, by Application 2019 & 2032
                                                              48. Table 48: Global Microgreens Market Revenue Million Forecast, by Country 2019 & 2032
                                                              49. Table 49: United Arab Emirates Microgreens Market Revenue (Million) Forecast, by Application 2019 & 2032
                                                              50. Table 50: Saudi Arabia Microgreens Market Revenue (Million) Forecast, by Application 2019 & 2032
                                                              51. Table 51: South Africa Microgreens Market Revenue (Million) Forecast, by Application 2019 & 2032
                                                              52. Table 52: Rest of Middle East and Africa Microgreens Market Revenue (Million) Forecast, by Application 2019 & 2032
                                                              53. Table 53: Global Microgreens Market Revenue Million Forecast, by Production Analysis 2019 & 2032
                                                              54. Table 54: Global Microgreens Market Revenue Million Forecast, by Consumption Analysis 2019 & 2032
                                                              55. Table 55: Global Microgreens Market Revenue Million Forecast, by Import Market Analysis (Value & Volume) 2019 & 2032
                                                              56. Table 56: Global Microgreens Market Revenue Million Forecast, by Export Market Analysis (Value & Volume) 2019 & 2032
                                                              57. Table 57: Global Microgreens Market Revenue Million Forecast, by Price Trend Analysis 2019 & 2032
                                                              58. Table 58: Global Microgreens Market Revenue Million Forecast, by Country 2019 & 2032
                                                              59. Table 59: United States Microgreens Market Revenue (Million) Forecast, by Application 2019 & 2032
                                                              60. Table 60: Canada Microgreens Market Revenue (Million) Forecast, by Application 2019 & 2032
                                                              61. Table 61: Mexico Microgreens Market Revenue (Million) Forecast, by Application 2019 & 2032
                                                              62. Table 62: Global Microgreens Market Revenue Million Forecast, by Production Analysis 2019 & 2032
                                                              63. Table 63: Global Microgreens Market Revenue Million Forecast, by Consumption Analysis 2019 & 2032
                                                              64. Table 64: Global Microgreens Market Revenue Million Forecast, by Import Market Analysis (Value & Volume) 2019 & 2032
                                                              65. Table 65: Global Microgreens Market Revenue Million Forecast, by Export Market Analysis (Value & Volume) 2019 & 2032
                                                              66. Table 66: Global Microgreens Market Revenue Million Forecast, by Price Trend Analysis 2019 & 2032
                                                              67. Table 67: Global Microgreens Market Revenue Million Forecast, by Country 2019 & 2032
                                                              68. Table 68: Brazil Microgreens Market Revenue (Million) Forecast, by Application 2019 & 2032
                                                              69. Table 69: Argentina Microgreens Market Revenue (Million) Forecast, by Application 2019 & 2032
                                                              70. Table 70: Rest of South America Microgreens Market Revenue (Million) Forecast, by Application 2019 & 2032
                                                              71. Table 71: Global Microgreens Market Revenue Million Forecast, by Production Analysis 2019 & 2032
                                                              72. Table 72: Global Microgreens Market Revenue Million Forecast, by Consumption Analysis 2019 & 2032
                                                              73. Table 73: Global Microgreens Market Revenue Million Forecast, by Import Market Analysis (Value & Volume) 2019 & 2032
                                                              74. Table 74: Global Microgreens Market Revenue Million Forecast, by Export Market Analysis (Value & Volume) 2019 & 2032
                                                              75. Table 75: Global Microgreens Market Revenue Million Forecast, by Price Trend Analysis 2019 & 2032
                                                              76. Table 76: Global Microgreens Market Revenue Million Forecast, by Country 2019 & 2032
                                                              77. Table 77: United Kingdom Microgreens Market Revenue (Million) Forecast, by Application 2019 & 2032
                                                              78. Table 78: Germany Microgreens Market Revenue (Million) Forecast, by Application 2019 & 2032
                                                              79. Table 79: France Microgreens Market Revenue (Million) Forecast, by Application 2019 & 2032
                                                              80. Table 80: Italy Microgreens Market Revenue (Million) Forecast, by Application 2019 & 2032
                                                              81. Table 81: Spain Microgreens Market Revenue (Million) Forecast, by Application 2019 & 2032
                                                              82. Table 82: Russia Microgreens Market Revenue (Million) Forecast, by Application 2019 & 2032
                                                              83. Table 83: Benelux Microgreens Market Revenue (Million) Forecast, by Application 2019 & 2032
                                                              84. Table 84: Nordics Microgreens Market Revenue (Million) Forecast, by Application 2019 & 2032
                                                              85. Table 85: Rest of Europe Microgreens Market Revenue (Million) Forecast, by Application 2019 & 2032
                                                              86. Table 86: Global Microgreens Market Revenue Million Forecast, by Production Analysis 2019 & 2032
                                                              87. Table 87: Global Microgreens Market Revenue Million Forecast, by Consumption Analysis 2019 & 2032
                                                              88. Table 88: Global Microgreens Market Revenue Million Forecast, by Import Market Analysis (Value & Volume) 2019 & 2032
                                                              89. Table 89: Global Microgreens Market Revenue Million Forecast, by Export Market Analysis (Value & Volume) 2019 & 2032
                                                              90. Table 90: Global Microgreens Market Revenue Million Forecast, by Price Trend Analysis 2019 & 2032
                                                              91. Table 91: Global Microgreens Market Revenue Million Forecast, by Country 2019 & 2032
                                                              92. Table 92: Turkey Microgreens Market Revenue (Million) Forecast, by Application 2019 & 2032
                                                              93. Table 93: Israel Microgreens Market Revenue (Million) Forecast, by Application 2019 & 2032
                                                              94. Table 94: GCC Microgreens Market Revenue (Million) Forecast, by Application 2019 & 2032
                                                              95. Table 95: North Africa Microgreens Market Revenue (Million) Forecast, by Application 2019 & 2032
                                                              96. Table 96: South Africa Microgreens Market Revenue (Million) Forecast, by Application 2019 & 2032
                                                              97. Table 97: Rest of Middle East & Africa Microgreens Market Revenue (Million) Forecast, by Application 2019 & 2032
                                                              98. Table 98: Global Microgreens Market Revenue Million Forecast, by Production Analysis 2019 & 2032
                                                              99. Table 99: Global Microgreens Market Revenue Million Forecast, by Consumption Analysis 2019 & 2032
                                                              100. Table 100: Global Microgreens Market Revenue Million Forecast, by Import Market Analysis (Value & Volume) 2019 & 2032
                                                              101. Table 101: Global Microgreens Market Revenue Million Forecast, by Export Market Analysis (Value & Volume) 2019 & 2032
                                                              102. Table 102: Global Microgreens Market Revenue Million Forecast, by Price Trend Analysis 2019 & 2032
                                                              103. Table 103: Global Microgreens Market Revenue Million Forecast, by Country 2019 & 2032
                                                              104. Table 104: China Microgreens Market Revenue (Million) Forecast, by Application 2019 & 2032
                                                              105. Table 105: India Microgreens Market Revenue (Million) Forecast, by Application 2019 & 2032
                                                              106. Table 106: Japan Microgreens Market Revenue (Million) Forecast, by Application 2019 & 2032
                                                              107. Table 107: South Korea Microgreens Market Revenue (Million) Forecast, by Application 2019 & 2032
                                                              108. Table 108: ASEAN Microgreens Market Revenue (Million) Forecast, by Application 2019 & 2032
                                                              109. Table 109: Oceania Microgreens Market Revenue (Million) Forecast, by Application 2019 & 2032
                                                              110. Table 110: Rest of Asia Pacific Microgreens Market Revenue (Million) Forecast, by Application 2019 & 2032


                                                              Frequently Asked Questions

                                                              1. What is the projected Compound Annual Growth Rate (CAGR) of the Microgreens Market?

                                                              The projected CAGR is approximately 6.40%.

                                                              2. Which companies are prominent players in the Microgreens Market?

                                                              Key companies in the market include Living Earth Farm, Farm Box Greens, Gotham Greens*List Not Exhaustive, Jiangsu Skyplant Greenhouse Technology Co Ltd, Madar Farms, Chef's Garden Inc, Shanghai Dehuan Industry Co Ltd, Metro Microgreens, Goodleaf Farms, AeroFarms LLC.

                                                              3. What are the main segments of the Microgreens Market?

                                                              The market segments include Production Analysis, Consumption Analysis, Import Market Analysis (Value & Volume), Export Market Analysis (Value & Volume), Price Trend Analysis.

                                                              4. Can you provide details about the market size?

                                                              The market size is estimated to be USD 245.77 Million as of 2022.

                                                              5. What are some drivers contributing to market growth?

                                                              Seed Treatment As A Solution To Enhance Yield; Growing Awareness For Seed Treatment Among The Farmers; Rising Trend Of Organic Farming.

                                                              6. What are the notable trends driving market growth?

                                                              Rise in Adoption of Indoor Farming.

                                                              7. Are there any restraints impacting market growth?

                                                              Limitations Across Farm-Level Seed Treatment; Rising Environmental Concerns.

                                                              8. Can you provide examples of recent developments in the market?

                                                              May 2023: AeroFarms, a Certified B Corporation and a prominent figure in indoor vertical farming took a significant step forward by launching a nationwide expansion through a collaboration with Amazon Fresh. This partnership aims to enhance the high-tech consumer grocery experience. Building on their prior success with Whole Foods Market in 2022, AeroFarms became the first indoor leafy greens grower to be included in Whole Foods Market's Global Planogram, setting an industry precedent.

                                                              9. What pricing options are available for accessing the report?

                                                              Pricing options include single-user, multi-user, and enterprise licenses priced at USD 4750, USD 5250, and USD 8750 respectively.

                                                              10. Is the market size provided in terms of value or volume?

                                                              The market size is provided in terms of value, measured in Million.

                                                              11. Are there any specific market keywords associated with the report?

                                                              Yes, the market keyword associated with the report is "Microgreens Market," which aids in identifying and referencing the specific market segment covered.

                                                              12. How do I determine which pricing option suits my needs best?

                                                              The pricing options vary based on user requirements and access needs. Individual users may opt for single-user licenses, while businesses requiring broader access may choose multi-user or enterprise licenses for cost-effective access to the report.

                                                              13. Are there any additional resources or data provided in the Microgreens Market report?

                                                              While the report offers comprehensive insights, it's advisable to review the specific contents or supplementary materials provided to ascertain if additional resources or data are available.

                                                              14. How can I stay updated on further developments or reports in the Microgreens Market?

                                                              To stay informed about further developments, trends, and reports in the Microgreens Market, consider subscribing to industry newsletters, following relevant companies and organizations, or regularly checking reputable industry news sources and publications.


                                                              Methodology

                                                              Step 1 - Identification of Relevant Samples Size from Population Database

                                                              Step Chart
                                                              Bar Chart
                                                              Method Chart

                                                              Step 2 - Approaches for Defining Global Market Size (Value, Volume* & Price*)

                                                              Approach Chart
                                                              Top-down and bottom-up approaches are used to validate the global market size and estimate the market size for manufactures, regional segments, product, and application.

                                                              Note*: In applicable scenarios

                                                              Step 3 - Data Sources

                                                              Primary Research

                                                              • Web Analytics
                                                              • Survey Reports
                                                              • Research Institute
                                                              • Latest Research Reports
                                                              • Opinion Leaders

                                                              Secondary Research

                                                              • Annual Reports
                                                              • White Paper
                                                              • Latest Press Release
                                                              • Industry Association
                                                              • Paid Database
                                                              • Investor Presentations
                                                              Analyst Chart

                                                              Step 4 - Data Triangulation

                                                              Involves using different sources of information in order to increase the validity of a study

                                                              These sources are likely to be stakeholders in a program - participants, other researchers, program staff, other community members, and so on.

                                                              Then we put all data in single framework & apply various statistical tools to find out the dynamic on the market.

                                                              During the analysis stage, feedback from the stakeholder groups would be compared to determine areas of agreement as well as areas of divergence

                                                              Additionally, after gathering mixed and scattered data from a wide range of sources, data is triangulated and correlated to come up with estimated figures which are further validated through primary mediums or industry experts, opinion leaders.

                                                              About Report Pinnacle

                                                              Report Pinnacle provides top-tier market research, industry intelligence, and actionable insights for finance, technology, healthcare, and consumer sectors. Our reports empower you to make informed decisions and achieve business success.

                                                              Our expert team combines primary research, data analytics, and industry knowledge to deliver insights you can trust. We offer syndicated reports, custom research, and consulting services tailored to your unique business needs.

                                                              At Report Pinnacle, we are committed to quality, transparency, and client satisfaction. Every report is rigorously validated to ensure accuracy and relevance. Our global perspective and local expertise help you understand both broad trends and detailed market shifts.

                                                              Stay ahead with Report Pinnacle. Subscribe to our newsletter for the latest insights and research highlights, and follow us on social media for real-time updates.

                                                              Report Pinnacle – Your Partner for Reaching the Top in Market Intelligence.

                                                              artwork spiralartwork spiralRelated Reports
                                                              artwork underline

                                                              Middle East Vertical Farming Market Market Strategies for the Next Decade: 2025-2033

                                                              Booming Middle East vertical farming market analysis reveals a 14.20% CAGR, driven by water scarcity and urbanization. Explore market size, key players (Madar Farms, Crop One Holdings), segments (aeroponics, hydroponics), and regional insights (UAE, Saudi Arabia) in our comprehensive report covering 2019-2033.

                                                              July 2025
                                                              Base Year: 2024
                                                              No Of Pages: 234
                                                              Price: $4750

                                                              Malaysia Agrochemical Market Unlocking Growth Potential: 2025-2033 Analysis and Forecasts

                                                              Discover the booming Malaysian agrochemical market! Our comprehensive analysis reveals a RM 679.59 million market in 2025, projected to grow at a CAGR of 4.56% until 2033. Explore key drivers, trends, and leading companies shaping this dynamic sector.

                                                              July 2025
                                                              Base Year: 2024
                                                              No Of Pages: 150
                                                              Price: $3800

                                                              Rice Seed Treatment Market Decade Long Trends, Analysis and Forecast 2025-2033

                                                              The global rice seed treatment market is booming, projected to reach \$[estimated 2033 value] million by 2033, driven by rising demand for high-yielding rice and sustainable agriculture. Explore market trends, key players (Bayer, Syngenta, UPL), and regional growth in this comprehensive analysis.

                                                              July 2025
                                                              Base Year: 2024
                                                              No Of Pages: 234
                                                              Price: $4750

                                                              Hydrolyzed Feather Meal Industry Drivers of Growth: Opportunities to 2033

                                                              The hydrolyzed feather meal market is booming, projected to reach [estimated 2033 value based on CAGR] by 2033. Driven by sustainable agriculture and growing animal feed demand, this market offers lucrative opportunities. Learn about market trends, key players, and regional insights.

                                                              July 2025
                                                              Base Year: 2024
                                                              No Of Pages: 234
                                                              Price: $4750

                                                              South America Molluscicides Market Market Outlook and Strategic Insights

                                                              Discover the booming South American molluscicides market! This in-depth analysis reveals key trends, growth drivers, and challenges impacting the $XX million market, segmented by product type (Ferric Phosphate, Metaldehyde, etc.) and application. Learn about leading companies and projected CAGR of 3.50% through 2033.

                                                              July 2025
                                                              Base Year: 2024
                                                              No Of Pages: 150
                                                              Price: $4750

                                                              Asia-Pacific Agricultural Biologicals Market Strategic Insights for 2025 and Forecasts to 2033: Market Trends

                                                              The Asia-Pacific agricultural biologicals market is booming, projected to reach $XX million by 2033 with a 4% CAGR. Driven by sustainable farming trends and government initiatives, this market analysis explores key segments (biopesticides, biofertilizers), regional growth (China, India, Japan), and leading companies. Discover the opportunities and challenges in this dynamic sector.

                                                              July 2025
                                                              Base Year: 2024
                                                              No Of Pages: 197
                                                              Price: $3800

                                                              Exploring France Seed Treatment Market Market Disruption and Innovation

                                                              Discover the booming France seed treatment market! Learn about its €150 million valuation in 2025, 5.60% CAGR, key drivers (biological treatments, precision coating), leading companies (Syngenta, BASF, Semences de France), and future trends in this dynamic agricultural sector. Explore market segmentation and growth projections to 2033.

                                                              July 2025
                                                              Base Year: 2024
                                                              No Of Pages: 197
                                                              Price: $3800

                                                              Brazil Crops Industry Market’s Consumer Preferences: Trends and Analysis 2025-2033

                                                              Discover the booming Brazil crops market! Our analysis reveals a $100.13M (2025) industry projected to grow at a 2.60% CAGR through 2033, driven by soybeans, corn, and biofuels. Learn about key players, market trends, and regional insights.

                                                              July 2025
                                                              Base Year: 2024
                                                              No Of Pages: 197
                                                              Price: $3800

                                                              India Biofertilizer Market Strategic Market Roadmap: Analysis and Forecasts 2025-2033

                                                              Discover the booming India Biofertilizer Market! This in-depth analysis reveals a CAGR of 4% and projects significant growth to 2033, driven by sustainable farming trends and government initiatives. Explore market segments, key players, and regional insights. Learn about the opportunities and challenges shaping this vital sector.

                                                              July 2025
                                                              Base Year: 2024
                                                              No Of Pages: 197
                                                              Price: $3800

                                                              Mexico Seed Treatment Market Insightful Market Analysis: Trends and Opportunities 2025-2033

                                                              Discover the booming Mexico seed treatment market! This comprehensive analysis reveals a $158.20 million market in 2025, projected to grow at a 5.70% CAGR through 2033. Explore key drivers, trends, restraints, and leading companies shaping this dynamic sector. Learn more about market segmentation and growth opportunities in Mexico's agriculture sector.

                                                              July 2025
                                                              Base Year: 2024
                                                              No Of Pages: 197
                                                              Price: $3800

                                                              Exploring Growth Avenues in Europe Blueberry Market Market

                                                              Discover the booming European blueberry market! This in-depth analysis reveals a €8.88 billion market projected to grow at a 6.90% CAGR until 2033, driven by health trends and product diversification. Explore key players, segments, and regional insights.

                                                              July 2025
                                                              Base Year: 2024
                                                              No Of Pages: 180
                                                              Price: $4750

                                                              Germany Fertilizer Market: Competitive Landscape and Growth Trends 2025-2033

                                                              Discover the booming German fertilizer market! This in-depth analysis reveals a CAGR of 15.30% (2025-2033), driven by rising food demands and advanced farming techniques. Explore market segmentation, key players, and regional trends across North Rhine-Westphalia, Bavaria, and other key German states. Get the insights you need for informed decisions.

                                                              July 2025
                                                              Base Year: 2024
                                                              No Of Pages: 180
                                                              Price: $3800

                                                              Biostimulants Market Growth Opportunities and Market Forecast 2025-2033: A Strategic Analysis

                                                              Discover the booming biostimulants market! This in-depth analysis reveals a CAGR of 4.56%, driven by sustainable agriculture and rising food demand. Explore market segments, key players (UPL, Haifa Group, etc.), and regional growth projections (North America, Europe, Asia-Pacific) for 2025-2033. Learn how biostimulants like amino acids and seaweed extracts are transforming crop yields.

                                                              July 2025
                                                              Base Year: 2024
                                                              No Of Pages: 150
                                                              Price: $3800

                                                              South America Quinoa Seeds Industry Strategic Dynamics: Competitor Analysis 2025-2033

                                                              Discover the booming South American quinoa seeds market! This in-depth analysis reveals key trends, growth drivers, leading companies, and regional market shares from 2019-2033. Explore the potential of this lucrative industry with a projected CAGR of 12.50%.

                                                              July 2025
                                                              Base Year: 2024
                                                              No Of Pages: 180
                                                              Price: $4750

                                                              Unlocking Insights for North America Biopesticides Market Growth Strategies

                                                              The North America Biopesticides Market is booming, driven by growing demand for sustainable agriculture and stricter regulations. Discover key trends, market size projections, leading companies, and growth opportunities in this rapidly expanding sector. Explore the market's segmentation by crop type and geographic region to understand the future of biopesticides in North America.

                                                              July 2025
                                                              Base Year: 2024
                                                              No Of Pages: 197
                                                              Price: $3800

                                                              Indonesia Agrochemical Market Consumer Behavior Dynamics: Key Trends 2025-2033

                                                              Discover the booming Indonesian agrochemical market! This in-depth analysis reveals a CAGR of 4.09% through 2033, driven by rising food demand and government initiatives. Explore market size, segmentation, key players (BASF, Syngenta, etc.), and growth challenges. Invest wisely with our data-driven insights.

                                                              July 2025
                                                              Base Year: 2024
                                                              No Of Pages: 150
                                                              Price: $3800

                                                              Charting Insecticides Industry Growth: CAGR Projections for 2025-2033

                                                              The global insecticides market is booming, projected to reach $XX billion by 2033 with a 5.60% CAGR. Driven by food security needs and pest control challenges, this market analysis explores key trends, restraints, and leading companies like FMC, Bayer, and Syngenta, offering insights into application modes, crop types, and regional variations.

                                                              July 2025
                                                              Base Year: 2024
                                                              No Of Pages: 197
                                                              Price: $3800

                                                              US Vertical Farming Market to Grow at XX CAGR: Market Size Analysis and Forecasts 2025-2033

                                                              Discover the booming US vertical farming market! Explore its $3.56 billion (2025) valuation, 10.80% CAGR, key drivers, and leading companies. Learn about market segmentation, regional trends, and future growth projections in hydroponics, aeroponics, and aquaponics.

                                                              July 2025
                                                              Base Year: 2024
                                                              No Of Pages: 150
                                                              Price: $3800

                                                              Europe Agricultural Enzymes Market Strategic Insights: Analysis 2025 and Forecasts 2033

                                                              The European Agricultural Enzymes Market is booming, projected to reach €650 million by 2033 with a 10% CAGR. Driven by sustainable farming and increased food demand, this market analysis explores key trends, segments (crop protection, fertility, etc.), and leading companies like BASF and Novozymes. Discover the growth opportunities in this dynamic sector.

                                                              July 2025
                                                              Base Year: 2024
                                                              No Of Pages: 197
                                                              Price: $3800

                                                              Europe Quinoa Seed Market Analysis 2025 and Forecasts 2033: Unveiling Growth Opportunities

                                                              Discover the booming European quinoa seed market! This comprehensive analysis reveals key trends, growth drivers, and market segmentation from 2019-2033, including insights into major players and projected market value. Explore the rising demand for organic quinoa and its impact on the food and beverage industry.

                                                              July 2025
                                                              Base Year: 2024
                                                              No Of Pages: 180
                                                              Price: $4750

                                                              Business Address

                                                              Head Office

                                                              Office no. A 5010, fifth floor, Solitaire Business Hub, Near Phoenix mall, Pune, Maharashtra 411014

                                                              Contact Information

                                                              Craig Francis

                                                              Business Development Head

                                                              +17162654855

                                                              [email protected]

                                                              Connect With Us

                                                              Secure Payment Partners

                                                              payment image
                                                              RetailLogisticsPackagingAutomotiveHealthcareAgricultureEnergy & PowerFood & BeverageAerospace & DefenseChemicals & MaterialsHospitality and TourismAnimal Nutrition & WellnessConsumer Goods and ServicesReal Estate and ConstructionHome and Property ImprovementTechnology, Media and TelecomManufacturing Products and ServicesFinancial Services and Investment Intelligence

                                                              © 2025 All rights reserved


                                                              Privacy Policy
                                                              Terms and Conditions
                                                              FAQ
                                                              • Home
                                                              • About Us
                                                              • Industries
                                                                • Aerospace & Defense
                                                                • Agriculture
                                                                • Animal Nutrition & Wellness
                                                                • Automotive
                                                                • Chemicals & Materials
                                                                • Consumer Goods and Services
                                                                • Energy & Power
                                                                • Financial Services and Investment Intelligence
                                                                • Food & Beverage
                                                                • Home and Property Improvement
                                                                • Hospitality and Tourism
                                                                • Logistics
                                                                • Manufacturing Products and Services
                                                                • Packaging
                                                                • Professional and Commercial Services
                                                                • Real Estate and Construction
                                                                • Retail
                                                                • Technology, Media and Telecom
                                                                • Healthcare
                                                              • Services
                                                              • Contact
                                                              Main Logo
                                                              • Home
                                                              • About Us
                                                              • Industries
                                                                • Aerospace & Defense
                                                                • Agriculture
                                                                • Animal Nutrition & Wellness
                                                                • Automotive
                                                                • Chemicals & Materials
                                                                • Consumer Goods and Services
                                                                • Energy & Power
                                                                • Financial Services and Investment Intelligence
                                                                • Food & Beverage
                                                                • Home and Property Improvement
                                                                • Hospitality and Tourism
                                                                • Logistics
                                                                • Manufacturing Products and Services
                                                                • Packaging
                                                                • Professional and Commercial Services
                                                                • Real Estate and Construction
                                                                • Retail
                                                                • Technology, Media and Telecom
                                                                • Healthcare
                                                              • Services
                                                              • Contact
                                                              +17162654855
                                                              [email protected]

                                                              +17162654855

                                                              [email protected]