
Key Insights
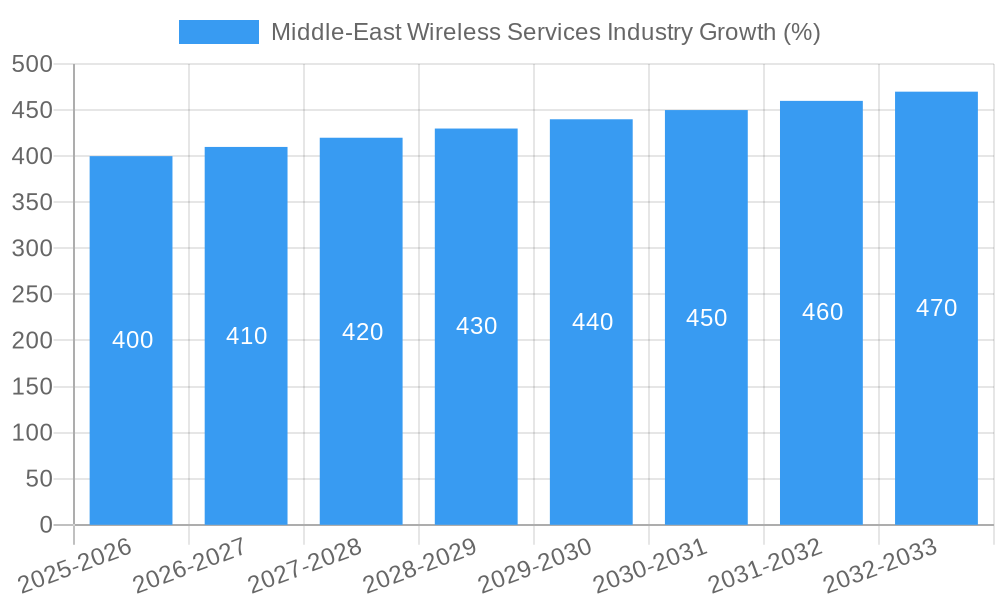
The Middle East wireless services market, while exhibiting a CAGR exceeding 2.62% (mirroring global trends), presents a unique landscape shaped by several key factors. High population density in urban centers, coupled with increasing disposable incomes and smartphone penetration, fuels significant demand for data-centric services. Government initiatives promoting digital transformation and the expansion of 5G networks further accelerate market growth. However, challenges remain. Competition amongst established players is intense, leading to price wars that impact profitability. Furthermore, regulatory hurdles and concerns around data privacy and security can influence market trajectory. The market is segmented based on service type (prepaid, postpaid, mobile broadband), technology (2G, 3G, 4G, 5G), and user demographics (individuals, businesses). Significant regional variations exist, with countries like the UAE and Saudi Arabia leading in market size and technological advancement due to robust infrastructure investments and a high concentration of technology adopters. Conversely, other nations in the region might experience slower growth due to limited infrastructure development or socioeconomic factors. The market’s future growth is strongly correlated with continued investment in 5G infrastructure, the proliferation of IoT devices, and the development of innovative applications and services catering to a digitally-savvy population.
The forecast for the Middle East wireless services market from 2025 to 2033 points to substantial expansion, driven by the factors outlined above. The ongoing digital transformation across various sectors within the region contributes to increased demand for reliable and high-speed mobile connectivity. The emergence of new technologies, such as edge computing and private 5G networks, further expands market opportunities. However, careful consideration must be given to potential limitations such as spectrum scarcity, cybersecurity threats, and ensuring equitable access to wireless services across all socioeconomic groups. Strategic partnerships, technological innovation, and regulatory adjustments are crucial for unlocking the market's full potential and ensuring sustainable growth throughout the forecast period.
Middle-East Wireless Services Industry: A Comprehensive Market Report (2019-2033)
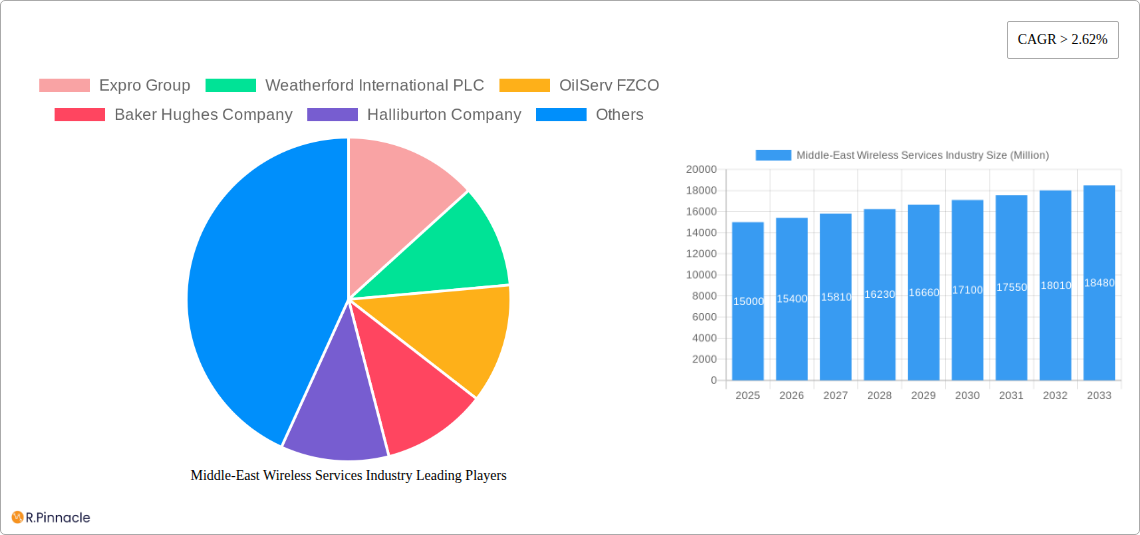
This in-depth report provides a comprehensive analysis of the Middle-East wireless services industry, offering invaluable insights for industry professionals, investors, and strategic decision-makers. The study period covers 2019-2033, with a base year of 2025 and a forecast period of 2025-2033. Key players analyzed include Expro Group, Weatherford International PLC, OilServ FZCO, Baker Hughes Company, Halliburton Company, and Schlumberger Limited. The report utilizes robust data analysis to project market growth and identify key trends across various segments including onshore/offshore deployment, electric line/slick line types, and open hole/cased hole applications.
Middle-East Wireless Services Industry Market Structure & Innovation Trends
This section analyzes the competitive landscape, innovation drivers, and regulatory aspects shaping the Middle-East wireless services market. The market exhibits a moderately concentrated structure, with the top six players holding an estimated xx% market share in 2025. Innovation is driven by advancements in technology, particularly in data acquisition and interpretation, leading to improved efficiency and safety. Regulatory frameworks vary across the region, influencing operational costs and market access. Product substitution is limited due to the specialized nature of services; however, technological advancements present opportunities for alternative service models. M&A activity has been moderate, with deal values averaging USD xx Million in recent years.
- Market Concentration: High, with top 6 players holding xx% market share (2025).
- Innovation Drivers: Technological advancements in data acquisition and processing.
- Regulatory Frameworks: Vary across the region, impacting operational costs.
- M&A Activity: Moderate, with average deal values of USD xx Million.
Middle-East Wireless Services Industry Market Dynamics & Trends
The Middle East wireless services market is projected to experience robust growth, driven by increasing oil & gas exploration and production activities across the region. The Compound Annual Growth Rate (CAGR) is estimated at xx% during the forecast period (2025-2033). Technological disruptions, such as the adoption of digital technologies and automation, are enhancing operational efficiency. Consumer preferences are shifting towards more sophisticated and integrated services that offer improved data quality and faster turnaround times. Competitive dynamics are influenced by pricing strategies, technological capabilities, and customer relationships. Market penetration is high in established oil and gas producing regions, but opportunities exist for expansion into newer areas.
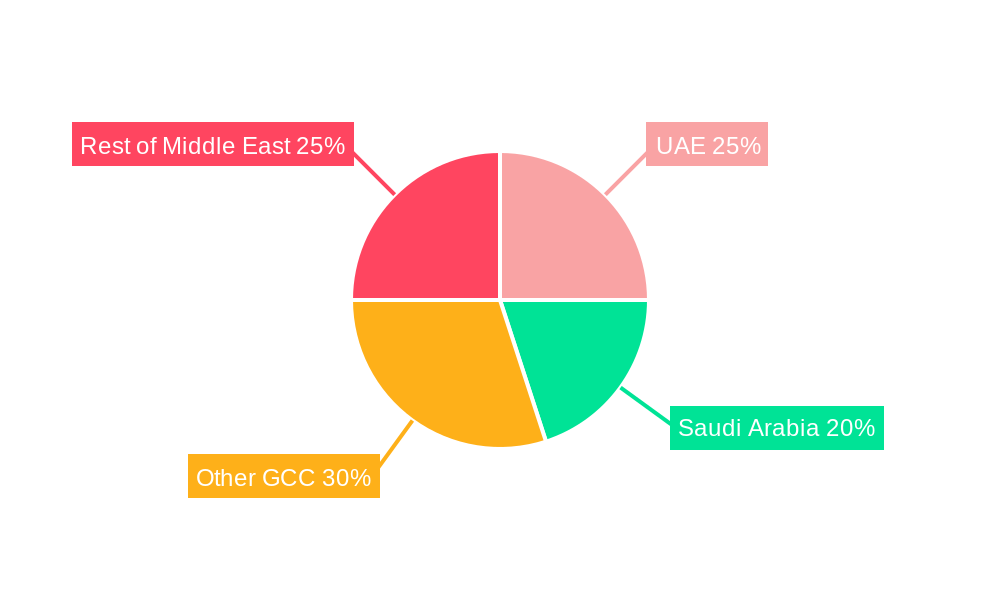
Dominant Regions & Segments in Middle-East Wireless Services Industry
The report identifies Saudi Arabia and the UAE as the dominant regions for wireless services in the Middle East, driven primarily by robust investments in oil and gas infrastructure. The onshore segment currently holds a larger market share than the offshore segment, reflecting the higher concentration of oil and gas extraction activities on land. Electric line services dominate the market due to their versatility and efficiency, followed by slick line services. Cased hole applications account for a larger market share compared to open hole applications due to the higher prevalence of mature oil and gas fields requiring well intervention.
- Key Drivers in Dominant Regions:
- Saudi Arabia: Large-scale oil and gas projects, government investments in infrastructure.
- UAE: Strong oil and gas sector, focus on technological advancements.
- Segmental Dominance:
- Deployment: Onshore (larger market share)
- Type: Electric Line (dominant)
- Hole Type: Cased Hole (dominant)
Middle-East Wireless Services Industry Product Innovations
Recent product developments focus on enhancing data acquisition capabilities, improving operational efficiency, and ensuring safety. This includes the introduction of advanced sensors, real-time data analytics platforms, and robotic systems for remote operations. These innovations cater to the increasing demand for high-quality data and optimized well intervention procedures. Competitive advantages are achieved through technology leadership, superior service quality, and strong customer relationships.
Report Scope & Segmentation Analysis
The report segments the Middle East wireless services market by deployment (onshore, offshore), type (electric line, slick line), and hole type (open hole, cased hole). Each segment is analyzed based on its market size, growth projections, and competitive dynamics. The onshore segment demonstrates substantial growth potential due to ongoing exploration and production activities. The electric line segment is expected to maintain its dominant position owing to its extensive applications. Cased hole operations are anticipated to experience robust growth, driven by well intervention requirements in mature fields.
Key Drivers of Middle-East Wireless Services Industry Growth
The growth of the Middle East wireless services industry is driven by several factors including increasing oil and gas production, rising investments in infrastructure, and technological advancements. The region’s large reserves of hydrocarbons, coupled with government initiatives to boost energy production, are primary drivers of demand. Technological innovations enhance efficiency and safety, while regulatory support fosters industry development.
Challenges in the Middle-East Wireless Services Industry Sector
Challenges include fluctuating oil prices, stringent regulatory requirements, and skilled labor shortages. Fluctuations in oil prices impact investment decisions and project timelines. Stringent safety and environmental regulations add complexity to operations. A shortage of skilled workers leads to competition for labor, impacting operational costs and project delivery times.
Emerging Opportunities in Middle-East Wireless Services Industry
Significant opportunities exist in emerging technologies, such as artificial intelligence and machine learning, for data analysis and process optimization. Expanding into newer oil and gas fields presents growth avenues. Focus on environmentally friendly and sustainable operations offers a competitive edge. Providing integrated services that encompass data acquisition, analysis, and interpretation is also a significant opportunity.
Leading Players in the Middle-East Wireless Services Industry Market
- Expro Group
- Weatherford International PLC
- OilServ FZCO
- Baker Hughes Company
- Halliburton Company
- Schlumberger Limited
Key Developments in Middle-East Wireless Services Industry Industry
- 2021: Zubair Oil Field (Iraq) rehabilitation project launched (USD 18 Billion investment, 4.5 Billion proven reserves, targeting 700,000 barrels/day production).
- 2021: ADNOC announces Hail and Ghasha sour gas field development (1.5 Billion cubic feet/day production target, 18% increase in Abu Dhabi gas production).
Future Outlook for Middle-East Wireless Services Industry Market
The Middle East wireless services market is poised for sustained growth, driven by the continuous expansion of oil and gas activities and technological advancements. Strategic partnerships, mergers and acquisitions, and investments in cutting-edge technologies will shape the industry's future. The focus on efficiency, sustainability, and data-driven decision-making will further drive market expansion.
Middle-East Wireless Services Industry Segmentation
-
1. Deployment
- 1.1. Onshore
- 1.2. Offshore
-
2. Type
- 2.1. Electric Line
- 2.2. Slick Line
-
3. Hole Type
- 3.1. Open Hole
- 3.2. Cased Hole
-
4. Geography
- 4.1. Saudi Arabia
- 4.2. Iran
- 4.3. United Arab Emirates
- 4.4. Rest of Middle-East
Middle-East Wireless Services Industry Segmentation By Geography
- 1. Saudi Arabia
- 2. Iran
- 3. United Arab Emirates
- 4. Rest of Middle East
Middle-East Wireless Services Industry REPORT HIGHLIGHTS
| Aspects | Details |
|---|---|
| Study Period | 2019-2033 |
| Base Year | 2024 |
| Estimated Year | 2025 |
| Forecast Period | 2025-2033 |
| Historical Period | 2019-2024 |
| Growth Rate | CAGR of > 2.62% from 2019-2033 |
| Segmentation |
|
Table of Contents
- 1. Introduction
- 1.1. Research Scope
- 1.2. Market Segmentation
- 1.3. Research Methodology
- 1.4. Definitions and Assumptions
- 2. Executive Summary
- 2.1. Introduction
- 3. Market Dynamics
- 3.1. Introduction
- 3.2. Market Drivers
- 3.2.1. 4.; Increasing Automotive Sales in Saudi Arabia4.; Rising Demand from Heavy Automotives
- 3.3. Market Restrains
- 3.3.1. 4.; Rising Emphasis on Electric Vehicles
- 3.4. Market Trends
- 3.4.1. Offshore to Dominate the Market
- 4. Market Factor Analysis
- 4.1. Porters Five Forces
- 4.2. Supply/Value Chain
- 4.3. PESTEL analysis
- 4.4. Market Entropy
- 4.5. Patent/Trademark Analysis
- 5. Global Middle-East Wireless Services Industry Analysis, Insights and Forecast, 2019-2031
- 5.1. Market Analysis, Insights and Forecast - by Deployment
- 5.1.1. Onshore
- 5.1.2. Offshore
- 5.2. Market Analysis, Insights and Forecast - by Type
- 5.2.1. Electric Line
- 5.2.2. Slick Line
- 5.3. Market Analysis, Insights and Forecast - by Hole Type
- 5.3.1. Open Hole
- 5.3.2. Cased Hole
- 5.4. Market Analysis, Insights and Forecast - by Geography
- 5.4.1. Saudi Arabia
- 5.4.2. Iran
- 5.4.3. United Arab Emirates
- 5.4.4. Rest of Middle-East
- 5.5. Market Analysis, Insights and Forecast - by Region
- 5.5.1. Saudi Arabia
- 5.5.2. Iran
- 5.5.3. United Arab Emirates
- 5.5.4. Rest of Middle East
- 5.1. Market Analysis, Insights and Forecast - by Deployment
- 6. Saudi Arabia Middle-East Wireless Services Industry Analysis, Insights and Forecast, 2019-2031
- 6.1. Market Analysis, Insights and Forecast - by Deployment
- 6.1.1. Onshore
- 6.1.2. Offshore
- 6.2. Market Analysis, Insights and Forecast - by Type
- 6.2.1. Electric Line
- 6.2.2. Slick Line
- 6.3. Market Analysis, Insights and Forecast - by Hole Type
- 6.3.1. Open Hole
- 6.3.2. Cased Hole
- 6.4. Market Analysis, Insights and Forecast - by Geography
- 6.4.1. Saudi Arabia
- 6.4.2. Iran
- 6.4.3. United Arab Emirates
- 6.4.4. Rest of Middle-East
- 6.1. Market Analysis, Insights and Forecast - by Deployment
- 7. Iran Middle-East Wireless Services Industry Analysis, Insights and Forecast, 2019-2031
- 7.1. Market Analysis, Insights and Forecast - by Deployment
- 7.1.1. Onshore
- 7.1.2. Offshore
- 7.2. Market Analysis, Insights and Forecast - by Type
- 7.2.1. Electric Line
- 7.2.2. Slick Line
- 7.3. Market Analysis, Insights and Forecast - by Hole Type
- 7.3.1. Open Hole
- 7.3.2. Cased Hole
- 7.4. Market Analysis, Insights and Forecast - by Geography
- 7.4.1. Saudi Arabia
- 7.4.2. Iran
- 7.4.3. United Arab Emirates
- 7.4.4. Rest of Middle-East
- 7.1. Market Analysis, Insights and Forecast - by Deployment
- 8. United Arab Emirates Middle-East Wireless Services Industry Analysis, Insights and Forecast, 2019-2031
- 8.1. Market Analysis, Insights and Forecast - by Deployment
- 8.1.1. Onshore
- 8.1.2. Offshore
- 8.2. Market Analysis, Insights and Forecast - by Type
- 8.2.1. Electric Line
- 8.2.2. Slick Line
- 8.3. Market Analysis, Insights and Forecast - by Hole Type
- 8.3.1. Open Hole
- 8.3.2. Cased Hole
- 8.4. Market Analysis, Insights and Forecast - by Geography
- 8.4.1. Saudi Arabia
- 8.4.2. Iran
- 8.4.3. United Arab Emirates
- 8.4.4. Rest of Middle-East
- 8.1. Market Analysis, Insights and Forecast - by Deployment
- 9. Rest of Middle East Middle-East Wireless Services Industry Analysis, Insights and Forecast, 2019-2031
- 9.1. Market Analysis, Insights and Forecast - by Deployment
- 9.1.1. Onshore
- 9.1.2. Offshore
- 9.2. Market Analysis, Insights and Forecast - by Type
- 9.2.1. Electric Line
- 9.2.2. Slick Line
- 9.3. Market Analysis, Insights and Forecast - by Hole Type
- 9.3.1. Open Hole
- 9.3.2. Cased Hole
- 9.4. Market Analysis, Insights and Forecast - by Geography
- 9.4.1. Saudi Arabia
- 9.4.2. Iran
- 9.4.3. United Arab Emirates
- 9.4.4. Rest of Middle-East
- 9.1. Market Analysis, Insights and Forecast - by Deployment
- 10. North America Middle-East Wireless Services Industry Analysis, Insights and Forecast, 2019-2031
- 10.1. Market Analysis, Insights and Forecast - By Country/Sub-region
- 10.1.1 United States
- 10.1.2 Canada
- 10.1.3 Mexico
- 11. Europe Middle-East Wireless Services Industry Analysis, Insights and Forecast, 2019-2031
- 11.1. Market Analysis, Insights and Forecast - By Country/Sub-region
- 11.1.1 Germany
- 11.1.2 United Kingdom
- 11.1.3 France
- 11.1.4 Spain
- 11.1.5 Italy
- 11.1.6 Spain
- 11.1.7 Belgium
- 11.1.8 Netherland
- 11.1.9 Nordics
- 11.1.10 Rest of Europe
- 12. Asia Pacific Middle-East Wireless Services Industry Analysis, Insights and Forecast, 2019-2031
- 12.1. Market Analysis, Insights and Forecast - By Country/Sub-region
- 12.1.1 China
- 12.1.2 Japan
- 12.1.3 India
- 12.1.4 South Korea
- 12.1.5 Southeast Asia
- 12.1.6 Australia
- 12.1.7 Indonesia
- 12.1.8 Phillipes
- 12.1.9 Singapore
- 12.1.10 Thailandc
- 12.1.11 Rest of Asia Pacific
- 13. South America Middle-East Wireless Services Industry Analysis, Insights and Forecast, 2019-2031
- 13.1. Market Analysis, Insights and Forecast - By Country/Sub-region
- 13.1.1 Brazil
- 13.1.2 Argentina
- 13.1.3 Peru
- 13.1.4 Chile
- 13.1.5 Colombia
- 13.1.6 Ecuador
- 13.1.7 Venezuela
- 13.1.8 Rest of South America
- 14. MEA Middle-East Wireless Services Industry Analysis, Insights and Forecast, 2019-2031
- 14.1. Market Analysis, Insights and Forecast - By Country/Sub-region
- 14.1.1 United Arab Emirates
- 14.1.2 Saudi Arabia
- 14.1.3 South Africa
- 14.1.4 Rest of Middle East and Africa
- 15. Competitive Analysis
- 15.1. Global Market Share Analysis 2024
- 15.2. Company Profiles
- 15.2.1 Expro Group
- 15.2.1.1. Overview
- 15.2.1.2. Products
- 15.2.1.3. SWOT Analysis
- 15.2.1.4. Recent Developments
- 15.2.1.5. Financials (Based on Availability)
- 15.2.2 Weatherford International PLC
- 15.2.2.1. Overview
- 15.2.2.2. Products
- 15.2.2.3. SWOT Analysis
- 15.2.2.4. Recent Developments
- 15.2.2.5. Financials (Based on Availability)
- 15.2.3 OilServ FZCO
- 15.2.3.1. Overview
- 15.2.3.2. Products
- 15.2.3.3. SWOT Analysis
- 15.2.3.4. Recent Developments
- 15.2.3.5. Financials (Based on Availability)
- 15.2.4 Baker Hughes Company
- 15.2.4.1. Overview
- 15.2.4.2. Products
- 15.2.4.3. SWOT Analysis
- 15.2.4.4. Recent Developments
- 15.2.4.5. Financials (Based on Availability)
- 15.2.5 Halliburton Company
- 15.2.5.1. Overview
- 15.2.5.2. Products
- 15.2.5.3. SWOT Analysis
- 15.2.5.4. Recent Developments
- 15.2.5.5. Financials (Based on Availability)
- 15.2.6 Schlumberger Limited
- 15.2.6.1. Overview
- 15.2.6.2. Products
- 15.2.6.3. SWOT Analysis
- 15.2.6.4. Recent Developments
- 15.2.6.5. Financials (Based on Availability)
- 15.2.1 Expro Group
List of Figures
- Figure 1: Global Middle-East Wireless Services Industry Revenue Breakdown (Million, %) by Region 2024 & 2032
- Figure 2: North America Middle-East Wireless Services Industry Revenue (Million), by Country 2024 & 2032
- Figure 3: North America Middle-East Wireless Services Industry Revenue Share (%), by Country 2024 & 2032
- Figure 4: Europe Middle-East Wireless Services Industry Revenue (Million), by Country 2024 & 2032
- Figure 5: Europe Middle-East Wireless Services Industry Revenue Share (%), by Country 2024 & 2032
- Figure 6: Asia Pacific Middle-East Wireless Services Industry Revenue (Million), by Country 2024 & 2032
- Figure 7: Asia Pacific Middle-East Wireless Services Industry Revenue Share (%), by Country 2024 & 2032
- Figure 8: South America Middle-East Wireless Services Industry Revenue (Million), by Country 2024 & 2032
- Figure 9: South America Middle-East Wireless Services Industry Revenue Share (%), by Country 2024 & 2032
- Figure 10: MEA Middle-East Wireless Services Industry Revenue (Million), by Country 2024 & 2032
- Figure 11: MEA Middle-East Wireless Services Industry Revenue Share (%), by Country 2024 & 2032
- Figure 12: Saudi Arabia Middle-East Wireless Services Industry Revenue (Million), by Deployment 2024 & 2032
- Figure 13: Saudi Arabia Middle-East Wireless Services Industry Revenue Share (%), by Deployment 2024 & 2032
- Figure 14: Saudi Arabia Middle-East Wireless Services Industry Revenue (Million), by Type 2024 & 2032
- Figure 15: Saudi Arabia Middle-East Wireless Services Industry Revenue Share (%), by Type 2024 & 2032
- Figure 16: Saudi Arabia Middle-East Wireless Services Industry Revenue (Million), by Hole Type 2024 & 2032
- Figure 17: Saudi Arabia Middle-East Wireless Services Industry Revenue Share (%), by Hole Type 2024 & 2032
- Figure 18: Saudi Arabia Middle-East Wireless Services Industry Revenue (Million), by Geography 2024 & 2032
- Figure 19: Saudi Arabia Middle-East Wireless Services Industry Revenue Share (%), by Geography 2024 & 2032
- Figure 20: Saudi Arabia Middle-East Wireless Services Industry Revenue (Million), by Country 2024 & 2032
- Figure 21: Saudi Arabia Middle-East Wireless Services Industry Revenue Share (%), by Country 2024 & 2032
- Figure 22: Iran Middle-East Wireless Services Industry Revenue (Million), by Deployment 2024 & 2032
- Figure 23: Iran Middle-East Wireless Services Industry Revenue Share (%), by Deployment 2024 & 2032
- Figure 24: Iran Middle-East Wireless Services Industry Revenue (Million), by Type 2024 & 2032
- Figure 25: Iran Middle-East Wireless Services Industry Revenue Share (%), by Type 2024 & 2032
- Figure 26: Iran Middle-East Wireless Services Industry Revenue (Million), by Hole Type 2024 & 2032
- Figure 27: Iran Middle-East Wireless Services Industry Revenue Share (%), by Hole Type 2024 & 2032
- Figure 28: Iran Middle-East Wireless Services Industry Revenue (Million), by Geography 2024 & 2032
- Figure 29: Iran Middle-East Wireless Services Industry Revenue Share (%), by Geography 2024 & 2032
- Figure 30: Iran Middle-East Wireless Services Industry Revenue (Million), by Country 2024 & 2032
- Figure 31: Iran Middle-East Wireless Services Industry Revenue Share (%), by Country 2024 & 2032
- Figure 32: United Arab Emirates Middle-East Wireless Services Industry Revenue (Million), by Deployment 2024 & 2032
- Figure 33: United Arab Emirates Middle-East Wireless Services Industry Revenue Share (%), by Deployment 2024 & 2032
- Figure 34: United Arab Emirates Middle-East Wireless Services Industry Revenue (Million), by Type 2024 & 2032
- Figure 35: United Arab Emirates Middle-East Wireless Services Industry Revenue Share (%), by Type 2024 & 2032
- Figure 36: United Arab Emirates Middle-East Wireless Services Industry Revenue (Million), by Hole Type 2024 & 2032
- Figure 37: United Arab Emirates Middle-East Wireless Services Industry Revenue Share (%), by Hole Type 2024 & 2032
- Figure 38: United Arab Emirates Middle-East Wireless Services Industry Revenue (Million), by Geography 2024 & 2032
- Figure 39: United Arab Emirates Middle-East Wireless Services Industry Revenue Share (%), by Geography 2024 & 2032
- Figure 40: United Arab Emirates Middle-East Wireless Services Industry Revenue (Million), by Country 2024 & 2032
- Figure 41: United Arab Emirates Middle-East Wireless Services Industry Revenue Share (%), by Country 2024 & 2032
- Figure 42: Rest of Middle East Middle-East Wireless Services Industry Revenue (Million), by Deployment 2024 & 2032
- Figure 43: Rest of Middle East Middle-East Wireless Services Industry Revenue Share (%), by Deployment 2024 & 2032
- Figure 44: Rest of Middle East Middle-East Wireless Services Industry Revenue (Million), by Type 2024 & 2032
- Figure 45: Rest of Middle East Middle-East Wireless Services Industry Revenue Share (%), by Type 2024 & 2032
- Figure 46: Rest of Middle East Middle-East Wireless Services Industry Revenue (Million), by Hole Type 2024 & 2032
- Figure 47: Rest of Middle East Middle-East Wireless Services Industry Revenue Share (%), by Hole Type 2024 & 2032
- Figure 48: Rest of Middle East Middle-East Wireless Services Industry Revenue (Million), by Geography 2024 & 2032
- Figure 49: Rest of Middle East Middle-East Wireless Services Industry Revenue Share (%), by Geography 2024 & 2032
- Figure 50: Rest of Middle East Middle-East Wireless Services Industry Revenue (Million), by Country 2024 & 2032
- Figure 51: Rest of Middle East Middle-East Wireless Services Industry Revenue Share (%), by Country 2024 & 2032
List of Tables
- Table 1: Global Middle-East Wireless Services Industry Revenue Million Forecast, by Region 2019 & 2032
- Table 2: Global Middle-East Wireless Services Industry Revenue Million Forecast, by Deployment 2019 & 2032
- Table 3: Global Middle-East Wireless Services Industry Revenue Million Forecast, by Type 2019 & 2032
- Table 4: Global Middle-East Wireless Services Industry Revenue Million Forecast, by Hole Type 2019 & 2032
- Table 5: Global Middle-East Wireless Services Industry Revenue Million Forecast, by Geography 2019 & 2032
- Table 6: Global Middle-East Wireless Services Industry Revenue Million Forecast, by Region 2019 & 2032
- Table 7: Global Middle-East Wireless Services Industry Revenue Million Forecast, by Country 2019 & 2032
- Table 8: United States Middle-East Wireless Services Industry Revenue (Million) Forecast, by Application 2019 & 2032
- Table 9: Canada Middle-East Wireless Services Industry Revenue (Million) Forecast, by Application 2019 & 2032
- Table 10: Mexico Middle-East Wireless Services Industry Revenue (Million) Forecast, by Application 2019 & 2032
- Table 11: Global Middle-East Wireless Services Industry Revenue Million Forecast, by Country 2019 & 2032
- Table 12: Germany Middle-East Wireless Services Industry Revenue (Million) Forecast, by Application 2019 & 2032
- Table 13: United Kingdom Middle-East Wireless Services Industry Revenue (Million) Forecast, by Application 2019 & 2032
- Table 14: France Middle-East Wireless Services Industry Revenue (Million) Forecast, by Application 2019 & 2032
- Table 15: Spain Middle-East Wireless Services Industry Revenue (Million) Forecast, by Application 2019 & 2032
- Table 16: Italy Middle-East Wireless Services Industry Revenue (Million) Forecast, by Application 2019 & 2032
- Table 17: Spain Middle-East Wireless Services Industry Revenue (Million) Forecast, by Application 2019 & 2032
- Table 18: Belgium Middle-East Wireless Services Industry Revenue (Million) Forecast, by Application 2019 & 2032
- Table 19: Netherland Middle-East Wireless Services Industry Revenue (Million) Forecast, by Application 2019 & 2032
- Table 20: Nordics Middle-East Wireless Services Industry Revenue (Million) Forecast, by Application 2019 & 2032
- Table 21: Rest of Europe Middle-East Wireless Services Industry Revenue (Million) Forecast, by Application 2019 & 2032
- Table 22: Global Middle-East Wireless Services Industry Revenue Million Forecast, by Country 2019 & 2032
- Table 23: China Middle-East Wireless Services Industry Revenue (Million) Forecast, by Application 2019 & 2032
- Table 24: Japan Middle-East Wireless Services Industry Revenue (Million) Forecast, by Application 2019 & 2032
- Table 25: India Middle-East Wireless Services Industry Revenue (Million) Forecast, by Application 2019 & 2032
- Table 26: South Korea Middle-East Wireless Services Industry Revenue (Million) Forecast, by Application 2019 & 2032
- Table 27: Southeast Asia Middle-East Wireless Services Industry Revenue (Million) Forecast, by Application 2019 & 2032
- Table 28: Australia Middle-East Wireless Services Industry Revenue (Million) Forecast, by Application 2019 & 2032
- Table 29: Indonesia Middle-East Wireless Services Industry Revenue (Million) Forecast, by Application 2019 & 2032
- Table 30: Phillipes Middle-East Wireless Services Industry Revenue (Million) Forecast, by Application 2019 & 2032
- Table 31: Singapore Middle-East Wireless Services Industry Revenue (Million) Forecast, by Application 2019 & 2032
- Table 32: Thailandc Middle-East Wireless Services Industry Revenue (Million) Forecast, by Application 2019 & 2032
- Table 33: Rest of Asia Pacific Middle-East Wireless Services Industry Revenue (Million) Forecast, by Application 2019 & 2032
- Table 34: Global Middle-East Wireless Services Industry Revenue Million Forecast, by Country 2019 & 2032
- Table 35: Brazil Middle-East Wireless Services Industry Revenue (Million) Forecast, by Application 2019 & 2032
- Table 36: Argentina Middle-East Wireless Services Industry Revenue (Million) Forecast, by Application 2019 & 2032
- Table 37: Peru Middle-East Wireless Services Industry Revenue (Million) Forecast, by Application 2019 & 2032
- Table 38: Chile Middle-East Wireless Services Industry Revenue (Million) Forecast, by Application 2019 & 2032
- Table 39: Colombia Middle-East Wireless Services Industry Revenue (Million) Forecast, by Application 2019 & 2032
- Table 40: Ecuador Middle-East Wireless Services Industry Revenue (Million) Forecast, by Application 2019 & 2032
- Table 41: Venezuela Middle-East Wireless Services Industry Revenue (Million) Forecast, by Application 2019 & 2032
- Table 42: Rest of South America Middle-East Wireless Services Industry Revenue (Million) Forecast, by Application 2019 & 2032
- Table 43: Global Middle-East Wireless Services Industry Revenue Million Forecast, by Country 2019 & 2032
- Table 44: United Arab Emirates Middle-East Wireless Services Industry Revenue (Million) Forecast, by Application 2019 & 2032
- Table 45: Saudi Arabia Middle-East Wireless Services Industry Revenue (Million) Forecast, by Application 2019 & 2032
- Table 46: South Africa Middle-East Wireless Services Industry Revenue (Million) Forecast, by Application 2019 & 2032
- Table 47: Rest of Middle East and Africa Middle-East Wireless Services Industry Revenue (Million) Forecast, by Application 2019 & 2032
- Table 48: Global Middle-East Wireless Services Industry Revenue Million Forecast, by Deployment 2019 & 2032
- Table 49: Global Middle-East Wireless Services Industry Revenue Million Forecast, by Type 2019 & 2032
- Table 50: Global Middle-East Wireless Services Industry Revenue Million Forecast, by Hole Type 2019 & 2032
- Table 51: Global Middle-East Wireless Services Industry Revenue Million Forecast, by Geography 2019 & 2032
- Table 52: Global Middle-East Wireless Services Industry Revenue Million Forecast, by Country 2019 & 2032
- Table 53: Global Middle-East Wireless Services Industry Revenue Million Forecast, by Deployment 2019 & 2032
- Table 54: Global Middle-East Wireless Services Industry Revenue Million Forecast, by Type 2019 & 2032
- Table 55: Global Middle-East Wireless Services Industry Revenue Million Forecast, by Hole Type 2019 & 2032
- Table 56: Global Middle-East Wireless Services Industry Revenue Million Forecast, by Geography 2019 & 2032
- Table 57: Global Middle-East Wireless Services Industry Revenue Million Forecast, by Country 2019 & 2032
- Table 58: Global Middle-East Wireless Services Industry Revenue Million Forecast, by Deployment 2019 & 2032
- Table 59: Global Middle-East Wireless Services Industry Revenue Million Forecast, by Type 2019 & 2032
- Table 60: Global Middle-East Wireless Services Industry Revenue Million Forecast, by Hole Type 2019 & 2032
- Table 61: Global Middle-East Wireless Services Industry Revenue Million Forecast, by Geography 2019 & 2032
- Table 62: Global Middle-East Wireless Services Industry Revenue Million Forecast, by Country 2019 & 2032
- Table 63: Global Middle-East Wireless Services Industry Revenue Million Forecast, by Deployment 2019 & 2032
- Table 64: Global Middle-East Wireless Services Industry Revenue Million Forecast, by Type 2019 & 2032
- Table 65: Global Middle-East Wireless Services Industry Revenue Million Forecast, by Hole Type 2019 & 2032
- Table 66: Global Middle-East Wireless Services Industry Revenue Million Forecast, by Geography 2019 & 2032
- Table 67: Global Middle-East Wireless Services Industry Revenue Million Forecast, by Country 2019 & 2032
Frequently Asked Questions
1. What is the projected Compound Annual Growth Rate (CAGR) of the Middle-East Wireless Services Industry?
The projected CAGR is approximately > 2.62%.
2. Which companies are prominent players in the Middle-East Wireless Services Industry?
Key companies in the market include Expro Group, Weatherford International PLC, OilServ FZCO, Baker Hughes Company, Halliburton Company, Schlumberger Limited.
3. What are the main segments of the Middle-East Wireless Services Industry?
The market segments include Deployment, Type, Hole Type, Geography.
4. Can you provide details about the market size?
The market size is estimated to be USD XX Million as of 2022.
5. What are some drivers contributing to market growth?
4.; Increasing Automotive Sales in Saudi Arabia4.; Rising Demand from Heavy Automotives.
6. What are the notable trends driving market growth?
Offshore to Dominate the Market.
7. Are there any restraints impacting market growth?
4.; Rising Emphasis on Electric Vehicles.
8. Can you provide examples of recent developments in the market?
In 2021, Zubair Oil Field in Iraq entered the rehabilitation and enhanced re-development phase for the cost of USD 18 billion, and the field has 4.5 billion of proven reserves. The project is aimed to increase the production to the plateau of 700,000 barrels per day.
9. What pricing options are available for accessing the report?
Pricing options include single-user, multi-user, and enterprise licenses priced at USD 4750, USD 5250, and USD 8750 respectively.
10. Is the market size provided in terms of value or volume?
The market size is provided in terms of value, measured in Million.
11. Are there any specific market keywords associated with the report?
Yes, the market keyword associated with the report is "Middle-East Wireless Services Industry," which aids in identifying and referencing the specific market segment covered.
12. How do I determine which pricing option suits my needs best?
The pricing options vary based on user requirements and access needs. Individual users may opt for single-user licenses, while businesses requiring broader access may choose multi-user or enterprise licenses for cost-effective access to the report.
13. Are there any additional resources or data provided in the Middle-East Wireless Services Industry report?
While the report offers comprehensive insights, it's advisable to review the specific contents or supplementary materials provided to ascertain if additional resources or data are available.
14. How can I stay updated on further developments or reports in the Middle-East Wireless Services Industry?
To stay informed about further developments, trends, and reports in the Middle-East Wireless Services Industry, consider subscribing to industry newsletters, following relevant companies and organizations, or regularly checking reputable industry news sources and publications.
Methodology
Step 1 - Identification of Relevant Samples Size from Population Database


Step 2 - Approaches for Defining Global Market Size (Value, Volume* & Price*)

Note*: In applicable scenarios
Step 3 - Data Sources
Primary Research
- Web Analytics
- Survey Reports
- Research Institute
- Latest Research Reports
- Opinion Leaders
Secondary Research
- Annual Reports
- White Paper
- Latest Press Release
- Industry Association
- Paid Database
- Investor Presentations

Step 4 - Data Triangulation
Involves using different sources of information in order to increase the validity of a study
These sources are likely to be stakeholders in a program - participants, other researchers, program staff, other community members, and so on.
Then we put all data in single framework & apply various statistical tools to find out the dynamic on the market.
During the analysis stage, feedback from the stakeholder groups would be compared to determine areas of agreement as well as areas of divergence


