
Key Insights
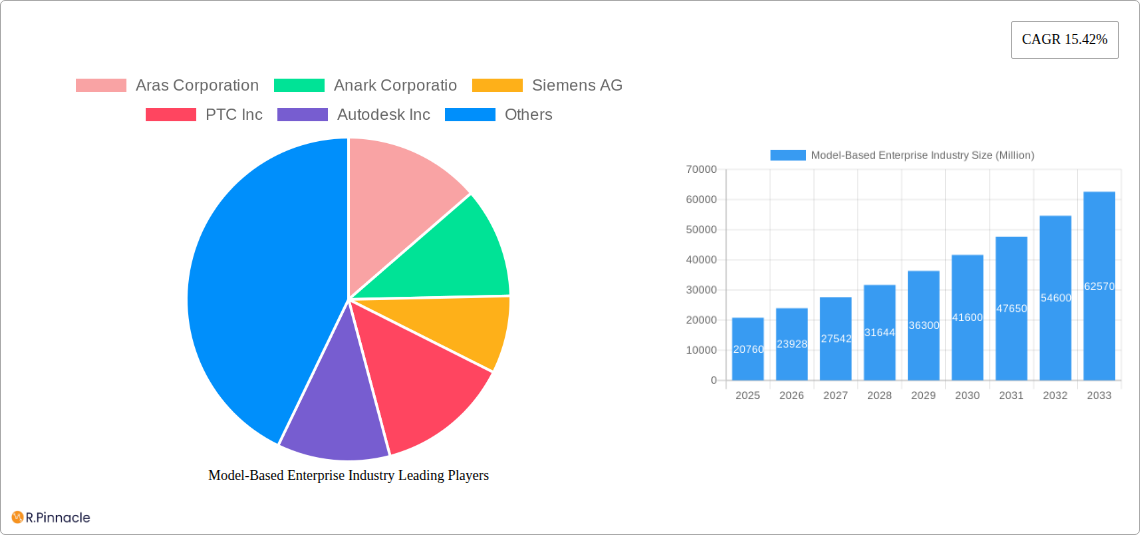
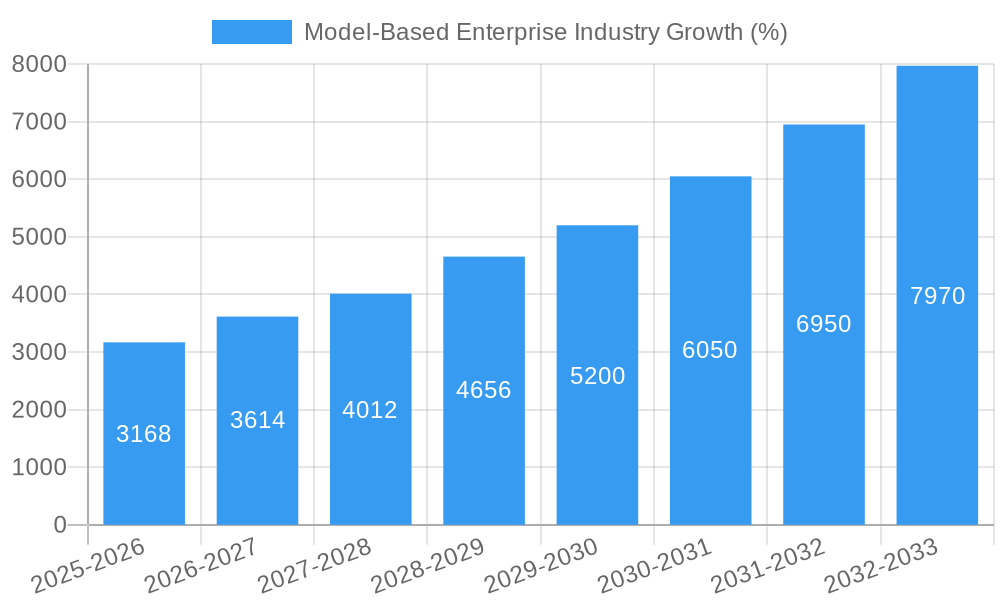
The Model-Based Enterprise (MBE) market is experiencing robust growth, projected to reach $20.76 billion in 2025 and exhibiting a Compound Annual Growth Rate (CAGR) of 15.42% from 2025 to 2033. This expansion is driven by several factors. Increasing adoption of digital transformation initiatives across diverse industries like aerospace and defense, automotive, and construction is fueling demand for MBE solutions. The shift towards cloud-based deployment models offers scalability and cost-effectiveness, further accelerating market growth. Furthermore, the rising complexity of products and the need for improved collaboration across engineering teams are key drivers. Companies are increasingly recognizing the benefits of MBE in reducing development time, improving product quality, and minimizing errors, leading to higher ROI. The market is segmented by offering (solutions and services), deployment mode (on-premise and cloud), and end-user industries. While the cloud deployment model is expected to dominate due to its inherent advantages, the on-premise segment will remain relevant for businesses with stringent data security requirements. The aerospace and defense sector is anticipated to hold a significant market share, given the critical nature of product reliability and the high regulatory compliance needed.
Despite the positive outlook, challenges remain. High initial investment costs for implementing MBE solutions can be a barrier for entry for smaller businesses. Furthermore, the integration of MBE with legacy systems can pose technical complexities and require significant expertise. However, the long-term benefits in terms of improved efficiency and reduced costs are likely to outweigh these challenges, fostering continued market growth. The competitive landscape is populated by both established players like Siemens AG, Dassault Systèmes SE, and PTC Inc., as well as emerging technology providers. This competitive dynamic is likely to drive innovation and enhance the availability of cost-effective MBE solutions, further expanding market reach. Strong partnerships between software providers and industry consultants will be critical in providing end-to-end support and facilitating seamless MBE implementation across diverse business environments.
Model-Based Enterprise (MBE) Industry Report: 2019-2033 Forecast
This comprehensive report provides a detailed analysis of the Model-Based Enterprise (MBE) industry, offering invaluable insights for industry professionals, investors, and strategic decision-makers. With a study period spanning 2019-2033, a base year of 2025, and a forecast period of 2025-2033, this report leverages extensive market research to provide actionable intelligence and future-proof your business strategies. The market is projected to reach $XX Million by 2033, exhibiting a robust CAGR of XX% during the forecast period.
Model-Based Enterprise Industry Market Structure & Innovation Trends
The MBE market is characterized by a moderately concentrated landscape, with key players like Aras Corporation, Anark Corporation, Siemens AG, PTC Inc, Autodesk Inc, Oracle Corporation, Dassault Systèmes SE, General Electric Company, HCL Technologies Limited, and SAP SE holding significant market share. In 2024, the combined market share of the top 5 players was estimated at XX%. Innovation is driven by the increasing need for digital transformation across various industries, coupled with advancements in AI, IoT, and cloud computing. Regulatory frameworks, such as data privacy regulations, play a crucial role in shaping market dynamics. M&A activity has been significant, with deals exceeding $XX Million in value over the historical period, primarily focused on expanding capabilities and market reach. For example, the recent acquisition of SBS Group by Agacad (May 2023) exemplifies this trend.
- Market Concentration: High (top 5 players hold XX% market share in 2024)
- Innovation Drivers: AI, IoT, Cloud Computing, Digital Transformation
- Regulatory Frameworks: GDPR, CCPA, industry-specific regulations
- M&A Activity: $XX Million+ in deals (2019-2024)
Model-Based Enterprise Industry Market Dynamics & Trends
The MBE market is experiencing significant growth, driven by the rising adoption of digital twin technology, the increasing demand for improved product development processes, and the need for enhanced collaboration across the extended enterprise. Technological disruptions, such as the emergence of advanced simulation and analytics capabilities, are reshaping the competitive landscape. Consumer preferences are shifting towards more agile and integrated solutions, leading to a greater focus on cloud-based deployments and platform-based offerings. The competitive dynamics are intense, with companies investing heavily in R&D and strategic partnerships to maintain a competitive edge.
Dominant Regions & Segments in Model-Based Enterprise Industry
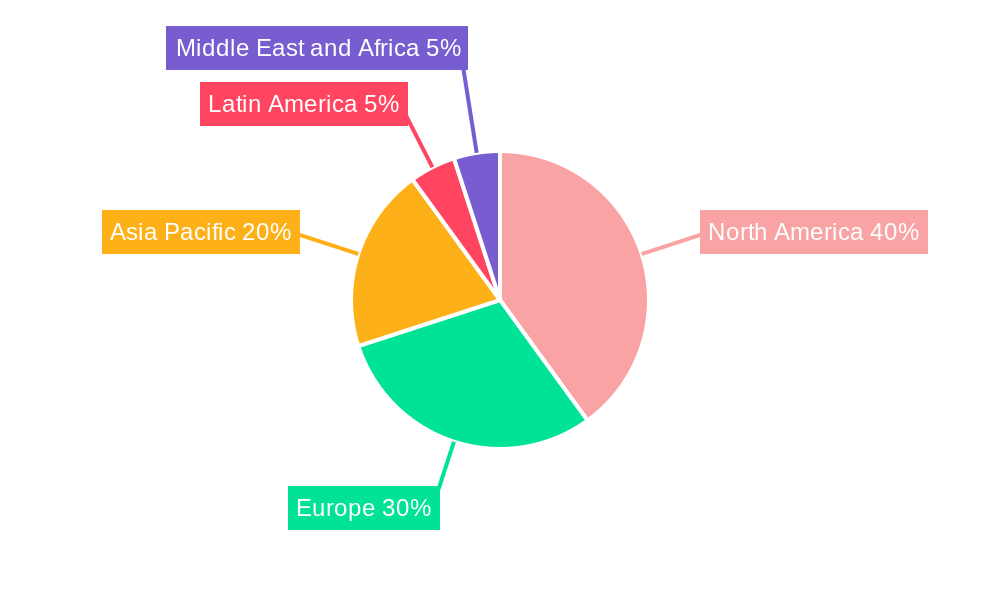
North America currently holds the largest market share in the MBE industry, driven by strong technological advancements and a high concentration of key players. Within segments:
By Offering: Solutions segment dominates, accounting for XX% of the market in 2025, with strong growth expected in services.
By Deployment Mode: Cloud deployments are rapidly gaining traction, with a projected market share of XX% by 2033.
By End-User: The Aerospace & Defense and Automotive sectors are the largest contributors, driven by stringent regulatory compliance needs and the complexity of their products.
Key Drivers (North America): Strong R&D investment, established technology infrastructure, early adoption of MBE principles.
Key Drivers (Europe): Growing focus on digitalization initiatives across industries, supportive government policies.
Key Drivers (Asia-Pacific): Rising manufacturing activity, increasing investment in advanced technologies.
Model-Based Enterprise Industry Product Innovations
Recent innovations in MBE software focus on enhancing interoperability, improving simulation capabilities, and integrating AI/ML functionalities for better decision-making. New applications are emerging in areas such as predictive maintenance, digital twin development, and supply chain optimization. These advancements provide competitive advantages by enabling faster product development cycles, reduced costs, and enhanced product quality.
Report Scope & Segmentation Analysis
This report covers the MBE market across various segments:
- By Offering: Solutions and Services – The Solutions segment is projected to grow at a CAGR of XX% during the forecast period.
- By Deployment Mode: On-premise and Cloud – Cloud deployment is expected to exhibit higher growth due to its scalability and cost-effectiveness.
- By End-User: Aerospace & Defense, Automotive, Construction, Power & Energy, Retail, and Other End-Users – Aerospace & Defense and Automotive are expected to remain the leading segments.
Each segment’s analysis includes growth projections, market size estimates, and a competitive landscape overview.
Key Drivers of Model-Based Enterprise Industry Growth
Several factors contribute to the growth of the MBE industry: The increasing complexity of products and systems necessitates the adoption of MBE principles for efficient development and management. Furthermore, the rising demand for improved collaboration across different teams and stakeholders is driving the adoption of collaborative MBE platforms. Government regulations mandating digitalization in various sectors also contribute significantly.
Challenges in the Model-Based Enterprise Industry Sector
Challenges include the high initial investment costs associated with implementing MBE solutions, the need for skilled professionals to manage and utilize these technologies, and the complexities associated with integrating MBE solutions with legacy systems. The competition among established players, coupled with the entry of new technologies, adds further pressure. These factors collectively contribute to a projected impact of a XX% reduction in market penetration if not addressed efficiently.
Emerging Opportunities in Model-Based Enterprise Industry
Emerging opportunities include the integration of AI and Machine Learning into MBE platforms to enhance predictive capabilities and improve decision-making. The expanding adoption of the Industrial Internet of Things (IIoT) and digital twin technology opens up new avenues for MBE solutions in areas such as predictive maintenance and remote asset monitoring. The expansion into new sectors, such as healthcare and smart cities, also represents a substantial growth potential.
Leading Players in the Model-Based Enterprise Industry Market
- Aras Corporation
- Anark Corporation
- Siemens AG
- PTC Inc
- Autodesk Inc
- Oracle Corporation
- Dassault Systèmes SE
- General Electric Company
- HCL Technologies Limited
- SAP SE
Key Developments in Model-Based Enterprise Industry Industry
- September 2023: Tech Soft 3D launched iBase-t, integrating HOOPS Exchange for simplified product development and maintenance. This enhances the capabilities of existing MBE solutions.
- May 2023: Agacad's acquisition of SBS Group expanded its BIM offerings, adding time and cost management tools crucial for construction and engineering projects. This strengthens their market position in the MBE segment for the construction industry.
Future Outlook for Model-Based Enterprise Industry Market
The future of the MBE industry is bright, driven by continued technological advancements, increasing demand for digital transformation, and the emergence of new applications across diverse sectors. Strategic partnerships, acquisitions, and investments in R&D will be crucial for companies to maintain a competitive edge and capitalize on the significant growth opportunities. The market is poised for substantial growth, propelled by the escalating adoption of advanced technologies and the rising need for optimized product development and lifecycle management.
Model-Based Enterprise Industry Segmentation
-
1. Offering
- 1.1. Solutions
- 1.2. Services
-
2. Deployment Mode
- 2.1. On-premise
- 2.2. Cloud
-
3. End User
- 3.1. Aerospace and Defense
- 3.2. Automotive
- 3.3. Construction
- 3.4. Power and Energy
- 3.5. Retail
- 3.6. Other End Users
Model-Based Enterprise Industry Segmentation By Geography
- 1. North America
- 2. Europe
- 3. Asia Pacific
- 4. Latin America
- 5. Middle East and Africa
Model-Based Enterprise Industry REPORT HIGHLIGHTS
| Aspects | Details |
|---|---|
| Study Period | 2019-2033 |
| Base Year | 2024 |
| Estimated Year | 2025 |
| Forecast Period | 2025-2033 |
| Historical Period | 2019-2024 |
| Growth Rate | CAGR of 15.42% from 2019-2033 |
| Segmentation |
|
Table of Contents
- 1. Introduction
- 1.1. Research Scope
- 1.2. Market Segmentation
- 1.3. Research Methodology
- 1.4. Definitions and Assumptions
- 2. Executive Summary
- 2.1. Introduction
- 3. Market Dynamics
- 3.1. Introduction
- 3.2. Market Drivers
- 3.2.1. Evolving Software Capabilities; Rising Adoption of IoT and Cloud-based Platforms
- 3.3. Market Restrains
- 3.3.1 Shortage of Skilled Workers
- 3.3.2 Data Security Concerns
- 3.3.3 and the Initial Investment Costs Hinder Business Operations
- 3.4. Market Trends
- 3.4.1. Automotive Sector to Witness Major Growth
- 4. Market Factor Analysis
- 4.1. Porters Five Forces
- 4.2. Supply/Value Chain
- 4.3. PESTEL analysis
- 4.4. Market Entropy
- 4.5. Patent/Trademark Analysis
- 5. Global Model-Based Enterprise Industry Analysis, Insights and Forecast, 2019-2031
- 5.1. Market Analysis, Insights and Forecast - by Offering
- 5.1.1. Solutions
- 5.1.2. Services
- 5.2. Market Analysis, Insights and Forecast - by Deployment Mode
- 5.2.1. On-premise
- 5.2.2. Cloud
- 5.3. Market Analysis, Insights and Forecast - by End User
- 5.3.1. Aerospace and Defense
- 5.3.2. Automotive
- 5.3.3. Construction
- 5.3.4. Power and Energy
- 5.3.5. Retail
- 5.3.6. Other End Users
- 5.4. Market Analysis, Insights and Forecast - by Region
- 5.4.1. North America
- 5.4.2. Europe
- 5.4.3. Asia Pacific
- 5.4.4. Latin America
- 5.4.5. Middle East and Africa
- 5.1. Market Analysis, Insights and Forecast - by Offering
- 6. North America Model-Based Enterprise Industry Analysis, Insights and Forecast, 2019-2031
- 6.1. Market Analysis, Insights and Forecast - by Offering
- 6.1.1. Solutions
- 6.1.2. Services
- 6.2. Market Analysis, Insights and Forecast - by Deployment Mode
- 6.2.1. On-premise
- 6.2.2. Cloud
- 6.3. Market Analysis, Insights and Forecast - by End User
- 6.3.1. Aerospace and Defense
- 6.3.2. Automotive
- 6.3.3. Construction
- 6.3.4. Power and Energy
- 6.3.5. Retail
- 6.3.6. Other End Users
- 6.1. Market Analysis, Insights and Forecast - by Offering
- 7. Europe Model-Based Enterprise Industry Analysis, Insights and Forecast, 2019-2031
- 7.1. Market Analysis, Insights and Forecast - by Offering
- 7.1.1. Solutions
- 7.1.2. Services
- 7.2. Market Analysis, Insights and Forecast - by Deployment Mode
- 7.2.1. On-premise
- 7.2.2. Cloud
- 7.3. Market Analysis, Insights and Forecast - by End User
- 7.3.1. Aerospace and Defense
- 7.3.2. Automotive
- 7.3.3. Construction
- 7.3.4. Power and Energy
- 7.3.5. Retail
- 7.3.6. Other End Users
- 7.1. Market Analysis, Insights and Forecast - by Offering
- 8. Asia Pacific Model-Based Enterprise Industry Analysis, Insights and Forecast, 2019-2031
- 8.1. Market Analysis, Insights and Forecast - by Offering
- 8.1.1. Solutions
- 8.1.2. Services
- 8.2. Market Analysis, Insights and Forecast - by Deployment Mode
- 8.2.1. On-premise
- 8.2.2. Cloud
- 8.3. Market Analysis, Insights and Forecast - by End User
- 8.3.1. Aerospace and Defense
- 8.3.2. Automotive
- 8.3.3. Construction
- 8.3.4. Power and Energy
- 8.3.5. Retail
- 8.3.6. Other End Users
- 8.1. Market Analysis, Insights and Forecast - by Offering
- 9. Latin America Model-Based Enterprise Industry Analysis, Insights and Forecast, 2019-2031
- 9.1. Market Analysis, Insights and Forecast - by Offering
- 9.1.1. Solutions
- 9.1.2. Services
- 9.2. Market Analysis, Insights and Forecast - by Deployment Mode
- 9.2.1. On-premise
- 9.2.2. Cloud
- 9.3. Market Analysis, Insights and Forecast - by End User
- 9.3.1. Aerospace and Defense
- 9.3.2. Automotive
- 9.3.3. Construction
- 9.3.4. Power and Energy
- 9.3.5. Retail
- 9.3.6. Other End Users
- 9.1. Market Analysis, Insights and Forecast - by Offering
- 10. Middle East and Africa Model-Based Enterprise Industry Analysis, Insights and Forecast, 2019-2031
- 10.1. Market Analysis, Insights and Forecast - by Offering
- 10.1.1. Solutions
- 10.1.2. Services
- 10.2. Market Analysis, Insights and Forecast - by Deployment Mode
- 10.2.1. On-premise
- 10.2.2. Cloud
- 10.3. Market Analysis, Insights and Forecast - by End User
- 10.3.1. Aerospace and Defense
- 10.3.2. Automotive
- 10.3.3. Construction
- 10.3.4. Power and Energy
- 10.3.5. Retail
- 10.3.6. Other End Users
- 10.1. Market Analysis, Insights and Forecast - by Offering
- 11. North America Model-Based Enterprise Industry Analysis, Insights and Forecast, 2019-2031
- 11.1. Market Analysis, Insights and Forecast - By Country/Sub-region
- 11.1.1.
- 12. Europe Model-Based Enterprise Industry Analysis, Insights and Forecast, 2019-2031
- 12.1. Market Analysis, Insights and Forecast - By Country/Sub-region
- 12.1.1.
- 13. Asia Pacific Model-Based Enterprise Industry Analysis, Insights and Forecast, 2019-2031
- 13.1. Market Analysis, Insights and Forecast - By Country/Sub-region
- 13.1.1.
- 14. Latin America Model-Based Enterprise Industry Analysis, Insights and Forecast, 2019-2031
- 14.1. Market Analysis, Insights and Forecast - By Country/Sub-region
- 14.1.1.
- 15. Middle East and Africa Model-Based Enterprise Industry Analysis, Insights and Forecast, 2019-2031
- 15.1. Market Analysis, Insights and Forecast - By Country/Sub-region
- 15.1.1.
- 16. Competitive Analysis
- 16.1. Global Market Share Analysis 2024
- 16.2. Company Profiles
- 16.2.1 Aras Corporation
- 16.2.1.1. Overview
- 16.2.1.2. Products
- 16.2.1.3. SWOT Analysis
- 16.2.1.4. Recent Developments
- 16.2.1.5. Financials (Based on Availability)
- 16.2.2 Anark Corporatio
- 16.2.2.1. Overview
- 16.2.2.2. Products
- 16.2.2.3. SWOT Analysis
- 16.2.2.4. Recent Developments
- 16.2.2.5. Financials (Based on Availability)
- 16.2.3 Siemens AG
- 16.2.3.1. Overview
- 16.2.3.2. Products
- 16.2.3.3. SWOT Analysis
- 16.2.3.4. Recent Developments
- 16.2.3.5. Financials (Based on Availability)
- 16.2.4 PTC Inc
- 16.2.4.1. Overview
- 16.2.4.2. Products
- 16.2.4.3. SWOT Analysis
- 16.2.4.4. Recent Developments
- 16.2.4.5. Financials (Based on Availability)
- 16.2.5 Autodesk Inc
- 16.2.5.1. Overview
- 16.2.5.2. Products
- 16.2.5.3. SWOT Analysis
- 16.2.5.4. Recent Developments
- 16.2.5.5. Financials (Based on Availability)
- 16.2.6 Oracle Corporation
- 16.2.6.1. Overview
- 16.2.6.2. Products
- 16.2.6.3. SWOT Analysis
- 16.2.6.4. Recent Developments
- 16.2.6.5. Financials (Based on Availability)
- 16.2.7 Dassault Systèmes SE
- 16.2.7.1. Overview
- 16.2.7.2. Products
- 16.2.7.3. SWOT Analysis
- 16.2.7.4. Recent Developments
- 16.2.7.5. Financials (Based on Availability)
- 16.2.8 General Electric Company
- 16.2.8.1. Overview
- 16.2.8.2. Products
- 16.2.8.3. SWOT Analysis
- 16.2.8.4. Recent Developments
- 16.2.8.5. Financials (Based on Availability)
- 16.2.9 HCL Technologies Limited
- 16.2.9.1. Overview
- 16.2.9.2. Products
- 16.2.9.3. SWOT Analysis
- 16.2.9.4. Recent Developments
- 16.2.9.5. Financials (Based on Availability)
- 16.2.10 SAP SE
- 16.2.10.1. Overview
- 16.2.10.2. Products
- 16.2.10.3. SWOT Analysis
- 16.2.10.4. Recent Developments
- 16.2.10.5. Financials (Based on Availability)
- 16.2.1 Aras Corporation
List of Figures
- Figure 1: Global Model-Based Enterprise Industry Revenue Breakdown (Million, %) by Region 2024 & 2032
- Figure 2: North America Model-Based Enterprise Industry Revenue (Million), by Country 2024 & 2032
- Figure 3: North America Model-Based Enterprise Industry Revenue Share (%), by Country 2024 & 2032
- Figure 4: Europe Model-Based Enterprise Industry Revenue (Million), by Country 2024 & 2032
- Figure 5: Europe Model-Based Enterprise Industry Revenue Share (%), by Country 2024 & 2032
- Figure 6: Asia Pacific Model-Based Enterprise Industry Revenue (Million), by Country 2024 & 2032
- Figure 7: Asia Pacific Model-Based Enterprise Industry Revenue Share (%), by Country 2024 & 2032
- Figure 8: Latin America Model-Based Enterprise Industry Revenue (Million), by Country 2024 & 2032
- Figure 9: Latin America Model-Based Enterprise Industry Revenue Share (%), by Country 2024 & 2032
- Figure 10: Middle East and Africa Model-Based Enterprise Industry Revenue (Million), by Country 2024 & 2032
- Figure 11: Middle East and Africa Model-Based Enterprise Industry Revenue Share (%), by Country 2024 & 2032
- Figure 12: North America Model-Based Enterprise Industry Revenue (Million), by Offering 2024 & 2032
- Figure 13: North America Model-Based Enterprise Industry Revenue Share (%), by Offering 2024 & 2032
- Figure 14: North America Model-Based Enterprise Industry Revenue (Million), by Deployment Mode 2024 & 2032
- Figure 15: North America Model-Based Enterprise Industry Revenue Share (%), by Deployment Mode 2024 & 2032
- Figure 16: North America Model-Based Enterprise Industry Revenue (Million), by End User 2024 & 2032
- Figure 17: North America Model-Based Enterprise Industry Revenue Share (%), by End User 2024 & 2032
- Figure 18: North America Model-Based Enterprise Industry Revenue (Million), by Country 2024 & 2032
- Figure 19: North America Model-Based Enterprise Industry Revenue Share (%), by Country 2024 & 2032
- Figure 20: Europe Model-Based Enterprise Industry Revenue (Million), by Offering 2024 & 2032
- Figure 21: Europe Model-Based Enterprise Industry Revenue Share (%), by Offering 2024 & 2032
- Figure 22: Europe Model-Based Enterprise Industry Revenue (Million), by Deployment Mode 2024 & 2032
- Figure 23: Europe Model-Based Enterprise Industry Revenue Share (%), by Deployment Mode 2024 & 2032
- Figure 24: Europe Model-Based Enterprise Industry Revenue (Million), by End User 2024 & 2032
- Figure 25: Europe Model-Based Enterprise Industry Revenue Share (%), by End User 2024 & 2032
- Figure 26: Europe Model-Based Enterprise Industry Revenue (Million), by Country 2024 & 2032
- Figure 27: Europe Model-Based Enterprise Industry Revenue Share (%), by Country 2024 & 2032
- Figure 28: Asia Pacific Model-Based Enterprise Industry Revenue (Million), by Offering 2024 & 2032
- Figure 29: Asia Pacific Model-Based Enterprise Industry Revenue Share (%), by Offering 2024 & 2032
- Figure 30: Asia Pacific Model-Based Enterprise Industry Revenue (Million), by Deployment Mode 2024 & 2032
- Figure 31: Asia Pacific Model-Based Enterprise Industry Revenue Share (%), by Deployment Mode 2024 & 2032
- Figure 32: Asia Pacific Model-Based Enterprise Industry Revenue (Million), by End User 2024 & 2032
- Figure 33: Asia Pacific Model-Based Enterprise Industry Revenue Share (%), by End User 2024 & 2032
- Figure 34: Asia Pacific Model-Based Enterprise Industry Revenue (Million), by Country 2024 & 2032
- Figure 35: Asia Pacific Model-Based Enterprise Industry Revenue Share (%), by Country 2024 & 2032
- Figure 36: Latin America Model-Based Enterprise Industry Revenue (Million), by Offering 2024 & 2032
- Figure 37: Latin America Model-Based Enterprise Industry Revenue Share (%), by Offering 2024 & 2032
- Figure 38: Latin America Model-Based Enterprise Industry Revenue (Million), by Deployment Mode 2024 & 2032
- Figure 39: Latin America Model-Based Enterprise Industry Revenue Share (%), by Deployment Mode 2024 & 2032
- Figure 40: Latin America Model-Based Enterprise Industry Revenue (Million), by End User 2024 & 2032
- Figure 41: Latin America Model-Based Enterprise Industry Revenue Share (%), by End User 2024 & 2032
- Figure 42: Latin America Model-Based Enterprise Industry Revenue (Million), by Country 2024 & 2032
- Figure 43: Latin America Model-Based Enterprise Industry Revenue Share (%), by Country 2024 & 2032
- Figure 44: Middle East and Africa Model-Based Enterprise Industry Revenue (Million), by Offering 2024 & 2032
- Figure 45: Middle East and Africa Model-Based Enterprise Industry Revenue Share (%), by Offering 2024 & 2032
- Figure 46: Middle East and Africa Model-Based Enterprise Industry Revenue (Million), by Deployment Mode 2024 & 2032
- Figure 47: Middle East and Africa Model-Based Enterprise Industry Revenue Share (%), by Deployment Mode 2024 & 2032
- Figure 48: Middle East and Africa Model-Based Enterprise Industry Revenue (Million), by End User 2024 & 2032
- Figure 49: Middle East and Africa Model-Based Enterprise Industry Revenue Share (%), by End User 2024 & 2032
- Figure 50: Middle East and Africa Model-Based Enterprise Industry Revenue (Million), by Country 2024 & 2032
- Figure 51: Middle East and Africa Model-Based Enterprise Industry Revenue Share (%), by Country 2024 & 2032
List of Tables
- Table 1: Global Model-Based Enterprise Industry Revenue Million Forecast, by Region 2019 & 2032
- Table 2: Global Model-Based Enterprise Industry Revenue Million Forecast, by Offering 2019 & 2032
- Table 3: Global Model-Based Enterprise Industry Revenue Million Forecast, by Deployment Mode 2019 & 2032
- Table 4: Global Model-Based Enterprise Industry Revenue Million Forecast, by End User 2019 & 2032
- Table 5: Global Model-Based Enterprise Industry Revenue Million Forecast, by Region 2019 & 2032
- Table 6: Global Model-Based Enterprise Industry Revenue Million Forecast, by Country 2019 & 2032
- Table 7: Model-Based Enterprise Industry Revenue (Million) Forecast, by Application 2019 & 2032
- Table 8: Global Model-Based Enterprise Industry Revenue Million Forecast, by Country 2019 & 2032
- Table 9: Model-Based Enterprise Industry Revenue (Million) Forecast, by Application 2019 & 2032
- Table 10: Global Model-Based Enterprise Industry Revenue Million Forecast, by Country 2019 & 2032
- Table 11: Model-Based Enterprise Industry Revenue (Million) Forecast, by Application 2019 & 2032
- Table 12: Global Model-Based Enterprise Industry Revenue Million Forecast, by Country 2019 & 2032
- Table 13: Model-Based Enterprise Industry Revenue (Million) Forecast, by Application 2019 & 2032
- Table 14: Global Model-Based Enterprise Industry Revenue Million Forecast, by Country 2019 & 2032
- Table 15: Model-Based Enterprise Industry Revenue (Million) Forecast, by Application 2019 & 2032
- Table 16: Global Model-Based Enterprise Industry Revenue Million Forecast, by Offering 2019 & 2032
- Table 17: Global Model-Based Enterprise Industry Revenue Million Forecast, by Deployment Mode 2019 & 2032
- Table 18: Global Model-Based Enterprise Industry Revenue Million Forecast, by End User 2019 & 2032
- Table 19: Global Model-Based Enterprise Industry Revenue Million Forecast, by Country 2019 & 2032
- Table 20: Global Model-Based Enterprise Industry Revenue Million Forecast, by Offering 2019 & 2032
- Table 21: Global Model-Based Enterprise Industry Revenue Million Forecast, by Deployment Mode 2019 & 2032
- Table 22: Global Model-Based Enterprise Industry Revenue Million Forecast, by End User 2019 & 2032
- Table 23: Global Model-Based Enterprise Industry Revenue Million Forecast, by Country 2019 & 2032
- Table 24: Global Model-Based Enterprise Industry Revenue Million Forecast, by Offering 2019 & 2032
- Table 25: Global Model-Based Enterprise Industry Revenue Million Forecast, by Deployment Mode 2019 & 2032
- Table 26: Global Model-Based Enterprise Industry Revenue Million Forecast, by End User 2019 & 2032
- Table 27: Global Model-Based Enterprise Industry Revenue Million Forecast, by Country 2019 & 2032
- Table 28: Global Model-Based Enterprise Industry Revenue Million Forecast, by Offering 2019 & 2032
- Table 29: Global Model-Based Enterprise Industry Revenue Million Forecast, by Deployment Mode 2019 & 2032
- Table 30: Global Model-Based Enterprise Industry Revenue Million Forecast, by End User 2019 & 2032
- Table 31: Global Model-Based Enterprise Industry Revenue Million Forecast, by Country 2019 & 2032
- Table 32: Global Model-Based Enterprise Industry Revenue Million Forecast, by Offering 2019 & 2032
- Table 33: Global Model-Based Enterprise Industry Revenue Million Forecast, by Deployment Mode 2019 & 2032
- Table 34: Global Model-Based Enterprise Industry Revenue Million Forecast, by End User 2019 & 2032
- Table 35: Global Model-Based Enterprise Industry Revenue Million Forecast, by Country 2019 & 2032
Frequently Asked Questions
1. What is the projected Compound Annual Growth Rate (CAGR) of the Model-Based Enterprise Industry?
The projected CAGR is approximately 15.42%.
2. Which companies are prominent players in the Model-Based Enterprise Industry?
Key companies in the market include Aras Corporation, Anark Corporatio, Siemens AG, PTC Inc, Autodesk Inc, Oracle Corporation, Dassault Systèmes SE, General Electric Company, HCL Technologies Limited, SAP SE.
3. What are the main segments of the Model-Based Enterprise Industry?
The market segments include Offering, Deployment Mode, End User.
4. Can you provide details about the market size?
The market size is estimated to be USD 20.76 Million as of 2022.
5. What are some drivers contributing to market growth?
Evolving Software Capabilities; Rising Adoption of IoT and Cloud-based Platforms.
6. What are the notable trends driving market growth?
Automotive Sector to Witness Major Growth.
7. Are there any restraints impacting market growth?
Shortage of Skilled Workers. Data Security Concerns. and the Initial Investment Costs Hinder Business Operations.
8. Can you provide examples of recent developments in the market?
September 2023 - Tech Soft 3D, the provider of engineering software development toolkits, introduced iBase-t, which assists its users in simplifying how complex products are built and maintained. It integrated HOOPS Exchange, the CAD import and export library, into iBase-t's Solumina iSeries Manufacturing Operations Platform.
9. What pricing options are available for accessing the report?
Pricing options include single-user, multi-user, and enterprise licenses priced at USD 4750, USD 5250, and USD 8750 respectively.
10. Is the market size provided in terms of value or volume?
The market size is provided in terms of value, measured in Million.
11. Are there any specific market keywords associated with the report?
Yes, the market keyword associated with the report is "Model-Based Enterprise Industry," which aids in identifying and referencing the specific market segment covered.
12. How do I determine which pricing option suits my needs best?
The pricing options vary based on user requirements and access needs. Individual users may opt for single-user licenses, while businesses requiring broader access may choose multi-user or enterprise licenses for cost-effective access to the report.
13. Are there any additional resources or data provided in the Model-Based Enterprise Industry report?
While the report offers comprehensive insights, it's advisable to review the specific contents or supplementary materials provided to ascertain if additional resources or data are available.
14. How can I stay updated on further developments or reports in the Model-Based Enterprise Industry?
To stay informed about further developments, trends, and reports in the Model-Based Enterprise Industry, consider subscribing to industry newsletters, following relevant companies and organizations, or regularly checking reputable industry news sources and publications.
Methodology
Step 1 - Identification of Relevant Samples Size from Population Database


Step 2 - Approaches for Defining Global Market Size (Value, Volume* & Price*)

Note*: In applicable scenarios
Step 3 - Data Sources
Primary Research
- Web Analytics
- Survey Reports
- Research Institute
- Latest Research Reports
- Opinion Leaders
Secondary Research
- Annual Reports
- White Paper
- Latest Press Release
- Industry Association
- Paid Database
- Investor Presentations

Step 4 - Data Triangulation
Involves using different sources of information in order to increase the validity of a study
These sources are likely to be stakeholders in a program - participants, other researchers, program staff, other community members, and so on.
Then we put all data in single framework & apply various statistical tools to find out the dynamic on the market.
During the analysis stage, feedback from the stakeholder groups would be compared to determine areas of agreement as well as areas of divergence


