


Key Insights
The North American electric drives market is experiencing robust growth, driven by increasing automation across various industries and the rising demand for energy-efficient solutions. The market, estimated at $XX million in 2025, is projected to witness a Compound Annual Growth Rate (CAGR) of 6.79% from 2025 to 2033. Key drivers include the expanding adoption of electric vehicles, the growing need for precise motion control in industrial automation, and government initiatives promoting energy efficiency. Significant growth is anticipated in segments like AC drives, owing to their versatility and cost-effectiveness, and in end-user industries such as oil & gas, chemical processing, and renewable energy. The increasing integration of smart technologies and Industry 4.0 principles further fuels market expansion. While supply chain disruptions and fluctuating raw material prices pose challenges, the long-term outlook remains positive due to sustained industrial growth and technological advancements. The competitive landscape is characterized by established players like Rockwell Automation, ABB, and Siemens, alongside emerging companies offering innovative solutions. Specific regional variations within North America (e.g., the US, Canada, and Mexico) may exist based on their respective industrial development and adoption rates of advanced technologies.
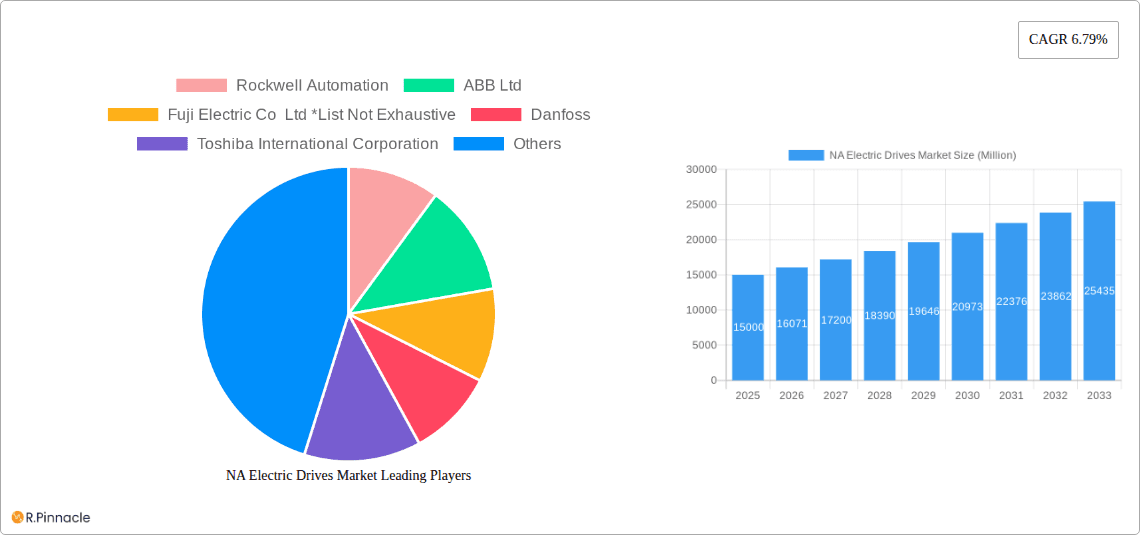
NA Electric Drives Market Market Size (In Billion)

The North American market is segmented by drive type (AC, DC, Servo), voltage level (low, medium), and end-user industry (Oil & Gas, Chemical, Food & Beverage, etc.). The dominance of AC drives is expected to continue, given their widespread applicability and cost-effectiveness. However, the demand for servo drives, particularly in precision-oriented industries, is likely to rise significantly. Within end-user industries, the oil & gas, chemical & petrochemical sectors are anticipated to show considerable growth due to automation initiatives and the need for precise process control. The adoption of electric drives in renewable energy and water/wastewater treatment facilities is also expected to contribute to market expansion. Competitive pressures are likely to remain intense, requiring companies to focus on product innovation, technological advancements, and strategic partnerships to maintain market share.

NA Electric Drives Market Company Market Share
North America Electric Drives Market Report: 2019-2033
This comprehensive report provides a detailed analysis of the North America (NA) electric drives market, offering actionable insights for industry professionals. Covering the period 2019-2033, with a base year of 2025, this report examines market dynamics, growth drivers, challenges, and future opportunities. The analysis includes segmentation by type (AC Drives, DC Drives, Servo Drives), voltage (Low, Medium), and end-user industry (Oil & Gas, Chemical & Petrochemical, Food & Beverage, Water & Wastewater, Power Generation, Metal & Mining, Pulp & Paper, HVAC, Discrete Industries, Other End-user Industries). Key players like Rockwell Automation, ABB Ltd, Fuji Electric Co Ltd, Danfoss, Toshiba International Corporation, Nidec Corporation, Emerson Electric Co, Mitsubishi Electric Corporation, Siemens AG, and Schneider Electric are profiled, though this list is not exhaustive. The total market value is projected to reach xx Million by 2033.
NA Electric Drives Market Structure & Innovation Trends
This section delves into the competitive landscape of the NA electric drives market. We analyze market concentration, identifying key players and their respective market shares. The report also examines innovation drivers, including technological advancements and regulatory changes influencing product development and adoption. Furthermore, it explores the regulatory framework governing the industry, identifies potential product substitutes, and analyzes end-user demographics impacting market demand. Finally, the section details recent mergers and acquisitions (M&A) activity within the sector, including deal values and their implications for market structure. For example, the increasing adoption of energy-efficient drives is a key innovation driver, and the report quantifies the market impact of these trends. The level of market concentration is assessed, with major players holding approximately xx% of the market share in 2025. M&A activity is analyzed, with an estimated xx Million in deal value recorded in the historical period.
NA Electric Drives Market Dynamics & Trends
This section examines the market's dynamic growth trajectory, utilizing comprehensive data analysis and trends to pinpoint its growth factors. We analyze factors driving market growth, including increasing industrial automation, rising energy efficiency standards, and the growing demand for electric vehicles. The report also explores technological disruptions, such as the adoption of advanced control technologies and the integration of digital technologies, assessing their impact on market dynamics. Furthermore, evolving consumer preferences towards sustainable and efficient solutions are considered, along with the competitive dynamics influencing market share and pricing strategies. The Compound Annual Growth Rate (CAGR) is projected to be xx% during the forecast period (2025-2033), with market penetration expected to reach xx% by 2033.
Dominant Regions & Segments in NA Electric Drives Market
This section identifies the leading regions and segments within the NA electric drives market. Detailed analysis highlights the dominant players and their market strategies. Key drivers for growth in each segment are identified through bullet points and in-depth analysis.
Dominant Regions:
- Paragraph detailing the dominant region and its key characteristics (e.g., strong industrial base, supportive government policies).
- Paragraph detailing secondary regions, with brief explanations for their market position
Dominant Segments:
- Type: Paragraph describing the dominant type (e.g., AC drives) and reasons for its dominance (e.g., cost-effectiveness, versatility). Bullet points highlighting key drivers for growth.
- Voltage: Paragraph detailing the dominant voltage category (e.g., low voltage) and the factors contributing to its market share. Bullet points highlighting key drivers for growth.
- End-user Industry: Paragraph analyzing the largest end-user industry (e.g., Oil & Gas) and its growth drivers (e.g., large-scale industrial projects, automation initiatives). Bullet points highlighting key drivers for growth in other significant end-user industries.
NA Electric Drives Market Product Innovations
Recent product developments have focused on improving energy efficiency, enhancing control precision, and integrating advanced communication capabilities. The introduction of sensor-integrated drives, such as Yaskawa's Σ-X Series, is illustrative of this trend. These innovations provide improved performance, enhanced reliability, and streamlined integration with existing industrial automation systems, improving operational efficiency and reducing maintenance needs. These advancements cater to the growing demand for sophisticated, reliable, and sustainable solutions across various sectors.
Report Scope & Segmentation Analysis
This report segments the NA electric drives market by type (AC Drives, DC Drives, Servo Drives), voltage (Low, Medium), and end-user industry (Oil & Gas, Chemical & Petrochemical, Food & Beverage, Water & Wastewater, Power Generation, Metal & Mining, Pulp & Paper, HVAC, Discrete Industries, Other End-user Industries). Each segment's growth projections, market sizes, and competitive dynamics are analyzed in detail. For instance, the AC Drives segment is projected to exhibit the highest growth rate due to its cost-effectiveness and wide applicability, while the Oil & Gas sector is expected to drive significant demand due to its automation needs.
Key Drivers of NA Electric Drives Market Growth
The NA electric drives market is propelled by several key factors. Technological advancements, particularly in power electronics and control systems, are enhancing the efficiency and performance of electric drives. Stringent government regulations promoting energy efficiency are also boosting adoption. Furthermore, the rising demand for automation across various industries and the expanding renewable energy sector are major growth drivers. The increasing focus on industrial automation in diverse end-user industries creates a robust market for electric drives.
Challenges in the NA Electric Drives Market Sector
The NA electric drives market faces challenges such as supply chain disruptions impacting component availability and pricing. Furthermore, intense competition among established players and new entrants is impacting profit margins. Regulatory compliance and the need to adhere to ever-evolving energy efficiency standards present ongoing hurdles. These challenges contribute to increased production costs and potentially hinder market growth. The market experienced an approximate xx% increase in component costs during the historical period due to supply chain issues.
Emerging Opportunities in NA Electric Drives Market
Emerging opportunities include the growing demand for electric drives in renewable energy applications, such as wind and solar power generation. The increasing adoption of Industry 4.0 principles and the integration of electric drives into smart factories present significant growth potential. Furthermore, advancements in energy storage technologies, coupled with the development of smart grids, are opening new avenues for the adoption of electric drives.
Leading Players in the NA Electric Drives Market Market
- Rockwell Automation
- ABB Ltd
- Fuji Electric Co Ltd
- Danfoss
- Toshiba International Corporation
- Nidec Corporation
- Emerson Electric Co
- Mitsubishi Electric Corporation
- Siemens AG
- Schneider Electric
Key Developments in NA Electric Drives Market Industry
- March 2021: Yaskawa Electric Corporation launched the "-X Series" AC servo drives, succeeding the Σ-7 Series, incorporating sensor data utilization and advanced functionalities. This launch enhanced the company's competitive standing and broadened its product portfolio in the servo drive segment.
Future Outlook for NA Electric Drives Market Market
The NA electric drives market is poised for continued growth, driven by ongoing technological advancements, rising energy efficiency demands, and increasing automation across diverse industries. Strategic partnerships, acquisitions, and innovation in areas such as energy storage and smart grids will shape future market dynamics. The continued adoption of automation across all sectors suggests strong future potential for growth in the NA Electric Drives market.
NA Electric Drives Market Segmentation
-
1. Type
- 1.1. AC Drives
- 1.2. DC Drives
- 1.3. Servo Drives
-
2. Voltage
- 2.1. Low
- 2.2. Medium
-
3. End-user Industry
- 3.1. Oil & Gas
- 3.2. Chemical & Petrochemical
- 3.3. Food & Beverage
- 3.4. Water & Wastewater
- 3.5. Power Generation
- 3.6. Metal & Mining
- 3.7. Pulp & Paper
- 3.8. HVAC
- 3.9. Discrete Industries
- 3.10. Other End-user Industries
NA Electric Drives Market Segmentation By Geography
-
1. North America
- 1.1. United States
- 1.2. Canada
- 1.3. Mexico
-
2. South America
- 2.1. Brazil
- 2.2. Argentina
- 2.3. Rest of South America
-
3. Europe
- 3.1. United Kingdom
- 3.2. Germany
- 3.3. France
- 3.4. Italy
- 3.5. Spain
- 3.6. Russia
- 3.7. Benelux
- 3.8. Nordics
- 3.9. Rest of Europe
-
4. Middle East & Africa
- 4.1. Turkey
- 4.2. Israel
- 4.3. GCC
- 4.4. North Africa
- 4.5. South Africa
- 4.6. Rest of Middle East & Africa
-
5. Asia Pacific
- 5.1. China
- 5.2. India
- 5.3. Japan
- 5.4. South Korea
- 5.5. ASEAN
- 5.6. Oceania
- 5.7. Rest of Asia Pacific
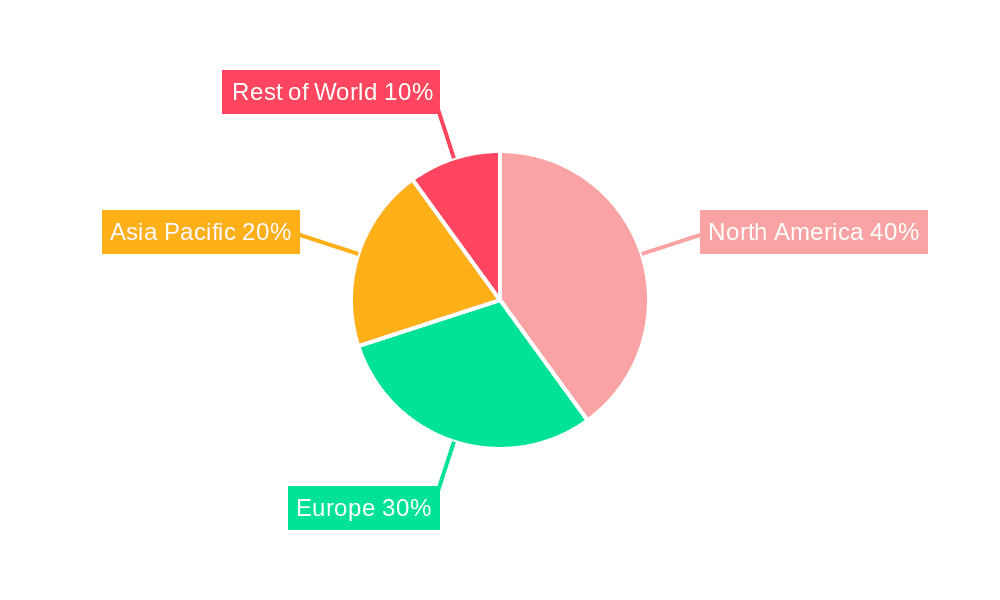
NA Electric Drives Market Regional Market Share
Geographic Coverage of NA Electric Drives Market
NA Electric Drives Market REPORT HIGHLIGHTS
| Aspects | Details |
|---|---|
| Study Period | 2020-2034 |
| Base Year | 2025 |
| Estimated Year | 2026 |
| Forecast Period | 2026-2034 |
| Historical Period | 2020-2025 |
| Growth Rate | CAGR of 4.1% from 2020-2034 |
| Segmentation |
|
Table of Contents
- 1. Introduction
- 1.1. Research Scope
- 1.2. Market Segmentation
- 1.3. Research Methodology
- 1.4. Definitions and Assumptions
- 2. Executive Summary
- 2.1. Introduction
- 3. Market Dynamics
- 3.1. Introduction
- 3.2. Market Drivers
- 3.2.1. Increasing Adoption of Automation; Signficant Growth in Manufacturing Sector
- 3.3. Market Restrains
- 3.3.1. High Costs of Electric Drive
- 3.4. Market Trends
- 3.4.1. Servo Drives are Analyzed to Hold Significant Share
- 4. Market Factor Analysis
- 4.1. Porters Five Forces
- 4.2. Supply/Value Chain
- 4.3. PESTEL analysis
- 4.4. Market Entropy
- 4.5. Patent/Trademark Analysis
- 5. Global NA Electric Drives Market Analysis, Insights and Forecast, 2020-2032
- 5.1. Market Analysis, Insights and Forecast - by Type
- 5.1.1. AC Drives
- 5.1.2. DC Drives
- 5.1.3. Servo Drives
- 5.2. Market Analysis, Insights and Forecast - by Voltage
- 5.2.1. Low
- 5.2.2. Medium
- 5.3. Market Analysis, Insights and Forecast - by End-user Industry
- 5.3.1. Oil & Gas
- 5.3.2. Chemical & Petrochemical
- 5.3.3. Food & Beverage
- 5.3.4. Water & Wastewater
- 5.3.5. Power Generation
- 5.3.6. Metal & Mining
- 5.3.7. Pulp & Paper
- 5.3.8. HVAC
- 5.3.9. Discrete Industries
- 5.3.10. Other End-user Industries
- 5.4. Market Analysis, Insights and Forecast - by Region
- 5.4.1. North America
- 5.4.2. South America
- 5.4.3. Europe
- 5.4.4. Middle East & Africa
- 5.4.5. Asia Pacific
- 5.1. Market Analysis, Insights and Forecast - by Type
- 6. North America NA Electric Drives Market Analysis, Insights and Forecast, 2020-2032
- 6.1. Market Analysis, Insights and Forecast - by Type
- 6.1.1. AC Drives
- 6.1.2. DC Drives
- 6.1.3. Servo Drives
- 6.2. Market Analysis, Insights and Forecast - by Voltage
- 6.2.1. Low
- 6.2.2. Medium
- 6.3. Market Analysis, Insights and Forecast - by End-user Industry
- 6.3.1. Oil & Gas
- 6.3.2. Chemical & Petrochemical
- 6.3.3. Food & Beverage
- 6.3.4. Water & Wastewater
- 6.3.5. Power Generation
- 6.3.6. Metal & Mining
- 6.3.7. Pulp & Paper
- 6.3.8. HVAC
- 6.3.9. Discrete Industries
- 6.3.10. Other End-user Industries
- 6.1. Market Analysis, Insights and Forecast - by Type
- 7. South America NA Electric Drives Market Analysis, Insights and Forecast, 2020-2032
- 7.1. Market Analysis, Insights and Forecast - by Type
- 7.1.1. AC Drives
- 7.1.2. DC Drives
- 7.1.3. Servo Drives
- 7.2. Market Analysis, Insights and Forecast - by Voltage
- 7.2.1. Low
- 7.2.2. Medium
- 7.3. Market Analysis, Insights and Forecast - by End-user Industry
- 7.3.1. Oil & Gas
- 7.3.2. Chemical & Petrochemical
- 7.3.3. Food & Beverage
- 7.3.4. Water & Wastewater
- 7.3.5. Power Generation
- 7.3.6. Metal & Mining
- 7.3.7. Pulp & Paper
- 7.3.8. HVAC
- 7.3.9. Discrete Industries
- 7.3.10. Other End-user Industries
- 7.1. Market Analysis, Insights and Forecast - by Type
- 8. Europe NA Electric Drives Market Analysis, Insights and Forecast, 2020-2032
- 8.1. Market Analysis, Insights and Forecast - by Type
- 8.1.1. AC Drives
- 8.1.2. DC Drives
- 8.1.3. Servo Drives
- 8.2. Market Analysis, Insights and Forecast - by Voltage
- 8.2.1. Low
- 8.2.2. Medium
- 8.3. Market Analysis, Insights and Forecast - by End-user Industry
- 8.3.1. Oil & Gas
- 8.3.2. Chemical & Petrochemical
- 8.3.3. Food & Beverage
- 8.3.4. Water & Wastewater
- 8.3.5. Power Generation
- 8.3.6. Metal & Mining
- 8.3.7. Pulp & Paper
- 8.3.8. HVAC
- 8.3.9. Discrete Industries
- 8.3.10. Other End-user Industries
- 8.1. Market Analysis, Insights and Forecast - by Type
- 9. Middle East & Africa NA Electric Drives Market Analysis, Insights and Forecast, 2020-2032
- 9.1. Market Analysis, Insights and Forecast - by Type
- 9.1.1. AC Drives
- 9.1.2. DC Drives
- 9.1.3. Servo Drives
- 9.2. Market Analysis, Insights and Forecast - by Voltage
- 9.2.1. Low
- 9.2.2. Medium
- 9.3. Market Analysis, Insights and Forecast - by End-user Industry
- 9.3.1. Oil & Gas
- 9.3.2. Chemical & Petrochemical
- 9.3.3. Food & Beverage
- 9.3.4. Water & Wastewater
- 9.3.5. Power Generation
- 9.3.6. Metal & Mining
- 9.3.7. Pulp & Paper
- 9.3.8. HVAC
- 9.3.9. Discrete Industries
- 9.3.10. Other End-user Industries
- 9.1. Market Analysis, Insights and Forecast - by Type
- 10. Asia Pacific NA Electric Drives Market Analysis, Insights and Forecast, 2020-2032
- 10.1. Market Analysis, Insights and Forecast - by Type
- 10.1.1. AC Drives
- 10.1.2. DC Drives
- 10.1.3. Servo Drives
- 10.2. Market Analysis, Insights and Forecast - by Voltage
- 10.2.1. Low
- 10.2.2. Medium
- 10.3. Market Analysis, Insights and Forecast - by End-user Industry
- 10.3.1. Oil & Gas
- 10.3.2. Chemical & Petrochemical
- 10.3.3. Food & Beverage
- 10.3.4. Water & Wastewater
- 10.3.5. Power Generation
- 10.3.6. Metal & Mining
- 10.3.7. Pulp & Paper
- 10.3.8. HVAC
- 10.3.9. Discrete Industries
- 10.3.10. Other End-user Industries
- 10.1. Market Analysis, Insights and Forecast - by Type
- 11. Competitive Analysis
- 11.1. Global Market Share Analysis 2025
- 11.2. Company Profiles
- 11.2.1 Rockwell Automation
- 11.2.1.1. Overview
- 11.2.1.2. Products
- 11.2.1.3. SWOT Analysis
- 11.2.1.4. Recent Developments
- 11.2.1.5. Financials (Based on Availability)
- 11.2.2 ABB Ltd
- 11.2.2.1. Overview
- 11.2.2.2. Products
- 11.2.2.3. SWOT Analysis
- 11.2.2.4. Recent Developments
- 11.2.2.5. Financials (Based on Availability)
- 11.2.3 Fuji Electric Co Ltd *List Not Exhaustive
- 11.2.3.1. Overview
- 11.2.3.2. Products
- 11.2.3.3. SWOT Analysis
- 11.2.3.4. Recent Developments
- 11.2.3.5. Financials (Based on Availability)
- 11.2.4 Danfoss
- 11.2.4.1. Overview
- 11.2.4.2. Products
- 11.2.4.3. SWOT Analysis
- 11.2.4.4. Recent Developments
- 11.2.4.5. Financials (Based on Availability)
- 11.2.5 Toshiba International Corporation
- 11.2.5.1. Overview
- 11.2.5.2. Products
- 11.2.5.3. SWOT Analysis
- 11.2.5.4. Recent Developments
- 11.2.5.5. Financials (Based on Availability)
- 11.2.6 Nidec Corporation
- 11.2.6.1. Overview
- 11.2.6.2. Products
- 11.2.6.3. SWOT Analysis
- 11.2.6.4. Recent Developments
- 11.2.6.5. Financials (Based on Availability)
- 11.2.7 Emerson Electric Co
- 11.2.7.1. Overview
- 11.2.7.2. Products
- 11.2.7.3. SWOT Analysis
- 11.2.7.4. Recent Developments
- 11.2.7.5. Financials (Based on Availability)
- 11.2.8 Mitsubishi Electric Corporation
- 11.2.8.1. Overview
- 11.2.8.2. Products
- 11.2.8.3. SWOT Analysis
- 11.2.8.4. Recent Developments
- 11.2.8.5. Financials (Based on Availability)
- 11.2.9 Siemens AG
- 11.2.9.1. Overview
- 11.2.9.2. Products
- 11.2.9.3. SWOT Analysis
- 11.2.9.4. Recent Developments
- 11.2.9.5. Financials (Based on Availability)
- 11.2.10 Schneider Electric
- 11.2.10.1. Overview
- 11.2.10.2. Products
- 11.2.10.3. SWOT Analysis
- 11.2.10.4. Recent Developments
- 11.2.10.5. Financials (Based on Availability)
- 11.2.1 Rockwell Automation
List of Figures
- Figure 1: Global NA Electric Drives Market Revenue Breakdown (undefined, %) by Region 2025 & 2033
- Figure 2: North America NA Electric Drives Market Revenue (undefined), by Type 2025 & 2033
- Figure 3: North America NA Electric Drives Market Revenue Share (%), by Type 2025 & 2033
- Figure 4: North America NA Electric Drives Market Revenue (undefined), by Voltage 2025 & 2033
- Figure 5: North America NA Electric Drives Market Revenue Share (%), by Voltage 2025 & 2033
- Figure 6: North America NA Electric Drives Market Revenue (undefined), by End-user Industry 2025 & 2033
- Figure 7: North America NA Electric Drives Market Revenue Share (%), by End-user Industry 2025 & 2033
- Figure 8: North America NA Electric Drives Market Revenue (undefined), by Country 2025 & 2033
- Figure 9: North America NA Electric Drives Market Revenue Share (%), by Country 2025 & 2033
- Figure 10: South America NA Electric Drives Market Revenue (undefined), by Type 2025 & 2033
- Figure 11: South America NA Electric Drives Market Revenue Share (%), by Type 2025 & 2033
- Figure 12: South America NA Electric Drives Market Revenue (undefined), by Voltage 2025 & 2033
- Figure 13: South America NA Electric Drives Market Revenue Share (%), by Voltage 2025 & 2033
- Figure 14: South America NA Electric Drives Market Revenue (undefined), by End-user Industry 2025 & 2033
- Figure 15: South America NA Electric Drives Market Revenue Share (%), by End-user Industry 2025 & 2033
- Figure 16: South America NA Electric Drives Market Revenue (undefined), by Country 2025 & 2033
- Figure 17: South America NA Electric Drives Market Revenue Share (%), by Country 2025 & 2033
- Figure 18: Europe NA Electric Drives Market Revenue (undefined), by Type 2025 & 2033
- Figure 19: Europe NA Electric Drives Market Revenue Share (%), by Type 2025 & 2033
- Figure 20: Europe NA Electric Drives Market Revenue (undefined), by Voltage 2025 & 2033
- Figure 21: Europe NA Electric Drives Market Revenue Share (%), by Voltage 2025 & 2033
- Figure 22: Europe NA Electric Drives Market Revenue (undefined), by End-user Industry 2025 & 2033
- Figure 23: Europe NA Electric Drives Market Revenue Share (%), by End-user Industry 2025 & 2033
- Figure 24: Europe NA Electric Drives Market Revenue (undefined), by Country 2025 & 2033
- Figure 25: Europe NA Electric Drives Market Revenue Share (%), by Country 2025 & 2033
- Figure 26: Middle East & Africa NA Electric Drives Market Revenue (undefined), by Type 2025 & 2033
- Figure 27: Middle East & Africa NA Electric Drives Market Revenue Share (%), by Type 2025 & 2033
- Figure 28: Middle East & Africa NA Electric Drives Market Revenue (undefined), by Voltage 2025 & 2033
- Figure 29: Middle East & Africa NA Electric Drives Market Revenue Share (%), by Voltage 2025 & 2033
- Figure 30: Middle East & Africa NA Electric Drives Market Revenue (undefined), by End-user Industry 2025 & 2033
- Figure 31: Middle East & Africa NA Electric Drives Market Revenue Share (%), by End-user Industry 2025 & 2033
- Figure 32: Middle East & Africa NA Electric Drives Market Revenue (undefined), by Country 2025 & 2033
- Figure 33: Middle East & Africa NA Electric Drives Market Revenue Share (%), by Country 2025 & 2033
- Figure 34: Asia Pacific NA Electric Drives Market Revenue (undefined), by Type 2025 & 2033
- Figure 35: Asia Pacific NA Electric Drives Market Revenue Share (%), by Type 2025 & 2033
- Figure 36: Asia Pacific NA Electric Drives Market Revenue (undefined), by Voltage 2025 & 2033
- Figure 37: Asia Pacific NA Electric Drives Market Revenue Share (%), by Voltage 2025 & 2033
- Figure 38: Asia Pacific NA Electric Drives Market Revenue (undefined), by End-user Industry 2025 & 2033
- Figure 39: Asia Pacific NA Electric Drives Market Revenue Share (%), by End-user Industry 2025 & 2033
- Figure 40: Asia Pacific NA Electric Drives Market Revenue (undefined), by Country 2025 & 2033
- Figure 41: Asia Pacific NA Electric Drives Market Revenue Share (%), by Country 2025 & 2033
List of Tables
- Table 1: Global NA Electric Drives Market Revenue undefined Forecast, by Type 2020 & 2033
- Table 2: Global NA Electric Drives Market Revenue undefined Forecast, by Voltage 2020 & 2033
- Table 3: Global NA Electric Drives Market Revenue undefined Forecast, by End-user Industry 2020 & 2033
- Table 4: Global NA Electric Drives Market Revenue undefined Forecast, by Region 2020 & 2033
- Table 5: Global NA Electric Drives Market Revenue undefined Forecast, by Type 2020 & 2033
- Table 6: Global NA Electric Drives Market Revenue undefined Forecast, by Voltage 2020 & 2033
- Table 7: Global NA Electric Drives Market Revenue undefined Forecast, by End-user Industry 2020 & 2033
- Table 8: Global NA Electric Drives Market Revenue undefined Forecast, by Country 2020 & 2033
- Table 9: United States NA Electric Drives Market Revenue (undefined) Forecast, by Application 2020 & 2033
- Table 10: Canada NA Electric Drives Market Revenue (undefined) Forecast, by Application 2020 & 2033
- Table 11: Mexico NA Electric Drives Market Revenue (undefined) Forecast, by Application 2020 & 2033
- Table 12: Global NA Electric Drives Market Revenue undefined Forecast, by Type 2020 & 2033
- Table 13: Global NA Electric Drives Market Revenue undefined Forecast, by Voltage 2020 & 2033
- Table 14: Global NA Electric Drives Market Revenue undefined Forecast, by End-user Industry 2020 & 2033
- Table 15: Global NA Electric Drives Market Revenue undefined Forecast, by Country 2020 & 2033
- Table 16: Brazil NA Electric Drives Market Revenue (undefined) Forecast, by Application 2020 & 2033
- Table 17: Argentina NA Electric Drives Market Revenue (undefined) Forecast, by Application 2020 & 2033
- Table 18: Rest of South America NA Electric Drives Market Revenue (undefined) Forecast, by Application 2020 & 2033
- Table 19: Global NA Electric Drives Market Revenue undefined Forecast, by Type 2020 & 2033
- Table 20: Global NA Electric Drives Market Revenue undefined Forecast, by Voltage 2020 & 2033
- Table 21: Global NA Electric Drives Market Revenue undefined Forecast, by End-user Industry 2020 & 2033
- Table 22: Global NA Electric Drives Market Revenue undefined Forecast, by Country 2020 & 2033
- Table 23: United Kingdom NA Electric Drives Market Revenue (undefined) Forecast, by Application 2020 & 2033
- Table 24: Germany NA Electric Drives Market Revenue (undefined) Forecast, by Application 2020 & 2033
- Table 25: France NA Electric Drives Market Revenue (undefined) Forecast, by Application 2020 & 2033
- Table 26: Italy NA Electric Drives Market Revenue (undefined) Forecast, by Application 2020 & 2033
- Table 27: Spain NA Electric Drives Market Revenue (undefined) Forecast, by Application 2020 & 2033
- Table 28: Russia NA Electric Drives Market Revenue (undefined) Forecast, by Application 2020 & 2033
- Table 29: Benelux NA Electric Drives Market Revenue (undefined) Forecast, by Application 2020 & 2033
- Table 30: Nordics NA Electric Drives Market Revenue (undefined) Forecast, by Application 2020 & 2033
- Table 31: Rest of Europe NA Electric Drives Market Revenue (undefined) Forecast, by Application 2020 & 2033
- Table 32: Global NA Electric Drives Market Revenue undefined Forecast, by Type 2020 & 2033
- Table 33: Global NA Electric Drives Market Revenue undefined Forecast, by Voltage 2020 & 2033
- Table 34: Global NA Electric Drives Market Revenue undefined Forecast, by End-user Industry 2020 & 2033
- Table 35: Global NA Electric Drives Market Revenue undefined Forecast, by Country 2020 & 2033
- Table 36: Turkey NA Electric Drives Market Revenue (undefined) Forecast, by Application 2020 & 2033
- Table 37: Israel NA Electric Drives Market Revenue (undefined) Forecast, by Application 2020 & 2033
- Table 38: GCC NA Electric Drives Market Revenue (undefined) Forecast, by Application 2020 & 2033
- Table 39: North Africa NA Electric Drives Market Revenue (undefined) Forecast, by Application 2020 & 2033
- Table 40: South Africa NA Electric Drives Market Revenue (undefined) Forecast, by Application 2020 & 2033
- Table 41: Rest of Middle East & Africa NA Electric Drives Market Revenue (undefined) Forecast, by Application 2020 & 2033
- Table 42: Global NA Electric Drives Market Revenue undefined Forecast, by Type 2020 & 2033
- Table 43: Global NA Electric Drives Market Revenue undefined Forecast, by Voltage 2020 & 2033
- Table 44: Global NA Electric Drives Market Revenue undefined Forecast, by End-user Industry 2020 & 2033
- Table 45: Global NA Electric Drives Market Revenue undefined Forecast, by Country 2020 & 2033
- Table 46: China NA Electric Drives Market Revenue (undefined) Forecast, by Application 2020 & 2033
- Table 47: India NA Electric Drives Market Revenue (undefined) Forecast, by Application 2020 & 2033
- Table 48: Japan NA Electric Drives Market Revenue (undefined) Forecast, by Application 2020 & 2033
- Table 49: South Korea NA Electric Drives Market Revenue (undefined) Forecast, by Application 2020 & 2033
- Table 50: ASEAN NA Electric Drives Market Revenue (undefined) Forecast, by Application 2020 & 2033
- Table 51: Oceania NA Electric Drives Market Revenue (undefined) Forecast, by Application 2020 & 2033
- Table 52: Rest of Asia Pacific NA Electric Drives Market Revenue (undefined) Forecast, by Application 2020 & 2033
Frequently Asked Questions
1. What is the projected Compound Annual Growth Rate (CAGR) of the NA Electric Drives Market?
The projected CAGR is approximately 4.1%.
2. Which companies are prominent players in the NA Electric Drives Market?
Key companies in the market include Rockwell Automation, ABB Ltd, Fuji Electric Co Ltd *List Not Exhaustive, Danfoss, Toshiba International Corporation, Nidec Corporation, Emerson Electric Co, Mitsubishi Electric Corporation, Siemens AG, Schneider Electric.
3. What are the main segments of the NA Electric Drives Market?
The market segments include Type, Voltage, End-user Industry.
4. Can you provide details about the market size?
The market size is estimated to be USD XXX N/A as of 2022.
5. What are some drivers contributing to market growth?
Increasing Adoption of Automation; Signficant Growth in Manufacturing Sector.
6. What are the notable trends driving market growth?
Servo Drives are Analyzed to Hold Significant Share.
7. Are there any restraints impacting market growth?
High Costs of Electric Drive.
8. Can you provide examples of recent developments in the market?
March 2021 - Yaskawa Electric Corporation introduced the "-X Series" of AC servo drives, which is the successor to the well-known "Σ-7 Series." The company developed the "Σ-X Series" as a successor to the "Σ-7 Series," which adds the functions of using sensor data, and more advanced functionality and performance.
9. What pricing options are available for accessing the report?
Pricing options include single-user, multi-user, and enterprise licenses priced at USD 4750, USD 4950, and USD 6800 respectively.
10. Is the market size provided in terms of value or volume?
The market size is provided in terms of value, measured in N/A.
11. Are there any specific market keywords associated with the report?
Yes, the market keyword associated with the report is "NA Electric Drives Market," which aids in identifying and referencing the specific market segment covered.
12. How do I determine which pricing option suits my needs best?
The pricing options vary based on user requirements and access needs. Individual users may opt for single-user licenses, while businesses requiring broader access may choose multi-user or enterprise licenses for cost-effective access to the report.
13. Are there any additional resources or data provided in the NA Electric Drives Market report?
While the report offers comprehensive insights, it's advisable to review the specific contents or supplementary materials provided to ascertain if additional resources or data are available.
14. How can I stay updated on further developments or reports in the NA Electric Drives Market?
To stay informed about further developments, trends, and reports in the NA Electric Drives Market, consider subscribing to industry newsletters, following relevant companies and organizations, or regularly checking reputable industry news sources and publications.
Methodology
Step 1 - Identification of Relevant Samples Size from Population Database


Step 2 - Approaches for Defining Global Market Size (Value, Volume* & Price*)

Note*: In applicable scenarios
Step 3 - Data Sources
Primary Research
- Web Analytics
- Survey Reports
- Research Institute
- Latest Research Reports
- Opinion Leaders
Secondary Research
- Annual Reports
- White Paper
- Latest Press Release
- Industry Association
- Paid Database
- Investor Presentations

Step 4 - Data Triangulation
Involves using different sources of information in order to increase the validity of a study
These sources are likely to be stakeholders in a program - participants, other researchers, program staff, other community members, and so on.
Then we put all data in single framework & apply various statistical tools to find out the dynamic on the market.
During the analysis stage, feedback from the stakeholder groups would be compared to determine areas of agreement as well as areas of divergence