

Key Insights
The Non-Destructive Testing (NDT) for Infrastructure Inspections Market is poised for significant expansion, driven by aging global infrastructure, stringent safety mandates, and a growing emphasis on proactive maintenance. The market was valued at approximately 10.36 billion in 2025 and is forecast to achieve a Compound Annual Growth Rate (CAGR) of 7.8% between 2025 and 2033. Key growth drivers include the robust expansion of the construction sector worldwide, demanding rigorous inspections for structural integrity. The industrial and real estate sectors are also increasingly adopting NDT methods to mitigate costly failures and optimize operational efficiency. Technological advancements in NDT, particularly the wider adoption of sophisticated imaging techniques such as laser scanning and thermography, further stimulate market growth. While initial NDT equipment and service investments can be substantial, the long-term cost savings from preventing catastrophic failures and extending asset lifespans present a compelling economic case. North America and Europe currently lead market share due to mature infrastructure and stringent regulations, though the Asia-Pacific region's rapid development is expected to fuel substantial future growth.
NDT Infrastructure Inspections Market Market Size (In Billion)
Within NDT technologies, radiographic, ultrasonic, and magnetic particle testing remain foundational due to their proven reliability. However, emerging technologies like acoustic emission testing, thermography, and laser scanning are gaining prominence for their enhanced precision and efficiency, especially in complex infrastructure assessments. The market is also observing a trend towards service-centric models, with specialized inspection firms providing critical expertise and advanced technology. Competitive dynamics are robust, featuring both large multinational corporations and niche NDT providers. Overall, the market offers substantial growth prospects, underscored by the critical need for effective global infrastructure inspection and maintenance. Future expansion will likely depend on continued technological innovation, supportive regulatory environments, and increasing recognition of the long-term economic advantages of preventative maintenance strategies.
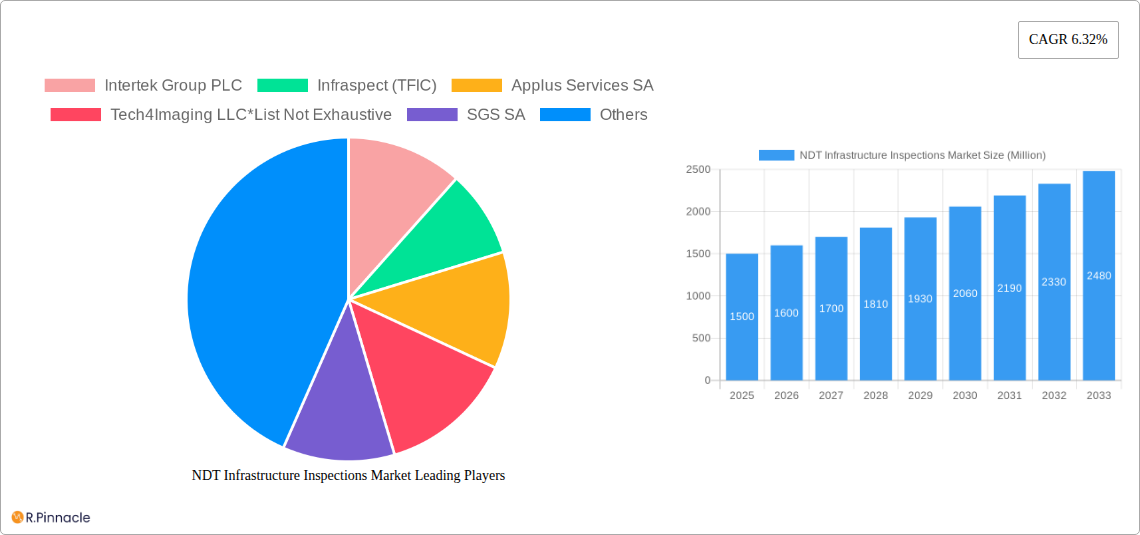
NDT Infrastructure Inspections Market Company Market Share
NDT Infrastructure Inspections Market Report: 2019-2033
This comprehensive report provides a detailed analysis of the NDT Infrastructure Inspections Market, offering invaluable insights for industry professionals, investors, and strategic decision-makers. Covering the period from 2019 to 2033, with a focus on 2025, this report examines market dynamics, key players, technological advancements, and future growth potential. The market is projected to reach xx Million by 2033, showcasing significant growth opportunities.
NDT Infrastructure Inspections Market Market Structure & Innovation Trends
The NDT Infrastructure Inspections Market is characterized by a moderately concentrated structure, with several key players holding significant market share. Intertek Group PLC, Applus Services SA, SGS SA, Mistras Group Inc, and Bureau Veritas SA are among the leading companies, collectively accounting for an estimated xx% of the global market in 2025. However, the market also features several smaller, specialized firms, indicating a dynamic competitive landscape.
- Market Concentration: The Herfindahl-Hirschman Index (HHI) is estimated at xx, suggesting a moderately concentrated market.
- Innovation Drivers: Stringent safety regulations, the aging global infrastructure, and the increasing demand for efficient and reliable inspection methods are key innovation drivers. Advancements in technologies like AI-powered analysis and robotic inspection systems are further shaping the market.
- Regulatory Frameworks: Government regulations concerning infrastructure safety and maintenance significantly impact market growth. Compliance requirements drive demand for NDT services and equipment.
- Product Substitutes: Limited direct substitutes exist for NDT methods in critical infrastructure inspections, reinforcing the market's stability.
- End-User Demographics: The market is largely driven by governmental and private sector organizations responsible for maintaining and upgrading infrastructure assets in various sectors (construction, industrial, real estate).
- M&A Activities: The market has witnessed several mergers and acquisitions in recent years, with deal values totaling an estimated xx Million in the period 2019-2024. These activities aim to enhance technological capabilities, expand service offerings, and gain market share.
NDT Infrastructure Inspections Market Market Dynamics & Trends
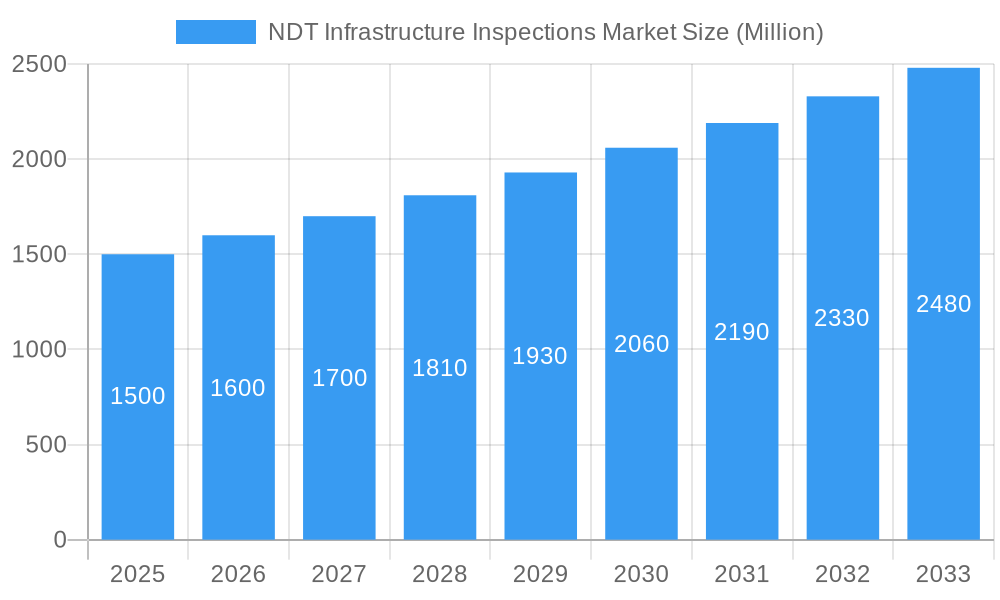
The NDT Infrastructure Inspections Market is experiencing robust growth, driven by several key factors. The aging infrastructure in developed and developing nations necessitates frequent inspections, fueling demand for NDT services and equipment. Increasing government spending on infrastructure development and maintenance further contributes to market expansion. Technological advancements, such as the integration of AI and automation, are improving inspection efficiency and accuracy, while also driving down costs. This has led to a CAGR of xx% during the historical period (2019-2024) and is projected to continue at a CAGR of xx% during the forecast period (2025-2033). Market penetration is currently estimated at xx% and expected to increase to xx% by 2033. Competitive dynamics are characterized by both cooperation and competition, with companies forming strategic partnerships while also vying for market share through technological innovation and service diversification. Growing consumer preference for reliable and efficient infrastructure inspection methods is a driving factor.
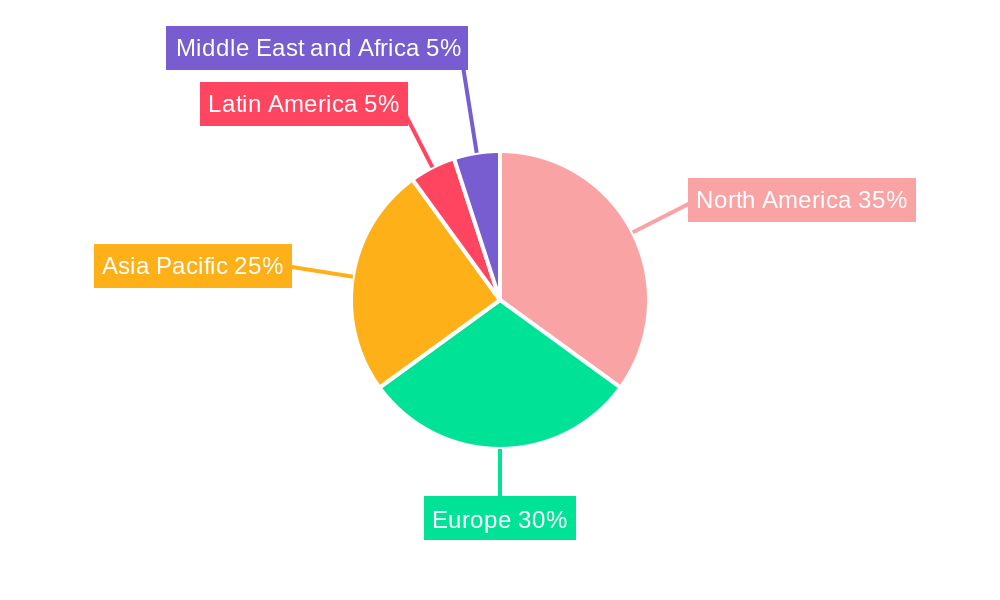
Dominant Regions & Segments in NDT Infrastructure Inspections Market
North America is currently the dominant region in the NDT Infrastructure Inspections Market, followed by Europe and Asia-Pacific. This dominance is largely attributed to robust infrastructure spending, stringent safety regulations, and the presence of major market players.
Key Drivers by Region:
- North America: Significant government investment in infrastructure projects, strict regulatory frameworks, and a high concentration of key players.
- Europe: Expanding infrastructure networks, increasing adoption of advanced NDT technologies, and favorable government policies.
- Asia-Pacific: Rapid urbanization, rising infrastructure investment, and growing awareness of infrastructure safety.
Dominant Segments:
- End-User Industry: The Construction Industry currently holds the largest market share, driven by the need for rigorous quality control throughout the construction lifecycle.
- Type: Services segment accounts for a larger share than equipment, reflecting the strong demand for specialized expertise in conducting and interpreting NDT inspections.
- Technology: Ultrasonic Testing and Radiographic Testing currently dominate the technology segment, owing to their widespread application and proven reliability.
NDT Infrastructure Inspections Market Product Innovations
Recent product developments focus on enhancing the speed, accuracy, and efficiency of NDT inspections. The integration of AI and machine learning algorithms allows for automated defect detection and analysis, minimizing human error and improving overall efficiency. Portable and lightweight inspection equipment improves accessibility and reduces inspection time. These innovations address the growing demand for cost-effective and time-efficient solutions, and better serve various infrastructure types and conditions. The focus is on improving user experience and data analysis tools.
Report Scope & Segmentation Analysis
This report segments the NDT Infrastructure Inspections Market based on end-user industry (Construction, Industrial, Real Estate, Other), type (Equipment, Services), and technology (Radiographic Testing, Ultrasonic Testing, Magnetic Particle Testing, Liquid Penetrant Testing, Visual Testing, Acoustic Emission Testing, Thermography Testing, Laser Scanning Testing, Other). Each segment is analyzed in detail, providing insights into market size, growth projections, and competitive dynamics. Growth projections vary significantly across segments, with the services segment exhibiting the highest projected growth rate. Competitive dynamics are shaped by technological innovation, service differentiation, and strategic partnerships.
Key Drivers of NDT Infrastructure Inspections Market Growth
The market's growth is driven by several key factors:
- Aging Infrastructure: The need for regular inspections and maintenance of aging infrastructure across the globe.
- Increased Government Spending: Rising government investment in infrastructure development and modernization projects.
- Stringent Safety Regulations: Compliance requirements driving demand for reliable and accurate inspection methods.
- Technological Advancements: Improvements in NDT technologies, enhancing efficiency and accuracy.
Challenges in the NDT Infrastructure Inspections Market Sector
Several challenges hinder market growth:
- High Initial Investment Costs: The cost of acquiring advanced NDT equipment can be significant, particularly for smaller companies.
- Skilled Labor Shortage: A shortage of qualified personnel skilled in performing and interpreting NDT inspections.
- Data Management and Analysis: The complexity of managing and analyzing large datasets generated during inspections.
Emerging Opportunities in NDT Infrastructure Inspections Market
Emerging opportunities include:
- Advancements in AI and Automation: Integration of AI and machine learning algorithms for automated defect detection and analysis.
- Development of New NDT Technologies: Research and development of innovative NDT technologies to improve efficiency and accuracy.
- Expansion into Emerging Markets: Growing demand for NDT services in developing economies.
Leading Players in the NDT Infrastructure Inspections Market Market
- Intertek Group PLC
- Infraspect (TFIC)
- Applus Services SA
- Tech4Imaging LLC
- SGS SA
- Mistras Group Inc
- Acuren Group Inc
- ROSEN Group
- Bureau Veritas SA
- Olympus Corporation
- Teledyne FLIR LLC
Key Developments in NDT Infrastructure Inspections Market Industry
- November 2022: Toshiba Corporation developed the Sliding Sheet-Lattice Matrix (SSLM) for ultrasonic NDT, eliminating the need for liquid couplants. This enhances the efficiency and usability of ultrasonic testing.
- September 2022: JME Ltd. partnered with DÜRR NDT to improve its DXB:1 NDT system with D-Tect X imaging software, enhancing its effectiveness for infrastructure testing, particularly pipeline weld inspections.
Future Outlook for NDT Infrastructure Inspections Market Market
The NDT Infrastructure Inspections Market is poised for significant growth in the coming years. Continued investment in infrastructure, the adoption of advanced technologies, and increasing awareness of infrastructure safety will drive market expansion. Strategic partnerships, technological innovations, and expansion into new markets represent key opportunities for market players. The market is expected to experience substantial growth, driven by the need for robust and reliable infrastructure inspections globally.
NDT Infrastructure Inspections Market Segmentation
-
1. Type
- 1.1. Equipment
- 1.2. Services
-
2. Technology
- 2.1. Radiographic Testing
- 2.2. Ultrasonic Testing
- 2.3. Magnetic Particle Testing
- 2.4. Liquid Penetrant Testing
- 2.5. Visual Testing
- 2.6. Acoustic Emission Testing
- 2.7. Thermography Testing
- 2.8. Laser Scanning Testing
- 2.9. Other Technologies
-
3. End-user Industry
- 3.1. Construction Industry
- 3.2. Industrial Sector
- 3.3. Real Estate Industry
- 3.4. Other End-user Industries
NDT Infrastructure Inspections Market Segmentation By Geography
- 1. North America
- 2. Europe
- 3. Asia Pacific
- 4. Latin America
- 5. Middle East and Africa
NDT Infrastructure Inspections Market Regional Market Share
Geographic Coverage of NDT Infrastructure Inspections Market
NDT Infrastructure Inspections Market REPORT HIGHLIGHTS
| Aspects | Details |
|---|---|
| Study Period | 2020-2034 |
| Base Year | 2025 |
| Estimated Year | 2026 |
| Forecast Period | 2026-2034 |
| Historical Period | 2020-2025 |
| Growth Rate | CAGR of 7.8% from 2020-2034 |
| Segmentation |
|
Table of Contents
- 1. Introduction
- 1.1. Research Scope
- 1.2. Market Segmentation
- 1.3. Research Objective
- 1.4. Definitions and Assumptions
- 2. Executive Summary
- 2.1. Market Snapshot
- 3. Market Dynamics
- 3.1. Market Drivers
- 3.2. Market Restrains
- 3.3. Market Trends
- 3.4. Market Opportunities
- 4. Market Factor Analysis
- 4.1. Porters Five Forces
- 4.1.1. Bargaining Power of Suppliers
- 4.1.2. Bargaining Power of Buyers
- 4.1.3. Threat of New Entrants
- 4.1.4. Threat of Substitutes
- 4.1.5. Competitive Rivalry
- 4.2. PESTEL analysis
- 4.3. BCG Analysis
- 4.3.1. Stars (High Growth, High Market Share)
- 4.3.2. Cash Cows (Low Growth, High Market Share)
- 4.3.3. Question Mark (High Growth, Low Market Share)
- 4.3.4. Dogs (Low Growth, Low Market Share)
- 4.4. Ansoff Matrix Analysis
- 4.5. Supply Chain Analysis
- 4.6. Regulatory Landscape
- 4.7. Current Market Potential and Opportunity Assessment (TAM–SAM–SOM Framework)
- 4.8. PRI Analyst Note
- 4.1. Porters Five Forces
- 5. Market Analysis, Insights and Forecast 2021-2033
- 5.1. Market Analysis, Insights and Forecast - by Type
- 5.1.1. Equipment
- 5.1.2. Services
- 5.2. Market Analysis, Insights and Forecast - by Technology
- 5.2.1. Radiographic Testing
- 5.2.2. Ultrasonic Testing
- 5.2.3. Magnetic Particle Testing
- 5.2.4. Liquid Penetrant Testing
- 5.2.5. Visual Testing
- 5.2.6. Acoustic Emission Testing
- 5.2.7. Thermography Testing
- 5.2.8. Laser Scanning Testing
- 5.2.9. Other Technologies
- 5.3. Market Analysis, Insights and Forecast - by End-user Industry
- 5.3.1. Construction Industry
- 5.3.2. Industrial Sector
- 5.3.3. Real Estate Industry
- 5.3.4. Other End-user Industries
- 5.4. Market Analysis, Insights and Forecast - by Region
- 5.4.1. North America
- 5.4.2. Europe
- 5.4.3. Asia Pacific
- 5.4.4. Latin America
- 5.4.5. Middle East and Africa
- 5.1. Market Analysis, Insights and Forecast - by Type
- 6. Global NDT Infrastructure Inspections Market Analysis, Insights and Forecast, 2021-2033
- 6.1. Market Analysis, Insights and Forecast - by Type
- 6.1.1. Equipment
- 6.1.2. Services
- 6.2. Market Analysis, Insights and Forecast - by Technology
- 6.2.1. Radiographic Testing
- 6.2.2. Ultrasonic Testing
- 6.2.3. Magnetic Particle Testing
- 6.2.4. Liquid Penetrant Testing
- 6.2.5. Visual Testing
- 6.2.6. Acoustic Emission Testing
- 6.2.7. Thermography Testing
- 6.2.8. Laser Scanning Testing
- 6.2.9. Other Technologies
- 6.3. Market Analysis, Insights and Forecast - by End-user Industry
- 6.3.1. Construction Industry
- 6.3.2. Industrial Sector
- 6.3.3. Real Estate Industry
- 6.3.4. Other End-user Industries
- 6.1. Market Analysis, Insights and Forecast - by Type
- 7. North America NDT Infrastructure Inspections Market Analysis, Insights and Forecast, 2020-2032
- 7.1. Market Analysis, Insights and Forecast - by Type
- 7.1.1. Equipment
- 7.1.2. Services
- 7.2. Market Analysis, Insights and Forecast - by Technology
- 7.2.1. Radiographic Testing
- 7.2.2. Ultrasonic Testing
- 7.2.3. Magnetic Particle Testing
- 7.2.4. Liquid Penetrant Testing
- 7.2.5. Visual Testing
- 7.2.6. Acoustic Emission Testing
- 7.2.7. Thermography Testing
- 7.2.8. Laser Scanning Testing
- 7.2.9. Other Technologies
- 7.3. Market Analysis, Insights and Forecast - by End-user Industry
- 7.3.1. Construction Industry
- 7.3.2. Industrial Sector
- 7.3.3. Real Estate Industry
- 7.3.4. Other End-user Industries
- 7.1. Market Analysis, Insights and Forecast - by Type
- 8. Europe NDT Infrastructure Inspections Market Analysis, Insights and Forecast, 2020-2032
- 8.1. Market Analysis, Insights and Forecast - by Type
- 8.1.1. Equipment
- 8.1.2. Services
- 8.2. Market Analysis, Insights and Forecast - by Technology
- 8.2.1. Radiographic Testing
- 8.2.2. Ultrasonic Testing
- 8.2.3. Magnetic Particle Testing
- 8.2.4. Liquid Penetrant Testing
- 8.2.5. Visual Testing
- 8.2.6. Acoustic Emission Testing
- 8.2.7. Thermography Testing
- 8.2.8. Laser Scanning Testing
- 8.2.9. Other Technologies
- 8.3. Market Analysis, Insights and Forecast - by End-user Industry
- 8.3.1. Construction Industry
- 8.3.2. Industrial Sector
- 8.3.3. Real Estate Industry
- 8.3.4. Other End-user Industries
- 8.1. Market Analysis, Insights and Forecast - by Type
- 9. Asia Pacific NDT Infrastructure Inspections Market Analysis, Insights and Forecast, 2020-2032
- 9.1. Market Analysis, Insights and Forecast - by Type
- 9.1.1. Equipment
- 9.1.2. Services
- 9.2. Market Analysis, Insights and Forecast - by Technology
- 9.2.1. Radiographic Testing
- 9.2.2. Ultrasonic Testing
- 9.2.3. Magnetic Particle Testing
- 9.2.4. Liquid Penetrant Testing
- 9.2.5. Visual Testing
- 9.2.6. Acoustic Emission Testing
- 9.2.7. Thermography Testing
- 9.2.8. Laser Scanning Testing
- 9.2.9. Other Technologies
- 9.3. Market Analysis, Insights and Forecast - by End-user Industry
- 9.3.1. Construction Industry
- 9.3.2. Industrial Sector
- 9.3.3. Real Estate Industry
- 9.3.4. Other End-user Industries
- 9.1. Market Analysis, Insights and Forecast - by Type
- 10. Latin America NDT Infrastructure Inspections Market Analysis, Insights and Forecast, 2020-2032
- 10.1. Market Analysis, Insights and Forecast - by Type
- 10.1.1. Equipment
- 10.1.2. Services
- 10.2. Market Analysis, Insights and Forecast - by Technology
- 10.2.1. Radiographic Testing
- 10.2.2. Ultrasonic Testing
- 10.2.3. Magnetic Particle Testing
- 10.2.4. Liquid Penetrant Testing
- 10.2.5. Visual Testing
- 10.2.6. Acoustic Emission Testing
- 10.2.7. Thermography Testing
- 10.2.8. Laser Scanning Testing
- 10.2.9. Other Technologies
- 10.3. Market Analysis, Insights and Forecast - by End-user Industry
- 10.3.1. Construction Industry
- 10.3.2. Industrial Sector
- 10.3.3. Real Estate Industry
- 10.3.4. Other End-user Industries
- 10.1. Market Analysis, Insights and Forecast - by Type
- 11. Middle East and Africa NDT Infrastructure Inspections Market Analysis, Insights and Forecast, 2020-2032
- 11.1. Market Analysis, Insights and Forecast - by Type
- 11.1.1. Equipment
- 11.1.2. Services
- 11.2. Market Analysis, Insights and Forecast - by Technology
- 11.2.1. Radiographic Testing
- 11.2.2. Ultrasonic Testing
- 11.2.3. Magnetic Particle Testing
- 11.2.4. Liquid Penetrant Testing
- 11.2.5. Visual Testing
- 11.2.6. Acoustic Emission Testing
- 11.2.7. Thermography Testing
- 11.2.8. Laser Scanning Testing
- 11.2.9. Other Technologies
- 11.3. Market Analysis, Insights and Forecast - by End-user Industry
- 11.3.1. Construction Industry
- 11.3.2. Industrial Sector
- 11.3.3. Real Estate Industry
- 11.3.4. Other End-user Industries
- 11.1. Market Analysis, Insights and Forecast - by Type
- 12. Competitive Analysis
- 12.1. Company Profiles
- 12.1.1 Intertek Group PLC
- 12.1.1.1. Company Overview
- 12.1.1.2. Products
- 12.1.1.3. Company Financials
- 12.1.1.4. SWOT Analysis
- 12.1.2 Infraspect (TFIC)
- 12.1.2.1. Company Overview
- 12.1.2.2. Products
- 12.1.2.3. Company Financials
- 12.1.2.4. SWOT Analysis
- 12.1.3 Applus Services SA
- 12.1.3.1. Company Overview
- 12.1.3.2. Products
- 12.1.3.3. Company Financials
- 12.1.3.4. SWOT Analysis
- 12.1.4 Tech4Imaging LLC*List Not Exhaustive
- 12.1.4.1. Company Overview
- 12.1.4.2. Products
- 12.1.4.3. Company Financials
- 12.1.4.4. SWOT Analysis
- 12.1.5 SGS SA
- 12.1.5.1. Company Overview
- 12.1.5.2. Products
- 12.1.5.3. Company Financials
- 12.1.5.4. SWOT Analysis
- 12.1.6 Mistras Group Inc
- 12.1.6.1. Company Overview
- 12.1.6.2. Products
- 12.1.6.3. Company Financials
- 12.1.6.4. SWOT Analysis
- 12.1.7 Acuren Group Inc
- 12.1.7.1. Company Overview
- 12.1.7.2. Products
- 12.1.7.3. Company Financials
- 12.1.7.4. SWOT Analysis
- 12.1.8 ROSEN Group
- 12.1.8.1. Company Overview
- 12.1.8.2. Products
- 12.1.8.3. Company Financials
- 12.1.8.4. SWOT Analysis
- 12.1.9 Bureau Veritas SA
- 12.1.9.1. Company Overview
- 12.1.9.2. Products
- 12.1.9.3. Company Financials
- 12.1.9.4. SWOT Analysis
- 12.1.10 Olympus Corporation
- 12.1.10.1. Company Overview
- 12.1.10.2. Products
- 12.1.10.3. Company Financials
- 12.1.10.4. SWOT Analysis
- 12.1.11 Teledyne FLIR LLC
- 12.1.11.1. Company Overview
- 12.1.11.2. Products
- 12.1.11.3. Company Financials
- 12.1.11.4. SWOT Analysis
- 12.1.1 Intertek Group PLC
- 12.2. Market Entropy
- 12.2.1 Company's Key Areas Served
- 12.2.2 Recent Developments
- 12.3. Company Market Share Analysis 2025
- 12.3.1 Top 5 Companies Market Share Analysis
- 12.3.2 Top 3 Companies Market Share Analysis
- 12.4. List of Potential Customers
- 13. Research Methodology
List of Figures
- Figure 1: Global NDT Infrastructure Inspections Market Revenue Breakdown (billion, %) by Region 2025 & 2033
- Figure 2: North America NDT Infrastructure Inspections Market Revenue (billion), by Type 2025 & 2033
- Figure 3: North America NDT Infrastructure Inspections Market Revenue Share (%), by Type 2025 & 2033
- Figure 4: North America NDT Infrastructure Inspections Market Revenue (billion), by Technology 2025 & 2033
- Figure 5: North America NDT Infrastructure Inspections Market Revenue Share (%), by Technology 2025 & 2033
- Figure 6: North America NDT Infrastructure Inspections Market Revenue (billion), by End-user Industry 2025 & 2033
- Figure 7: North America NDT Infrastructure Inspections Market Revenue Share (%), by End-user Industry 2025 & 2033
- Figure 8: North America NDT Infrastructure Inspections Market Revenue (billion), by Country 2025 & 2033
- Figure 9: North America NDT Infrastructure Inspections Market Revenue Share (%), by Country 2025 & 2033
- Figure 10: Europe NDT Infrastructure Inspections Market Revenue (billion), by Type 2025 & 2033
- Figure 11: Europe NDT Infrastructure Inspections Market Revenue Share (%), by Type 2025 & 2033
- Figure 12: Europe NDT Infrastructure Inspections Market Revenue (billion), by Technology 2025 & 2033
- Figure 13: Europe NDT Infrastructure Inspections Market Revenue Share (%), by Technology 2025 & 2033
- Figure 14: Europe NDT Infrastructure Inspections Market Revenue (billion), by End-user Industry 2025 & 2033
- Figure 15: Europe NDT Infrastructure Inspections Market Revenue Share (%), by End-user Industry 2025 & 2033
- Figure 16: Europe NDT Infrastructure Inspections Market Revenue (billion), by Country 2025 & 2033
- Figure 17: Europe NDT Infrastructure Inspections Market Revenue Share (%), by Country 2025 & 2033
- Figure 18: Asia Pacific NDT Infrastructure Inspections Market Revenue (billion), by Type 2025 & 2033
- Figure 19: Asia Pacific NDT Infrastructure Inspections Market Revenue Share (%), by Type 2025 & 2033
- Figure 20: Asia Pacific NDT Infrastructure Inspections Market Revenue (billion), by Technology 2025 & 2033
- Figure 21: Asia Pacific NDT Infrastructure Inspections Market Revenue Share (%), by Technology 2025 & 2033
- Figure 22: Asia Pacific NDT Infrastructure Inspections Market Revenue (billion), by End-user Industry 2025 & 2033
- Figure 23: Asia Pacific NDT Infrastructure Inspections Market Revenue Share (%), by End-user Industry 2025 & 2033
- Figure 24: Asia Pacific NDT Infrastructure Inspections Market Revenue (billion), by Country 2025 & 2033
- Figure 25: Asia Pacific NDT Infrastructure Inspections Market Revenue Share (%), by Country 2025 & 2033
- Figure 26: Latin America NDT Infrastructure Inspections Market Revenue (billion), by Type 2025 & 2033
- Figure 27: Latin America NDT Infrastructure Inspections Market Revenue Share (%), by Type 2025 & 2033
- Figure 28: Latin America NDT Infrastructure Inspections Market Revenue (billion), by Technology 2025 & 2033
- Figure 29: Latin America NDT Infrastructure Inspections Market Revenue Share (%), by Technology 2025 & 2033
- Figure 30: Latin America NDT Infrastructure Inspections Market Revenue (billion), by End-user Industry 2025 & 2033
- Figure 31: Latin America NDT Infrastructure Inspections Market Revenue Share (%), by End-user Industry 2025 & 2033
- Figure 32: Latin America NDT Infrastructure Inspections Market Revenue (billion), by Country 2025 & 2033
- Figure 33: Latin America NDT Infrastructure Inspections Market Revenue Share (%), by Country 2025 & 2033
- Figure 34: Middle East and Africa NDT Infrastructure Inspections Market Revenue (billion), by Type 2025 & 2033
- Figure 35: Middle East and Africa NDT Infrastructure Inspections Market Revenue Share (%), by Type 2025 & 2033
- Figure 36: Middle East and Africa NDT Infrastructure Inspections Market Revenue (billion), by Technology 2025 & 2033
- Figure 37: Middle East and Africa NDT Infrastructure Inspections Market Revenue Share (%), by Technology 2025 & 2033
- Figure 38: Middle East and Africa NDT Infrastructure Inspections Market Revenue (billion), by End-user Industry 2025 & 2033
- Figure 39: Middle East and Africa NDT Infrastructure Inspections Market Revenue Share (%), by End-user Industry 2025 & 2033
- Figure 40: Middle East and Africa NDT Infrastructure Inspections Market Revenue (billion), by Country 2025 & 2033
- Figure 41: Middle East and Africa NDT Infrastructure Inspections Market Revenue Share (%), by Country 2025 & 2033
List of Tables
- Table 1: Global NDT Infrastructure Inspections Market Revenue billion Forecast, by Type 2020 & 2033
- Table 2: Global NDT Infrastructure Inspections Market Revenue billion Forecast, by Technology 2020 & 2033
- Table 3: Global NDT Infrastructure Inspections Market Revenue billion Forecast, by End-user Industry 2020 & 2033
- Table 4: Global NDT Infrastructure Inspections Market Revenue billion Forecast, by Region 2020 & 2033
- Table 5: Global NDT Infrastructure Inspections Market Revenue billion Forecast, by Type 2020 & 2033
- Table 6: Global NDT Infrastructure Inspections Market Revenue billion Forecast, by Technology 2020 & 2033
- Table 7: Global NDT Infrastructure Inspections Market Revenue billion Forecast, by End-user Industry 2020 & 2033
- Table 8: Global NDT Infrastructure Inspections Market Revenue billion Forecast, by Country 2020 & 2033
- Table 9: Global NDT Infrastructure Inspections Market Revenue billion Forecast, by Type 2020 & 2033
- Table 10: Global NDT Infrastructure Inspections Market Revenue billion Forecast, by Technology 2020 & 2033
- Table 11: Global NDT Infrastructure Inspections Market Revenue billion Forecast, by End-user Industry 2020 & 2033
- Table 12: Global NDT Infrastructure Inspections Market Revenue billion Forecast, by Country 2020 & 2033
- Table 13: Global NDT Infrastructure Inspections Market Revenue billion Forecast, by Type 2020 & 2033
- Table 14: Global NDT Infrastructure Inspections Market Revenue billion Forecast, by Technology 2020 & 2033
- Table 15: Global NDT Infrastructure Inspections Market Revenue billion Forecast, by End-user Industry 2020 & 2033
- Table 16: Global NDT Infrastructure Inspections Market Revenue billion Forecast, by Country 2020 & 2033
- Table 17: Global NDT Infrastructure Inspections Market Revenue billion Forecast, by Type 2020 & 2033
- Table 18: Global NDT Infrastructure Inspections Market Revenue billion Forecast, by Technology 2020 & 2033
- Table 19: Global NDT Infrastructure Inspections Market Revenue billion Forecast, by End-user Industry 2020 & 2033
- Table 20: Global NDT Infrastructure Inspections Market Revenue billion Forecast, by Country 2020 & 2033
- Table 21: Global NDT Infrastructure Inspections Market Revenue billion Forecast, by Type 2020 & 2033
- Table 22: Global NDT Infrastructure Inspections Market Revenue billion Forecast, by Technology 2020 & 2033
- Table 23: Global NDT Infrastructure Inspections Market Revenue billion Forecast, by End-user Industry 2020 & 2033
- Table 24: Global NDT Infrastructure Inspections Market Revenue billion Forecast, by Country 2020 & 2033
Frequently Asked Questions
1. What is the projected Compound Annual Growth Rate (CAGR) of the NDT Infrastructure Inspections Market?
The projected CAGR is approximately 7.8%.
2. Which companies are prominent players in the NDT Infrastructure Inspections Market?
Key companies in the market include Intertek Group PLC, Infraspect (TFIC), Applus Services SA, Tech4Imaging LLC*List Not Exhaustive, SGS SA, Mistras Group Inc, Acuren Group Inc, ROSEN Group, Bureau Veritas SA, Olympus Corporation, Teledyne FLIR LLC.
3. What are the main segments of the NDT Infrastructure Inspections Market?
The market segments include Type, Technology, End-user Industry.
4. Can you provide details about the market size?
The market size is estimated to be USD 10.36 billion as of 2022.
5. What are some drivers contributing to market growth?
Stringent Regulations Mandating Safety Standard in the Infrastructure Industry; Growth in Infrastructure Maintenance Services.
6. What are the notable trends driving market growth?
Growing Investment in Construction Sector to Drive the Market's Growth.
7. Are there any restraints impacting market growth?
NDT Services In Other Industries Restraining the Growth of the Market.
8. Can you provide examples of recent developments in the market?
November 2022: Toshiba Corporation developed a Sliding Sheet-Lattice Matrix (SSLM) for ultrasonic nondestructive testing in infrastructure maintenance and inspections. SSLM does not require the application of a liquid couplant, such as liquid gel, and combines high performance for passing ultrasonic waves with smooth device operability.
9. What pricing options are available for accessing the report?
Pricing options include single-user, multi-user, and enterprise licenses priced at USD 4750, USD 5250, and USD 8750 respectively.
10. Is the market size provided in terms of value or volume?
The market size is provided in terms of value, measured in billion.
11. Are there any specific market keywords associated with the report?
Yes, the market keyword associated with the report is "NDT Infrastructure Inspections Market," which aids in identifying and referencing the specific market segment covered.
12. How do I determine which pricing option suits my needs best?
The pricing options vary based on user requirements and access needs. Individual users may opt for single-user licenses, while businesses requiring broader access may choose multi-user or enterprise licenses for cost-effective access to the report.
13. Are there any additional resources or data provided in the NDT Infrastructure Inspections Market report?
While the report offers comprehensive insights, it's advisable to review the specific contents or supplementary materials provided to ascertain if additional resources or data are available.
14. How can I stay updated on further developments or reports in the NDT Infrastructure Inspections Market?
To stay informed about further developments, trends, and reports in the NDT Infrastructure Inspections Market, consider subscribing to industry newsletters, following relevant companies and organizations, or regularly checking reputable industry news sources and publications.
Methodology
Step 1 - Identification of Relevant Samples Size from Population Database


Step 2 - Approaches for Defining Global Market Size (Value, Volume* & Price*)

Note*: In applicable scenarios
Step 3 - Data Sources
Primary Research
- Web Analytics
- Survey Reports
- Research Institute
- Latest Research Reports
- Opinion Leaders
Secondary Research
- Annual Reports
- White Paper
- Latest Press Release
- Industry Association
- Paid Database
- Investor Presentations

Step 4 - Data Triangulation
Involves using different sources of information in order to increase the validity of a study
These sources are likely to be stakeholders in a program - participants, other researchers, program staff, other community members, and so on.
Then we put all data in single framework & apply various statistical tools to find out the dynamic on the market.
During the analysis stage, feedback from the stakeholder groups would be compared to determine areas of agreement as well as areas of divergence