
Key Insights
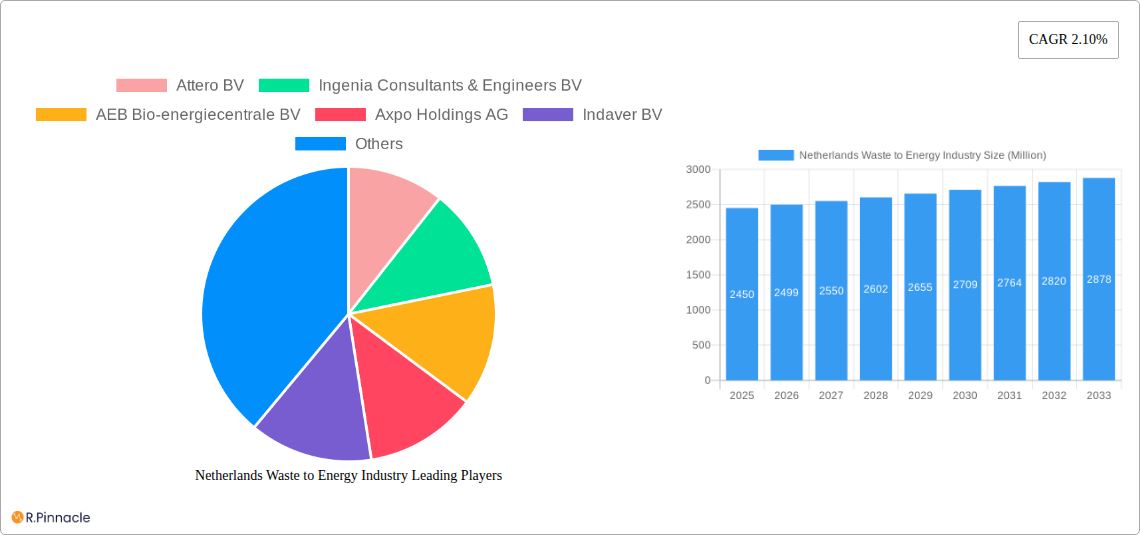
The Netherlands Waste-to-Energy (WtE) market, valued at €2.45 billion in 2025, is projected to experience steady growth, driven by stringent environmental regulations aimed at reducing landfill waste and increasing renewable energy generation. The country's commitment to circular economy principles fuels the demand for sustainable waste management solutions. Key technologies driving market expansion include incineration, anaerobic digestion, and gasification, each catering to specific waste streams. Municipal solid waste (MSW) constitutes a significant portion of the processed waste, followed by industrial and hazardous waste. The industrial sector, including manufacturing and processing facilities, is a major end-user, followed by commercial and residential sectors. While the market faces challenges such as high initial investment costs for WtE infrastructure and potential public resistance to certain technologies (e.g., incineration), these are being mitigated by government incentives and public awareness campaigns emphasizing the environmental benefits of WtE. Growth is further fueled by increasing energy prices and the need for energy independence. Leading players in the market are leveraging technological advancements to enhance efficiency and reduce environmental impact, driving further market expansion.
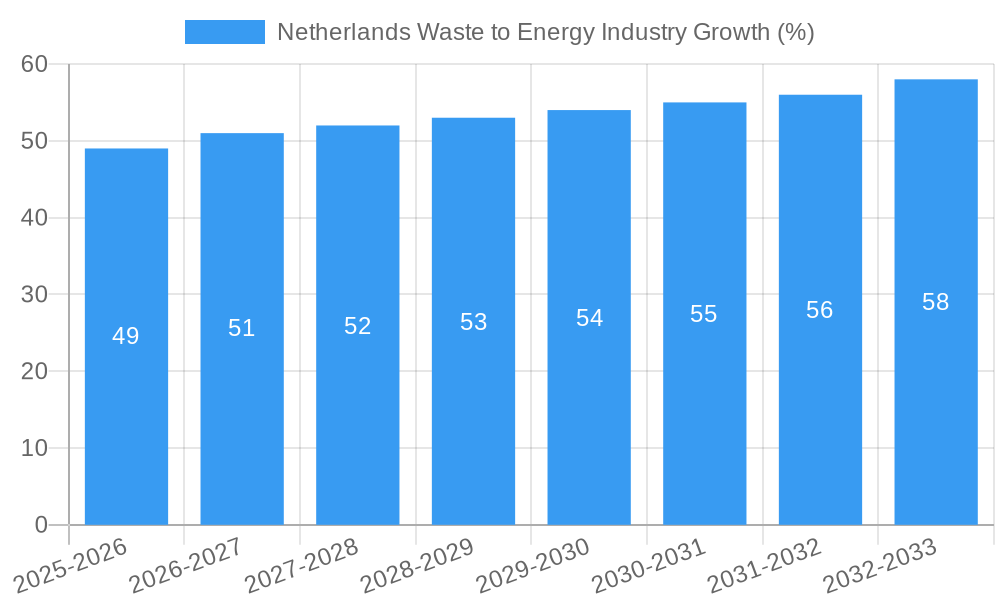
The projected Compound Annual Growth Rate (CAGR) of 2.10% suggests a continuous, albeit moderate, expansion of the Netherlands WtE market through 2033. This growth reflects a combination of factors, including the gradual increase in waste generation, stricter waste disposal regulations, and ongoing technological improvements leading to greater efficiency and cost-effectiveness. Regional variations within the Netherlands may exist, with urban areas likely exhibiting higher WtE adoption rates due to higher waste generation density and greater proximity to suitable facilities. The competitive landscape is characterized by a mix of both domestic and international companies, suggesting potential for both organic growth and mergers and acquisitions activity as the market matures. The focus on sustainable waste management aligns with the broader European Union's environmental goals, providing a supportive macro-economic environment for the continued expansion of the Dutch WtE sector.
Netherlands Waste to Energy Industry: 2019-2033 Market Report
This comprehensive report provides an in-depth analysis of the Netherlands waste-to-energy (WtE) industry, covering market structure, innovation trends, dynamics, and future outlook from 2019 to 2033. The report leverages data from the historical period (2019-2024), base year (2025), and forecast period (2025-2033) to offer actionable insights for industry professionals. Key players like Attero BV, Ingenia Consultants & Engineers BV, and AEB Bio-energiecentrale BV are analyzed, along with a detailed segmentation across technologies, waste types, and end-users.
Netherlands Waste to Energy Industry Market Structure & Innovation Trends
This section analyzes the competitive landscape of the Netherlands WtE market, encompassing market concentration, innovation drivers, regulatory frameworks, and M&A activities. The study period (2019-2033) reveals a dynamic market shaped by technological advancements and evolving environmental regulations.
- Market Concentration: The Netherlands WtE market exhibits a [xx]% market concentration, with [xx] major players holding a significant share. Attero BV and Indaver BV are estimated to hold a combined [xx]% market share in 2025, while smaller players contribute to a fragmented market landscape.
- Innovation Drivers: Government incentives promoting renewable energy and stricter waste management regulations are key drivers of innovation. The focus is on advanced technologies like gasification and pyrolysis, alongside carbon capture initiatives.
- Regulatory Framework: The Dutch government's stringent environmental regulations drive the adoption of cleaner WtE technologies. These regulations incentivize investment in carbon capture and the development of sustainable waste management solutions.
- Product Substitutes: Renewable energy sources like solar and wind power pose some competition, though WtE offers a unique solution for managing non-recyclable waste.
- End-User Demographics: Municipal Solid Waste (MSW) accounts for a major portion of the processed waste, followed by industrial and hazardous waste. The residential sector indirectly benefits through reduced landfill reliance.
- M&A Activities: The report identifies [xx] M&A deals within the study period, with a total estimated value of [xx] Million USD. These deals reflect consolidation trends and strategic expansion within the sector. [Include specific examples of M&A, if available].
Netherlands Waste to Energy Industry Market Dynamics & Trends
This section details the market's growth trajectory, focusing on key drivers, technological disruptions, and competitive dynamics. The Netherlands WtE market is expected to exhibit a [xx]% CAGR during the forecast period (2025-2033). This growth is driven by stringent waste management policies, increasing environmental awareness, and the ongoing development of innovative WtE technologies. Market penetration for advanced technologies like gasification is expected to increase from [xx]% in 2025 to [xx]% by 2033. Growing energy demand, coupled with the need for sustainable waste management practices, supports market expansion. Competitive dynamics are shaped by technological innovation, efficiency improvements, and strategic partnerships.
Dominant Regions & Segments in Netherlands Waste to Energy Industry
This section identifies dominant regions and segments within the Netherlands WtE industry.
- Leading Region: The [Name of region, e.g., Randstad] region is the leading area due to its high population density, industrial activity, and established waste management infrastructure.
- Dominant Technology: Incineration remains the dominant technology, holding approximately [xx]% market share in 2025, owing to its maturity and established infrastructure. However, gasification and anaerobic digestion are expected to gain traction due to their potential for higher energy recovery and reduced emissions.
- Dominant Waste Type: Municipal solid waste (MSW) comprises the largest share of processed waste, followed by industrial waste.
- Dominant End-User: The industrial sector is the major end-user due to the high energy demand in industries such as manufacturing and processing.
Key Drivers:
- Stringent Environmental Regulations: Encouraging the adoption of cleaner technologies.
- Government Incentives: Supporting investments in WtE projects.
- Growing Energy Demand: Increasing the need for alternative energy sources.
- Limited Landfill Capacity: Driving the need for alternative waste management solutions.
Netherlands Waste to Energy Industry Product Innovations
Recent innovations in WtE technology focus on enhancing energy efficiency, reducing emissions, and recovering valuable materials. Advances in gasification and pyrolysis are improving energy conversion rates and minimizing environmental impact. The integration of carbon capture technologies, as exemplified by Aker Carbon Capture's project at Twence, is further enhancing the sustainability profile of WtE plants. These advancements are improving market fit by meeting growing environmental standards and increasing energy production efficiency.
Report Scope & Segmentation Analysis
The report segments the Netherlands WtE market across various technologies (Incineration, Gasification, Pyrolysis, Anaerobic Digestion, Refuse-Derived Fuel), waste types (Municipal Solid Waste, Industrial Waste, Hazardous Waste, Agricultural Waste), and end-users (Industrial, Commercial, Residential). Each segment’s market size, growth projections, and competitive dynamics are analyzed. For instance, the Incineration segment is projected to grow at a [xx]% CAGR, driven by its established infrastructure and current market dominance. Conversely, the Anaerobic Digestion segment shows potential for significant growth, though from a smaller base, fueled by the rising focus on biogas production.
Key Drivers of Netherlands Waste to Energy Industry Growth
The Netherlands WtE industry's growth is primarily driven by stringent environmental regulations requiring sustainable waste management, increasing energy demands, and government incentives promoting renewable energy sources. Investments in carbon capture technologies further contribute to growth, improving the environmental profile of WtE plants and fostering investor confidence.
Challenges in the Netherlands Waste to Energy Industry Sector
Challenges include securing permits and navigating regulatory hurdles for new WtE facilities. Supply chain disruptions, especially regarding specialized equipment and materials, can impact project timelines and costs. Competition from other renewable energy sources also presents a challenge. These factors can lead to project delays and increased costs. For instance, the securing of required permits for a new WtE facility can take [xx] months, causing delays.
Emerging Opportunities in Netherlands Waste to Energy Industry
Emerging opportunities exist in advanced WtE technologies such as gasification and pyrolysis for higher energy recovery and reduced emissions. The increasing demand for renewable energy and stricter environmental regulations create a favorable market environment for innovative WtE solutions, particularly those incorporating carbon capture and utilization technologies. The development of new waste streams for processing and the integration of WtE with other renewable energy systems also offer further potential.
Leading Players in the Netherlands Waste to Energy Industry Market
- Attero BV
- Ingenia Consultants & Engineers BV
- AEB Bio-energiecentrale BV
- Axpo Holdings AG
- Indaver BV
- Dutch Incinerators BV
- AEB Amsterdam
- Mitsubishi Heavy Industries Ltd
Key Developments in Netherlands Waste to Energy Industry
- May 2022: Aker Carbon Capture commenced construction of a carbon capture plant at Twence's WtE facility in Hengelo, aiming to capture 100,000 metric tons of CO2 annually by the end of 2023, transforming captured carbon into liquid fertilizer.
- January 2023: RWE secured USD 117 Million from the EU Innovation Fund for a waste-to-hydrogen project, signaling significant investment in innovative WtE technologies in the Netherlands.
Future Outlook for Netherlands Waste to Energy Industry Market
The Netherlands WtE market is poised for continued growth, driven by sustained government support, technological advancements, and increasing environmental awareness. Focus on carbon capture and the development of advanced WtE technologies will play a pivotal role in shaping the industry's future. The integration of WtE with other renewable energy sources and the exploration of innovative waste streams present significant strategic opportunities.
Netherlands Waste to Energy Industry Segmentation
-
1. Technology
- 1.1. Incineration
- 1.2. Gasification
- 1.3. Pyrolysis
- 1.4. Anaerobic Digestion
- 1.5. Refuse-Derived Fuel
-
2. Waste Type
- 2.1. Municipal Solid Waste
- 2.2. Industrial Waste
- 2.3. Hazardous Waste
- 2.4. Agricultural Waste
-
3. End-User
- 3.1. Industrial
- 3.2. Commercial
- 3.3. Residential
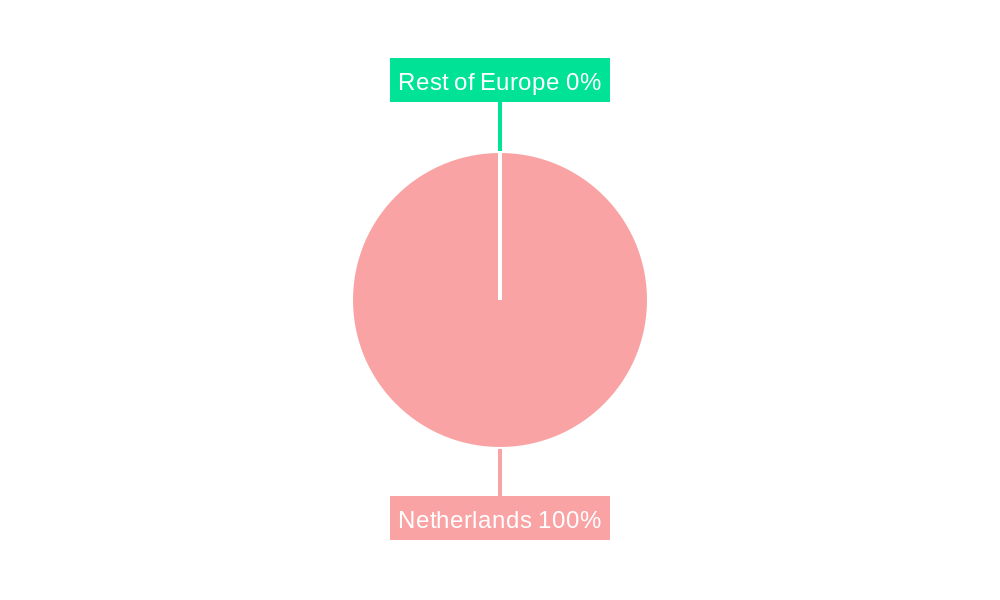
Netherlands Waste to Energy Industry Segmentation By Geography
- 1. Netherlands
Netherlands Waste to Energy Industry REPORT HIGHLIGHTS
| Aspects | Details |
|---|---|
| Study Period | 2019-2033 |
| Base Year | 2024 |
| Estimated Year | 2025 |
| Forecast Period | 2025-2033 |
| Historical Period | 2019-2024 |
| Growth Rate | CAGR of 2.10% from 2019-2033 |
| Segmentation |
|
Table of Contents
- 1. Introduction
- 1.1. Research Scope
- 1.2. Market Segmentation
- 1.3. Research Methodology
- 1.4. Definitions and Assumptions
- 2. Executive Summary
- 2.1. Introduction
- 3. Market Dynamics
- 3.1. Introduction
- 3.2. Market Drivers
- 3.2.1. Supportive Government Policies for Waste-to-Energy Plants4.; Increasing Investments in Waste-to-Energy Industries
- 3.3. Market Restrains
- 3.3.1. The Strict Regulation Imposed Against the Release of Harmful Gases When Trash is Burned
- 3.4. Market Trends
- 3.4.1. Thermal Technologies Segment to Dominate the Market
- 4. Market Factor Analysis
- 4.1. Porters Five Forces
- 4.2. Supply/Value Chain
- 4.3. PESTEL analysis
- 4.4. Market Entropy
- 4.5. Patent/Trademark Analysis
- 5. Netherlands Waste to Energy Industry Analysis, Insights and Forecast, 2019-2031
- 5.1. Market Analysis, Insights and Forecast - by Technology
- 5.1.1. Incineration
- 5.1.2. Gasification
- 5.1.3. Pyrolysis
- 5.1.4. Anaerobic Digestion
- 5.1.5. Refuse-Derived Fuel
- 5.2. Market Analysis, Insights and Forecast - by Waste Type
- 5.2.1. Municipal Solid Waste
- 5.2.2. Industrial Waste
- 5.2.3. Hazardous Waste
- 5.2.4. Agricultural Waste
- 5.3. Market Analysis, Insights and Forecast - by End-User
- 5.3.1. Industrial
- 5.3.2. Commercial
- 5.3.3. Residential
- 5.4. Market Analysis, Insights and Forecast - by Region
- 5.4.1. Netherlands
- 5.1. Market Analysis, Insights and Forecast - by Technology
- 6. Germany Netherlands Waste to Energy Industry Analysis, Insights and Forecast, 2019-2031
- 7. France Netherlands Waste to Energy Industry Analysis, Insights and Forecast, 2019-2031
- 8. Italy Netherlands Waste to Energy Industry Analysis, Insights and Forecast, 2019-2031
- 9. United Kingdom Netherlands Waste to Energy Industry Analysis, Insights and Forecast, 2019-2031
- 10. Netherlands Netherlands Waste to Energy Industry Analysis, Insights and Forecast, 2019-2031
- 11. Rest of Europe Netherlands Waste to Energy Industry Analysis, Insights and Forecast, 2019-2031
- 12. Competitive Analysis
- 12.1. Market Share Analysis 2024
- 12.2. Company Profiles
- 12.2.1 Attero BV
- 12.2.1.1. Overview
- 12.2.1.2. Products
- 12.2.1.3. SWOT Analysis
- 12.2.1.4. Recent Developments
- 12.2.1.5. Financials (Based on Availability)
- 12.2.2 Ingenia Consultants & Engineers BV
- 12.2.2.1. Overview
- 12.2.2.2. Products
- 12.2.2.3. SWOT Analysis
- 12.2.2.4. Recent Developments
- 12.2.2.5. Financials (Based on Availability)
- 12.2.3 AEB Bio-energiecentrale BV
- 12.2.3.1. Overview
- 12.2.3.2. Products
- 12.2.3.3. SWOT Analysis
- 12.2.3.4. Recent Developments
- 12.2.3.5. Financials (Based on Availability)
- 12.2.4 Axpo Holdings AG
- 12.2.4.1. Overview
- 12.2.4.2. Products
- 12.2.4.3. SWOT Analysis
- 12.2.4.4. Recent Developments
- 12.2.4.5. Financials (Based on Availability)
- 12.2.5 Indaver BV
- 12.2.5.1. Overview
- 12.2.5.2. Products
- 12.2.5.3. SWOT Analysis
- 12.2.5.4. Recent Developments
- 12.2.5.5. Financials (Based on Availability)
- 12.2.6 Dutch Incinerators BV
- 12.2.6.1. Overview
- 12.2.6.2. Products
- 12.2.6.3. SWOT Analysis
- 12.2.6.4. Recent Developments
- 12.2.6.5. Financials (Based on Availability)
- 12.2.7 AEB Amsterdam
- 12.2.7.1. Overview
- 12.2.7.2. Products
- 12.2.7.3. SWOT Analysis
- 12.2.7.4. Recent Developments
- 12.2.7.5. Financials (Based on Availability)
- 12.2.8 Mitsubishi Heavy Industries Ltd *List Not Exhaustive
- 12.2.8.1. Overview
- 12.2.8.2. Products
- 12.2.8.3. SWOT Analysis
- 12.2.8.4. Recent Developments
- 12.2.8.5. Financials (Based on Availability)
- 12.2.1 Attero BV
List of Figures
- Figure 1: Netherlands Waste to Energy Industry Revenue Breakdown (Million, %) by Product 2024 & 2032
- Figure 2: Netherlands Waste to Energy Industry Share (%) by Company 2024
List of Tables
- Table 1: Netherlands Waste to Energy Industry Revenue Million Forecast, by Region 2019 & 2032
- Table 2: Netherlands Waste to Energy Industry Revenue Million Forecast, by Technology 2019 & 2032
- Table 3: Netherlands Waste to Energy Industry Revenue Million Forecast, by Waste Type 2019 & 2032
- Table 4: Netherlands Waste to Energy Industry Revenue Million Forecast, by End-User 2019 & 2032
- Table 5: Netherlands Waste to Energy Industry Revenue Million Forecast, by Region 2019 & 2032
- Table 6: Netherlands Waste to Energy Industry Revenue Million Forecast, by Country 2019 & 2032
- Table 7: Germany Netherlands Waste to Energy Industry Revenue (Million) Forecast, by Application 2019 & 2032
- Table 8: France Netherlands Waste to Energy Industry Revenue (Million) Forecast, by Application 2019 & 2032
- Table 9: Italy Netherlands Waste to Energy Industry Revenue (Million) Forecast, by Application 2019 & 2032
- Table 10: United Kingdom Netherlands Waste to Energy Industry Revenue (Million) Forecast, by Application 2019 & 2032
- Table 11: Netherlands Netherlands Waste to Energy Industry Revenue (Million) Forecast, by Application 2019 & 2032
- Table 12: Rest of Europe Netherlands Waste to Energy Industry Revenue (Million) Forecast, by Application 2019 & 2032
- Table 13: Netherlands Waste to Energy Industry Revenue Million Forecast, by Technology 2019 & 2032
- Table 14: Netherlands Waste to Energy Industry Revenue Million Forecast, by Waste Type 2019 & 2032
- Table 15: Netherlands Waste to Energy Industry Revenue Million Forecast, by End-User 2019 & 2032
- Table 16: Netherlands Waste to Energy Industry Revenue Million Forecast, by Country 2019 & 2032
Frequently Asked Questions
1. What is the projected Compound Annual Growth Rate (CAGR) of the Netherlands Waste to Energy Industry?
The projected CAGR is approximately 2.10%.
2. Which companies are prominent players in the Netherlands Waste to Energy Industry?
Key companies in the market include Attero BV, Ingenia Consultants & Engineers BV, AEB Bio-energiecentrale BV, Axpo Holdings AG, Indaver BV, Dutch Incinerators BV, AEB Amsterdam, Mitsubishi Heavy Industries Ltd *List Not Exhaustive.
3. What are the main segments of the Netherlands Waste to Energy Industry?
The market segments include Technology, Waste Type, End-User.
4. Can you provide details about the market size?
The market size is estimated to be USD 2.45 Million as of 2022.
5. What are some drivers contributing to market growth?
Supportive Government Policies for Waste-to-Energy Plants4.; Increasing Investments in Waste-to-Energy Industries.
6. What are the notable trends driving market growth?
Thermal Technologies Segment to Dominate the Market.
7. Are there any restraints impacting market growth?
The Strict Regulation Imposed Against the Release of Harmful Gases When Trash is Burned.
8. Can you provide examples of recent developments in the market?
January 2023: RWE received USD 117 million from the European Union's Innovation Fund to help build a waste-to-hydrogen project in an industrial cluster in the Netherlands.
9. What pricing options are available for accessing the report?
Pricing options include single-user, multi-user, and enterprise licenses priced at USD 3800, USD 4500, and USD 5800 respectively.
10. Is the market size provided in terms of value or volume?
The market size is provided in terms of value, measured in Million.
11. Are there any specific market keywords associated with the report?
Yes, the market keyword associated with the report is "Netherlands Waste to Energy Industry," which aids in identifying and referencing the specific market segment covered.
12. How do I determine which pricing option suits my needs best?
The pricing options vary based on user requirements and access needs. Individual users may opt for single-user licenses, while businesses requiring broader access may choose multi-user or enterprise licenses for cost-effective access to the report.
13. Are there any additional resources or data provided in the Netherlands Waste to Energy Industry report?
While the report offers comprehensive insights, it's advisable to review the specific contents or supplementary materials provided to ascertain if additional resources or data are available.
14. How can I stay updated on further developments or reports in the Netherlands Waste to Energy Industry?
To stay informed about further developments, trends, and reports in the Netherlands Waste to Energy Industry, consider subscribing to industry newsletters, following relevant companies and organizations, or regularly checking reputable industry news sources and publications.
Methodology
Step 1 - Identification of Relevant Samples Size from Population Database


Step 2 - Approaches for Defining Global Market Size (Value, Volume* & Price*)

Note*: In applicable scenarios
Step 3 - Data Sources
Primary Research
- Web Analytics
- Survey Reports
- Research Institute
- Latest Research Reports
- Opinion Leaders
Secondary Research
- Annual Reports
- White Paper
- Latest Press Release
- Industry Association
- Paid Database
- Investor Presentations

Step 4 - Data Triangulation
Involves using different sources of information in order to increase the validity of a study
These sources are likely to be stakeholders in a program - participants, other researchers, program staff, other community members, and so on.
Then we put all data in single framework & apply various statistical tools to find out the dynamic on the market.
During the analysis stage, feedback from the stakeholder groups would be compared to determine areas of agreement as well as areas of divergence


