
Key Insights
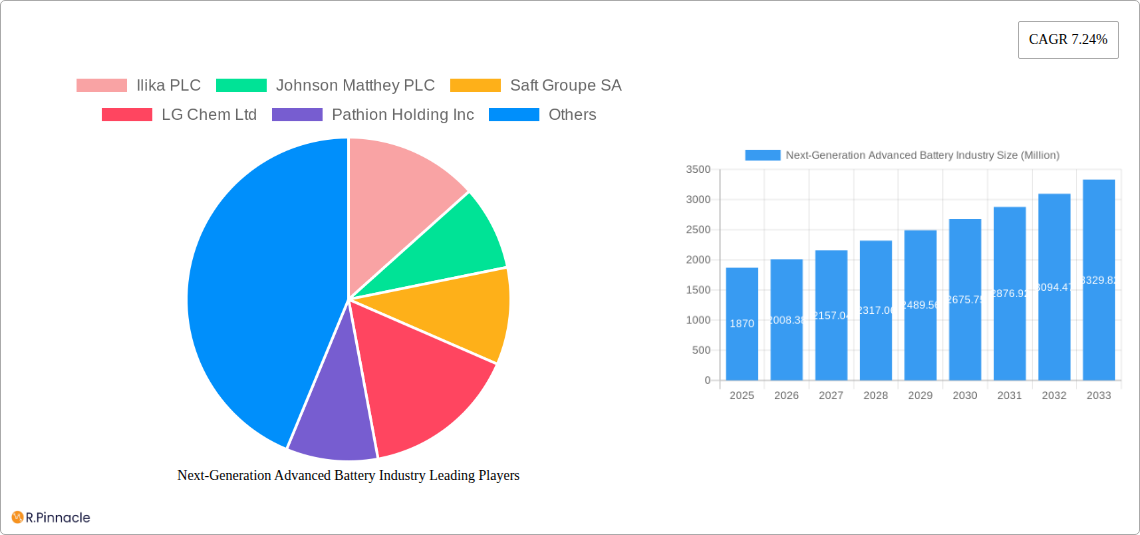
The next-generation advanced battery market is experiencing robust growth, projected to reach a substantial size driven by the increasing demand for energy storage solutions across various sectors. The market's Compound Annual Growth Rate (CAGR) of 7.24% from 2019 to 2024 indicates a significant upward trajectory. This expansion is fueled by several key factors. The escalating adoption of electric vehicles (EVs) in the transportation sector is a primary driver, demanding high-performance and energy-dense batteries. Furthermore, the growing need for renewable energy integration and grid stabilization is bolstering the demand for large-scale energy storage systems, creating significant opportunities for next-generation battery technologies. Technological advancements in solid-state electrolytes, magnesium-ion batteries, and metal-air batteries are enhancing energy density, safety, and lifespan, making them increasingly attractive alternatives to traditional lithium-ion batteries. The consumer electronics sector also contributes significantly to market growth, with the demand for longer-lasting and more efficient power sources for portable devices and wearables. While challenges remain in terms of production costs and scalability, ongoing research and development efforts are addressing these issues, paving the way for wider market penetration.
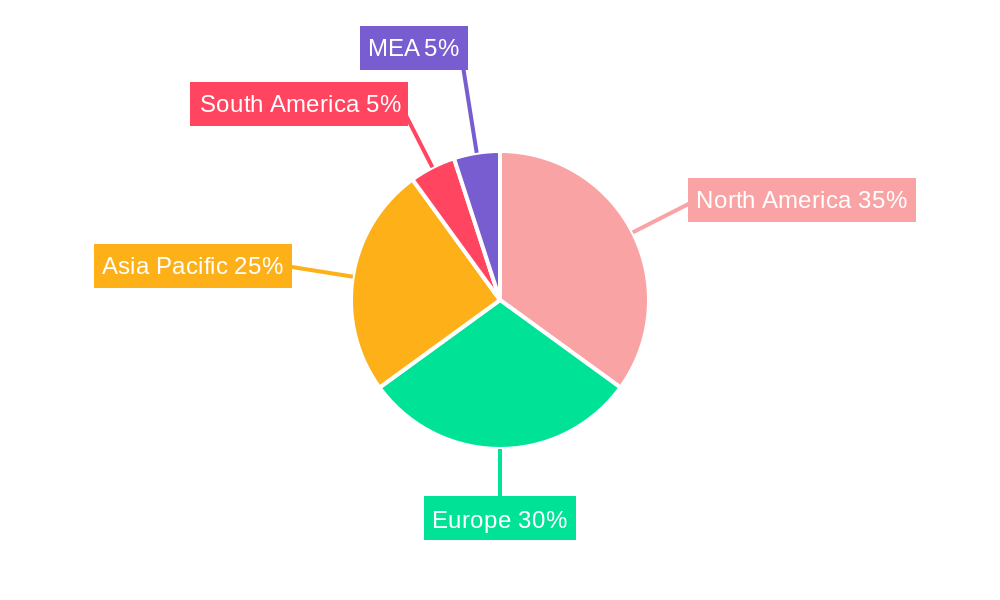
The geographical distribution of the market shows a concentration in North America, Europe, and Asia Pacific, with China and the United States emerging as key players. However, growth is expected across all regions, driven by government initiatives promoting clean energy adoption and the expanding middle class in developing economies. The segmentation of the market, categorized by technology type (solid-state, magnesium-ion, etc.) and end-user applications (consumer electronics, transportation, energy storage), offers diverse opportunities for companies specializing in specific technologies or markets. Key players are continuously investing in research and development, strategic partnerships, and mergers and acquisitions to expand their market share and solidify their position in this rapidly evolving landscape. The long-term forecast indicates sustained growth, with the market poised to witness substantial expansion over the next decade, driven by the confluence of technological advancements and increasing global demand for clean energy solutions.
Next-Generation Advanced Battery Industry Report: 2019-2033
This comprehensive report provides an in-depth analysis of the next-generation advanced battery industry, offering invaluable insights for industry professionals, investors, and strategists. Covering the period 2019-2033, with a base year of 2025 and a forecast period of 2025-2033, this report examines market dynamics, technological advancements, and key players shaping the future of energy storage. The market is expected to reach xx Million by 2033, showcasing substantial growth opportunities.
Next-Generation Advanced Battery Industry Market Structure & Innovation Trends
This section analyzes the competitive landscape, innovation drivers, and regulatory influences within the next-generation advanced battery market. The industry is characterized by a mix of established players and emerging innovators, resulting in a dynamic and competitive environment. Market concentration is moderate, with several key players holding significant market share, though a fragmented landscape also exists. Innovation is driven by the need for higher energy density, improved safety, longer lifespan, and reduced costs. Government regulations and incentives play a crucial role, particularly in promoting the adoption of sustainable and efficient energy storage solutions. Product substitutes, such as fuel cells and other energy storage technologies, pose ongoing competitive challenges. Mergers and acquisitions (M&A) are frequent, reflecting the strategic importance of technology consolidation and market expansion.
- Market Share: CATL holds an estimated xx% market share in 2025, followed by LG Chem with xx%, and other major players holding smaller, but significant, shares.
- M&A Activity: Total M&A deal value in the historical period (2019-2024) is estimated at xx Million, with a notable increase in deal value in 2022.
Next-Generation Advanced Battery Industry Market Dynamics & Trends
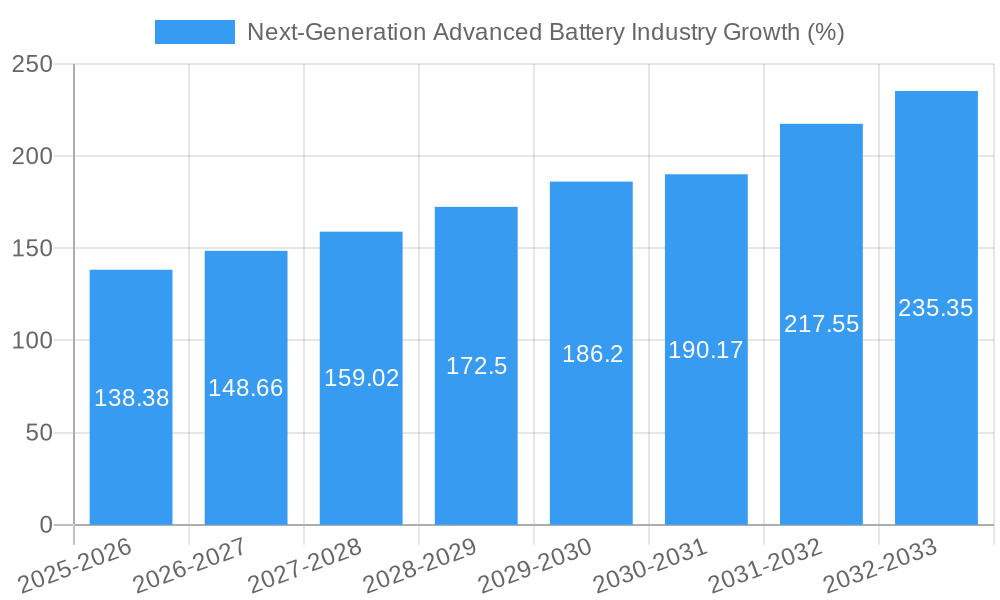
The next-generation advanced battery market is experiencing rapid growth, driven by increasing demand from various sectors. The compound annual growth rate (CAGR) is projected to be xx% during the forecast period (2025-2033). Technological advancements, particularly in solid-state batteries and other next-generation technologies, are significantly impacting market dynamics, fostering innovation and creating new opportunities. Consumer preferences for environmentally friendly and high-performance energy storage solutions are also shaping the market. Intense competition among major players is driving innovation and price reductions, leading to increased market penetration.
Dominant Regions & Segments in Next-Generation Advanced Battery Industry
The report identifies key regions and segments dominating the next-generation advanced battery market. Asia, particularly China, currently holds the largest market share, driven by strong government support, substantial manufacturing capacity, and a large domestic demand. The transportation segment, including electric vehicles (EVs), represents a significant portion of the overall market, while energy storage applications are rapidly growing.
- Leading Regions: Asia (China, Japan, South Korea), North America (USA), Europe (Germany, France).
- Key Drivers:
- Asia: Government subsidies, robust manufacturing infrastructure, high EV adoption.
- North America: Growing EV market, investment in grid-scale energy storage.
- Europe: Stringent emission regulations, focus on renewable energy integration.
- Dominant Segments:
- Technology: Solid-state batteries are expected to experience rapid growth due to their enhanced safety and energy density.
- End User: Transportation is currently the leading end-user segment, followed by energy storage and industrial applications.
Next-Generation Advanced Battery Industry Product Innovations
The market is witnessing significant product innovations, with a focus on improved energy density, faster charging times, enhanced safety features, and extended lifespans. Solid-state batteries, magnesium-ion batteries, and other next-generation technologies are gaining traction, offering superior performance compared to traditional lithium-ion batteries. These innovations are being driven by advancements in materials science, battery chemistry, and manufacturing processes. The market fit for these innovative technologies is strong, primarily due to the growing demand for energy storage solutions in various sectors.
Report Scope & Segmentation Analysis
This report segments the market by technology (Solid Electrolyte Battery, Magnesium Ion Battery, Next-generation Flow Battery, Metal-Air Battery, Lithium-Sulfur Battery, Other Technologies) and end-user (Consumer Electronics, Transportation, Industrial, Energy Storage, Other End Users). Each segment’s growth projections, market size, and competitive dynamics are analyzed in detail. For example, the solid-state battery segment is projected to experience significant growth due to its potential for high energy density and improved safety. The transportation segment currently dominates but other segments such as energy storage are expected to see significant growth.
Key Drivers of Next-Generation Advanced Battery Industry Growth
Growth is fueled by increasing demand for electric vehicles (EVs), the rise of renewable energy sources, and government initiatives promoting clean energy technologies. Technological advancements, particularly in solid-state batteries, are further enhancing market prospects. Government regulations, such as emission reduction targets and incentives for EV adoption, are crucial drivers. Cost reductions through economies of scale and technological improvements are making advanced batteries increasingly cost-competitive.
Challenges in the Next-Generation Advanced Battery Industry Sector
Challenges include high raw material costs, limited supply chain infrastructure, and technical hurdles in scaling up next-generation battery technologies. Regulatory uncertainty and safety concerns can also hinder market growth. Furthermore, intense competition among manufacturers and the need to continually improve battery performance and cost-effectiveness pose considerable challenges.
Emerging Opportunities in Next-Generation Advanced Battery Industry
Opportunities lie in the development and commercialization of next-generation battery technologies, expansion into new applications such as grid-scale energy storage, and the growth of the electric vehicle market. Advancements in battery management systems (BMS) and improved recycling technologies are also opening new avenues.
Leading Players in the Next-Generation Advanced Battery Industry Market
- Ilika PLC
- Johnson Matthey PLC
- Saft Groupe SA
- LG Chem Ltd
- Pathion Holding Inc
- Contemporary Amperex Technology Co Ltd
- PolyPlus Battery Co Inc
- GS Yuasa Corporation
- Sion Power Corporation
Key Developments in Next-Generation Advanced Battery Industry Industry
- February 2022: The US Department of Energy announced USD 2.91 Billion to boost advanced battery production for EVs and stationary energy storage.
- January 2022: Mercedes-Benz and ProLogium partnered to develop next-generation battery cells, aligning with Mercedes-Benz's all-electric 2030 goal.
Future Outlook for Next-Generation Advanced Battery Industry Market
The next-generation advanced battery market is poised for significant growth, driven by technological innovation, increasing demand from various sectors, and supportive government policies. Strategic partnerships, investments in R&D, and the development of sustainable and cost-effective manufacturing processes will be crucial for success in this rapidly evolving market. The market's future potential is substantial, particularly as battery technology continues to advance and the global transition to clean energy accelerates.
Next-Generation Advanced Battery Industry Segmentation
-
1. Technology
- 1.1. Solid Electrolyte Battery
- 1.2. Magnesium Ion Battery
- 1.3. Next-generation Flow Battery
- 1.4. Metal-Air Battery
- 1.5. Lithium-Sulfur Battery
- 1.6. Other Technologies
-
2. End User
- 2.1. Consumer Electronics
- 2.2. Transportation
- 2.3. Industrial
- 2.4. Energy Storage
- 2.5. Other End Users
Next-Generation Advanced Battery Industry Segmentation By Geography
- 1. North America
- 2. Asia Pacific
- 3. Europe
- 4. South America
- 5. Middle East and Africa
Next-Generation Advanced Battery Industry REPORT HIGHLIGHTS
| Aspects | Details |
|---|---|
| Study Period | 2019-2033 |
| Base Year | 2024 |
| Estimated Year | 2025 |
| Forecast Period | 2025-2033 |
| Historical Period | 2019-2024 |
| Growth Rate | CAGR of 7.24% from 2019-2033 |
| Segmentation |
|
Table of Contents
- 1. Introduction
- 1.1. Research Scope
- 1.2. Market Segmentation
- 1.3. Research Methodology
- 1.4. Definitions and Assumptions
- 2. Executive Summary
- 2.1. Introduction
- 3. Market Dynamics
- 3.1. Introduction
- 3.2. Market Drivers
- 3.2.1. 4.; Rising Industrialization across the Globe4.; Increasing Utilization of Natural Gas
- 3.3. Market Restrains
- 3.3.1. 4.; High Cost of Installation and Maintenance
- 3.4. Market Trends
- 3.4.1. Transportation Segment Expected to Dominate the Market
- 4. Market Factor Analysis
- 4.1. Porters Five Forces
- 4.2. Supply/Value Chain
- 4.3. PESTEL analysis
- 4.4. Market Entropy
- 4.5. Patent/Trademark Analysis
- 5. Global Next-Generation Advanced Battery Industry Analysis, Insights and Forecast, 2019-2031
- 5.1. Market Analysis, Insights and Forecast - by Technology
- 5.1.1. Solid Electrolyte Battery
- 5.1.2. Magnesium Ion Battery
- 5.1.3. Next-generation Flow Battery
- 5.1.4. Metal-Air Battery
- 5.1.5. Lithium-Sulfur Battery
- 5.1.6. Other Technologies
- 5.2. Market Analysis, Insights and Forecast - by End User
- 5.2.1. Consumer Electronics
- 5.2.2. Transportation
- 5.2.3. Industrial
- 5.2.4. Energy Storage
- 5.2.5. Other End Users
- 5.3. Market Analysis, Insights and Forecast - by Region
- 5.3.1. North America
- 5.3.2. Asia Pacific
- 5.3.3. Europe
- 5.3.4. South America
- 5.3.5. Middle East and Africa
- 5.1. Market Analysis, Insights and Forecast - by Technology
- 6. North America Next-Generation Advanced Battery Industry Analysis, Insights and Forecast, 2019-2031
- 6.1. Market Analysis, Insights and Forecast - by Technology
- 6.1.1. Solid Electrolyte Battery
- 6.1.2. Magnesium Ion Battery
- 6.1.3. Next-generation Flow Battery
- 6.1.4. Metal-Air Battery
- 6.1.5. Lithium-Sulfur Battery
- 6.1.6. Other Technologies
- 6.2. Market Analysis, Insights and Forecast - by End User
- 6.2.1. Consumer Electronics
- 6.2.2. Transportation
- 6.2.3. Industrial
- 6.2.4. Energy Storage
- 6.2.5. Other End Users
- 6.1. Market Analysis, Insights and Forecast - by Technology
- 7. Asia Pacific Next-Generation Advanced Battery Industry Analysis, Insights and Forecast, 2019-2031
- 7.1. Market Analysis, Insights and Forecast - by Technology
- 7.1.1. Solid Electrolyte Battery
- 7.1.2. Magnesium Ion Battery
- 7.1.3. Next-generation Flow Battery
- 7.1.4. Metal-Air Battery
- 7.1.5. Lithium-Sulfur Battery
- 7.1.6. Other Technologies
- 7.2. Market Analysis, Insights and Forecast - by End User
- 7.2.1. Consumer Electronics
- 7.2.2. Transportation
- 7.2.3. Industrial
- 7.2.4. Energy Storage
- 7.2.5. Other End Users
- 7.1. Market Analysis, Insights and Forecast - by Technology
- 8. Europe Next-Generation Advanced Battery Industry Analysis, Insights and Forecast, 2019-2031
- 8.1. Market Analysis, Insights and Forecast - by Technology
- 8.1.1. Solid Electrolyte Battery
- 8.1.2. Magnesium Ion Battery
- 8.1.3. Next-generation Flow Battery
- 8.1.4. Metal-Air Battery
- 8.1.5. Lithium-Sulfur Battery
- 8.1.6. Other Technologies
- 8.2. Market Analysis, Insights and Forecast - by End User
- 8.2.1. Consumer Electronics
- 8.2.2. Transportation
- 8.2.3. Industrial
- 8.2.4. Energy Storage
- 8.2.5. Other End Users
- 8.1. Market Analysis, Insights and Forecast - by Technology
- 9. South America Next-Generation Advanced Battery Industry Analysis, Insights and Forecast, 2019-2031
- 9.1. Market Analysis, Insights and Forecast - by Technology
- 9.1.1. Solid Electrolyte Battery
- 9.1.2. Magnesium Ion Battery
- 9.1.3. Next-generation Flow Battery
- 9.1.4. Metal-Air Battery
- 9.1.5. Lithium-Sulfur Battery
- 9.1.6. Other Technologies
- 9.2. Market Analysis, Insights and Forecast - by End User
- 9.2.1. Consumer Electronics
- 9.2.2. Transportation
- 9.2.3. Industrial
- 9.2.4. Energy Storage
- 9.2.5. Other End Users
- 9.1. Market Analysis, Insights and Forecast - by Technology
- 10. Middle East and Africa Next-Generation Advanced Battery Industry Analysis, Insights and Forecast, 2019-2031
- 10.1. Market Analysis, Insights and Forecast - by Technology
- 10.1.1. Solid Electrolyte Battery
- 10.1.2. Magnesium Ion Battery
- 10.1.3. Next-generation Flow Battery
- 10.1.4. Metal-Air Battery
- 10.1.5. Lithium-Sulfur Battery
- 10.1.6. Other Technologies
- 10.2. Market Analysis, Insights and Forecast - by End User
- 10.2.1. Consumer Electronics
- 10.2.2. Transportation
- 10.2.3. Industrial
- 10.2.4. Energy Storage
- 10.2.5. Other End Users
- 10.1. Market Analysis, Insights and Forecast - by Technology
- 11. North America Next-Generation Advanced Battery Industry Analysis, Insights and Forecast, 2019-2031
- 11.1. Market Analysis, Insights and Forecast - By Country/Sub-region
- 11.1.1 United States
- 11.1.2 Canada
- 11.1.3 Mexico
- 12. Europe Next-Generation Advanced Battery Industry Analysis, Insights and Forecast, 2019-2031
- 12.1. Market Analysis, Insights and Forecast - By Country/Sub-region
- 12.1.1 Germany
- 12.1.2 United Kingdom
- 12.1.3 France
- 12.1.4 Spain
- 12.1.5 Italy
- 12.1.6 Spain
- 12.1.7 Belgium
- 12.1.8 Netherland
- 12.1.9 Nordics
- 12.1.10 Rest of Europe
- 13. Asia Pacific Next-Generation Advanced Battery Industry Analysis, Insights and Forecast, 2019-2031
- 13.1. Market Analysis, Insights and Forecast - By Country/Sub-region
- 13.1.1 China
- 13.1.2 Japan
- 13.1.3 India
- 13.1.4 South Korea
- 13.1.5 Southeast Asia
- 13.1.6 Australia
- 13.1.7 Indonesia
- 13.1.8 Phillipes
- 13.1.9 Singapore
- 13.1.10 Thailandc
- 13.1.11 Rest of Asia Pacific
- 14. South America Next-Generation Advanced Battery Industry Analysis, Insights and Forecast, 2019-2031
- 14.1. Market Analysis, Insights and Forecast - By Country/Sub-region
- 14.1.1 Brazil
- 14.1.2 Argentina
- 14.1.3 Peru
- 14.1.4 Chile
- 14.1.5 Colombia
- 14.1.6 Ecuador
- 14.1.7 Venezuela
- 14.1.8 Rest of South America
- 15. MEA Next-Generation Advanced Battery Industry Analysis, Insights and Forecast, 2019-2031
- 15.1. Market Analysis, Insights and Forecast - By Country/Sub-region
- 15.1.1 United Arab Emirates
- 15.1.2 Saudi Arabia
- 15.1.3 South Africa
- 15.1.4 Rest of Middle East and Africa
- 16. Competitive Analysis
- 16.1. Global Market Share Analysis 2024
- 16.2. Company Profiles
- 16.2.1 Ilika PLC
- 16.2.1.1. Overview
- 16.2.1.2. Products
- 16.2.1.3. SWOT Analysis
- 16.2.1.4. Recent Developments
- 16.2.1.5. Financials (Based on Availability)
- 16.2.2 Johnson Matthey PLC
- 16.2.2.1. Overview
- 16.2.2.2. Products
- 16.2.2.3. SWOT Analysis
- 16.2.2.4. Recent Developments
- 16.2.2.5. Financials (Based on Availability)
- 16.2.3 Saft Groupe SA
- 16.2.3.1. Overview
- 16.2.3.2. Products
- 16.2.3.3. SWOT Analysis
- 16.2.3.4. Recent Developments
- 16.2.3.5. Financials (Based on Availability)
- 16.2.4 LG Chem Ltd
- 16.2.4.1. Overview
- 16.2.4.2. Products
- 16.2.4.3. SWOT Analysis
- 16.2.4.4. Recent Developments
- 16.2.4.5. Financials (Based on Availability)
- 16.2.5 Pathion Holding Inc
- 16.2.5.1. Overview
- 16.2.5.2. Products
- 16.2.5.3. SWOT Analysis
- 16.2.5.4. Recent Developments
- 16.2.5.5. Financials (Based on Availability)
- 16.2.6 Contemporary Amperex Technology Co Ltd
- 16.2.6.1. Overview
- 16.2.6.2. Products
- 16.2.6.3. SWOT Analysis
- 16.2.6.4. Recent Developments
- 16.2.6.5. Financials (Based on Availability)
- 16.2.7 PolyPlus Battery Co Inc
- 16.2.7.1. Overview
- 16.2.7.2. Products
- 16.2.7.3. SWOT Analysis
- 16.2.7.4. Recent Developments
- 16.2.7.5. Financials (Based on Availability)
- 16.2.8 GS Yuasa Corporation
- 16.2.8.1. Overview
- 16.2.8.2. Products
- 16.2.8.3. SWOT Analysis
- 16.2.8.4. Recent Developments
- 16.2.8.5. Financials (Based on Availability)
- 16.2.9 Sion Power Corporation
- 16.2.9.1. Overview
- 16.2.9.2. Products
- 16.2.9.3. SWOT Analysis
- 16.2.9.4. Recent Developments
- 16.2.9.5. Financials (Based on Availability)
- 16.2.1 Ilika PLC
List of Figures
- Figure 1: Global Next-Generation Advanced Battery Industry Revenue Breakdown (Million, %) by Region 2024 & 2032
- Figure 2: Global Next-Generation Advanced Battery Industry Volume Breakdown (K Unit, %) by Region 2024 & 2032
- Figure 3: North America Next-Generation Advanced Battery Industry Revenue (Million), by Country 2024 & 2032
- Figure 4: North America Next-Generation Advanced Battery Industry Volume (K Unit), by Country 2024 & 2032
- Figure 5: North America Next-Generation Advanced Battery Industry Revenue Share (%), by Country 2024 & 2032
- Figure 6: North America Next-Generation Advanced Battery Industry Volume Share (%), by Country 2024 & 2032
- Figure 7: Europe Next-Generation Advanced Battery Industry Revenue (Million), by Country 2024 & 2032
- Figure 8: Europe Next-Generation Advanced Battery Industry Volume (K Unit), by Country 2024 & 2032
- Figure 9: Europe Next-Generation Advanced Battery Industry Revenue Share (%), by Country 2024 & 2032
- Figure 10: Europe Next-Generation Advanced Battery Industry Volume Share (%), by Country 2024 & 2032
- Figure 11: Asia Pacific Next-Generation Advanced Battery Industry Revenue (Million), by Country 2024 & 2032
- Figure 12: Asia Pacific Next-Generation Advanced Battery Industry Volume (K Unit), by Country 2024 & 2032
- Figure 13: Asia Pacific Next-Generation Advanced Battery Industry Revenue Share (%), by Country 2024 & 2032
- Figure 14: Asia Pacific Next-Generation Advanced Battery Industry Volume Share (%), by Country 2024 & 2032
- Figure 15: South America Next-Generation Advanced Battery Industry Revenue (Million), by Country 2024 & 2032
- Figure 16: South America Next-Generation Advanced Battery Industry Volume (K Unit), by Country 2024 & 2032
- Figure 17: South America Next-Generation Advanced Battery Industry Revenue Share (%), by Country 2024 & 2032
- Figure 18: South America Next-Generation Advanced Battery Industry Volume Share (%), by Country 2024 & 2032
- Figure 19: MEA Next-Generation Advanced Battery Industry Revenue (Million), by Country 2024 & 2032
- Figure 20: MEA Next-Generation Advanced Battery Industry Volume (K Unit), by Country 2024 & 2032
- Figure 21: MEA Next-Generation Advanced Battery Industry Revenue Share (%), by Country 2024 & 2032
- Figure 22: MEA Next-Generation Advanced Battery Industry Volume Share (%), by Country 2024 & 2032
- Figure 23: North America Next-Generation Advanced Battery Industry Revenue (Million), by Technology 2024 & 2032
- Figure 24: North America Next-Generation Advanced Battery Industry Volume (K Unit), by Technology 2024 & 2032
- Figure 25: North America Next-Generation Advanced Battery Industry Revenue Share (%), by Technology 2024 & 2032
- Figure 26: North America Next-Generation Advanced Battery Industry Volume Share (%), by Technology 2024 & 2032
- Figure 27: North America Next-Generation Advanced Battery Industry Revenue (Million), by End User 2024 & 2032
- Figure 28: North America Next-Generation Advanced Battery Industry Volume (K Unit), by End User 2024 & 2032
- Figure 29: North America Next-Generation Advanced Battery Industry Revenue Share (%), by End User 2024 & 2032
- Figure 30: North America Next-Generation Advanced Battery Industry Volume Share (%), by End User 2024 & 2032
- Figure 31: North America Next-Generation Advanced Battery Industry Revenue (Million), by Country 2024 & 2032
- Figure 32: North America Next-Generation Advanced Battery Industry Volume (K Unit), by Country 2024 & 2032
- Figure 33: North America Next-Generation Advanced Battery Industry Revenue Share (%), by Country 2024 & 2032
- Figure 34: North America Next-Generation Advanced Battery Industry Volume Share (%), by Country 2024 & 2032
- Figure 35: Asia Pacific Next-Generation Advanced Battery Industry Revenue (Million), by Technology 2024 & 2032
- Figure 36: Asia Pacific Next-Generation Advanced Battery Industry Volume (K Unit), by Technology 2024 & 2032
- Figure 37: Asia Pacific Next-Generation Advanced Battery Industry Revenue Share (%), by Technology 2024 & 2032
- Figure 38: Asia Pacific Next-Generation Advanced Battery Industry Volume Share (%), by Technology 2024 & 2032
- Figure 39: Asia Pacific Next-Generation Advanced Battery Industry Revenue (Million), by End User 2024 & 2032
- Figure 40: Asia Pacific Next-Generation Advanced Battery Industry Volume (K Unit), by End User 2024 & 2032
- Figure 41: Asia Pacific Next-Generation Advanced Battery Industry Revenue Share (%), by End User 2024 & 2032
- Figure 42: Asia Pacific Next-Generation Advanced Battery Industry Volume Share (%), by End User 2024 & 2032
- Figure 43: Asia Pacific Next-Generation Advanced Battery Industry Revenue (Million), by Country 2024 & 2032
- Figure 44: Asia Pacific Next-Generation Advanced Battery Industry Volume (K Unit), by Country 2024 & 2032
- Figure 45: Asia Pacific Next-Generation Advanced Battery Industry Revenue Share (%), by Country 2024 & 2032
- Figure 46: Asia Pacific Next-Generation Advanced Battery Industry Volume Share (%), by Country 2024 & 2032
- Figure 47: Europe Next-Generation Advanced Battery Industry Revenue (Million), by Technology 2024 & 2032
- Figure 48: Europe Next-Generation Advanced Battery Industry Volume (K Unit), by Technology 2024 & 2032
- Figure 49: Europe Next-Generation Advanced Battery Industry Revenue Share (%), by Technology 2024 & 2032
- Figure 50: Europe Next-Generation Advanced Battery Industry Volume Share (%), by Technology 2024 & 2032
- Figure 51: Europe Next-Generation Advanced Battery Industry Revenue (Million), by End User 2024 & 2032
- Figure 52: Europe Next-Generation Advanced Battery Industry Volume (K Unit), by End User 2024 & 2032
- Figure 53: Europe Next-Generation Advanced Battery Industry Revenue Share (%), by End User 2024 & 2032
- Figure 54: Europe Next-Generation Advanced Battery Industry Volume Share (%), by End User 2024 & 2032
- Figure 55: Europe Next-Generation Advanced Battery Industry Revenue (Million), by Country 2024 & 2032
- Figure 56: Europe Next-Generation Advanced Battery Industry Volume (K Unit), by Country 2024 & 2032
- Figure 57: Europe Next-Generation Advanced Battery Industry Revenue Share (%), by Country 2024 & 2032
- Figure 58: Europe Next-Generation Advanced Battery Industry Volume Share (%), by Country 2024 & 2032
- Figure 59: South America Next-Generation Advanced Battery Industry Revenue (Million), by Technology 2024 & 2032
- Figure 60: South America Next-Generation Advanced Battery Industry Volume (K Unit), by Technology 2024 & 2032
- Figure 61: South America Next-Generation Advanced Battery Industry Revenue Share (%), by Technology 2024 & 2032
- Figure 62: South America Next-Generation Advanced Battery Industry Volume Share (%), by Technology 2024 & 2032
- Figure 63: South America Next-Generation Advanced Battery Industry Revenue (Million), by End User 2024 & 2032
- Figure 64: South America Next-Generation Advanced Battery Industry Volume (K Unit), by End User 2024 & 2032
- Figure 65: South America Next-Generation Advanced Battery Industry Revenue Share (%), by End User 2024 & 2032
- Figure 66: South America Next-Generation Advanced Battery Industry Volume Share (%), by End User 2024 & 2032
- Figure 67: South America Next-Generation Advanced Battery Industry Revenue (Million), by Country 2024 & 2032
- Figure 68: South America Next-Generation Advanced Battery Industry Volume (K Unit), by Country 2024 & 2032
- Figure 69: South America Next-Generation Advanced Battery Industry Revenue Share (%), by Country 2024 & 2032
- Figure 70: South America Next-Generation Advanced Battery Industry Volume Share (%), by Country 2024 & 2032
- Figure 71: Middle East and Africa Next-Generation Advanced Battery Industry Revenue (Million), by Technology 2024 & 2032
- Figure 72: Middle East and Africa Next-Generation Advanced Battery Industry Volume (K Unit), by Technology 2024 & 2032
- Figure 73: Middle East and Africa Next-Generation Advanced Battery Industry Revenue Share (%), by Technology 2024 & 2032
- Figure 74: Middle East and Africa Next-Generation Advanced Battery Industry Volume Share (%), by Technology 2024 & 2032
- Figure 75: Middle East and Africa Next-Generation Advanced Battery Industry Revenue (Million), by End User 2024 & 2032
- Figure 76: Middle East and Africa Next-Generation Advanced Battery Industry Volume (K Unit), by End User 2024 & 2032
- Figure 77: Middle East and Africa Next-Generation Advanced Battery Industry Revenue Share (%), by End User 2024 & 2032
- Figure 78: Middle East and Africa Next-Generation Advanced Battery Industry Volume Share (%), by End User 2024 & 2032
- Figure 79: Middle East and Africa Next-Generation Advanced Battery Industry Revenue (Million), by Country 2024 & 2032
- Figure 80: Middle East and Africa Next-Generation Advanced Battery Industry Volume (K Unit), by Country 2024 & 2032
- Figure 81: Middle East and Africa Next-Generation Advanced Battery Industry Revenue Share (%), by Country 2024 & 2032
- Figure 82: Middle East and Africa Next-Generation Advanced Battery Industry Volume Share (%), by Country 2024 & 2032
List of Tables
- Table 1: Global Next-Generation Advanced Battery Industry Revenue Million Forecast, by Region 2019 & 2032
- Table 2: Global Next-Generation Advanced Battery Industry Volume K Unit Forecast, by Region 2019 & 2032
- Table 3: Global Next-Generation Advanced Battery Industry Revenue Million Forecast, by Technology 2019 & 2032
- Table 4: Global Next-Generation Advanced Battery Industry Volume K Unit Forecast, by Technology 2019 & 2032
- Table 5: Global Next-Generation Advanced Battery Industry Revenue Million Forecast, by End User 2019 & 2032
- Table 6: Global Next-Generation Advanced Battery Industry Volume K Unit Forecast, by End User 2019 & 2032
- Table 7: Global Next-Generation Advanced Battery Industry Revenue Million Forecast, by Region 2019 & 2032
- Table 8: Global Next-Generation Advanced Battery Industry Volume K Unit Forecast, by Region 2019 & 2032
- Table 9: Global Next-Generation Advanced Battery Industry Revenue Million Forecast, by Country 2019 & 2032
- Table 10: Global Next-Generation Advanced Battery Industry Volume K Unit Forecast, by Country 2019 & 2032
- Table 11: United States Next-Generation Advanced Battery Industry Revenue (Million) Forecast, by Application 2019 & 2032
- Table 12: United States Next-Generation Advanced Battery Industry Volume (K Unit) Forecast, by Application 2019 & 2032
- Table 13: Canada Next-Generation Advanced Battery Industry Revenue (Million) Forecast, by Application 2019 & 2032
- Table 14: Canada Next-Generation Advanced Battery Industry Volume (K Unit) Forecast, by Application 2019 & 2032
- Table 15: Mexico Next-Generation Advanced Battery Industry Revenue (Million) Forecast, by Application 2019 & 2032
- Table 16: Mexico Next-Generation Advanced Battery Industry Volume (K Unit) Forecast, by Application 2019 & 2032
- Table 17: Global Next-Generation Advanced Battery Industry Revenue Million Forecast, by Country 2019 & 2032
- Table 18: Global Next-Generation Advanced Battery Industry Volume K Unit Forecast, by Country 2019 & 2032
- Table 19: Germany Next-Generation Advanced Battery Industry Revenue (Million) Forecast, by Application 2019 & 2032
- Table 20: Germany Next-Generation Advanced Battery Industry Volume (K Unit) Forecast, by Application 2019 & 2032
- Table 21: United Kingdom Next-Generation Advanced Battery Industry Revenue (Million) Forecast, by Application 2019 & 2032
- Table 22: United Kingdom Next-Generation Advanced Battery Industry Volume (K Unit) Forecast, by Application 2019 & 2032
- Table 23: France Next-Generation Advanced Battery Industry Revenue (Million) Forecast, by Application 2019 & 2032
- Table 24: France Next-Generation Advanced Battery Industry Volume (K Unit) Forecast, by Application 2019 & 2032
- Table 25: Spain Next-Generation Advanced Battery Industry Revenue (Million) Forecast, by Application 2019 & 2032
- Table 26: Spain Next-Generation Advanced Battery Industry Volume (K Unit) Forecast, by Application 2019 & 2032
- Table 27: Italy Next-Generation Advanced Battery Industry Revenue (Million) Forecast, by Application 2019 & 2032
- Table 28: Italy Next-Generation Advanced Battery Industry Volume (K Unit) Forecast, by Application 2019 & 2032
- Table 29: Spain Next-Generation Advanced Battery Industry Revenue (Million) Forecast, by Application 2019 & 2032
- Table 30: Spain Next-Generation Advanced Battery Industry Volume (K Unit) Forecast, by Application 2019 & 2032
- Table 31: Belgium Next-Generation Advanced Battery Industry Revenue (Million) Forecast, by Application 2019 & 2032
- Table 32: Belgium Next-Generation Advanced Battery Industry Volume (K Unit) Forecast, by Application 2019 & 2032
- Table 33: Netherland Next-Generation Advanced Battery Industry Revenue (Million) Forecast, by Application 2019 & 2032
- Table 34: Netherland Next-Generation Advanced Battery Industry Volume (K Unit) Forecast, by Application 2019 & 2032
- Table 35: Nordics Next-Generation Advanced Battery Industry Revenue (Million) Forecast, by Application 2019 & 2032
- Table 36: Nordics Next-Generation Advanced Battery Industry Volume (K Unit) Forecast, by Application 2019 & 2032
- Table 37: Rest of Europe Next-Generation Advanced Battery Industry Revenue (Million) Forecast, by Application 2019 & 2032
- Table 38: Rest of Europe Next-Generation Advanced Battery Industry Volume (K Unit) Forecast, by Application 2019 & 2032
- Table 39: Global Next-Generation Advanced Battery Industry Revenue Million Forecast, by Country 2019 & 2032
- Table 40: Global Next-Generation Advanced Battery Industry Volume K Unit Forecast, by Country 2019 & 2032
- Table 41: China Next-Generation Advanced Battery Industry Revenue (Million) Forecast, by Application 2019 & 2032
- Table 42: China Next-Generation Advanced Battery Industry Volume (K Unit) Forecast, by Application 2019 & 2032
- Table 43: Japan Next-Generation Advanced Battery Industry Revenue (Million) Forecast, by Application 2019 & 2032
- Table 44: Japan Next-Generation Advanced Battery Industry Volume (K Unit) Forecast, by Application 2019 & 2032
- Table 45: India Next-Generation Advanced Battery Industry Revenue (Million) Forecast, by Application 2019 & 2032
- Table 46: India Next-Generation Advanced Battery Industry Volume (K Unit) Forecast, by Application 2019 & 2032
- Table 47: South Korea Next-Generation Advanced Battery Industry Revenue (Million) Forecast, by Application 2019 & 2032
- Table 48: South Korea Next-Generation Advanced Battery Industry Volume (K Unit) Forecast, by Application 2019 & 2032
- Table 49: Southeast Asia Next-Generation Advanced Battery Industry Revenue (Million) Forecast, by Application 2019 & 2032
- Table 50: Southeast Asia Next-Generation Advanced Battery Industry Volume (K Unit) Forecast, by Application 2019 & 2032
- Table 51: Australia Next-Generation Advanced Battery Industry Revenue (Million) Forecast, by Application 2019 & 2032
- Table 52: Australia Next-Generation Advanced Battery Industry Volume (K Unit) Forecast, by Application 2019 & 2032
- Table 53: Indonesia Next-Generation Advanced Battery Industry Revenue (Million) Forecast, by Application 2019 & 2032
- Table 54: Indonesia Next-Generation Advanced Battery Industry Volume (K Unit) Forecast, by Application 2019 & 2032
- Table 55: Phillipes Next-Generation Advanced Battery Industry Revenue (Million) Forecast, by Application 2019 & 2032
- Table 56: Phillipes Next-Generation Advanced Battery Industry Volume (K Unit) Forecast, by Application 2019 & 2032
- Table 57: Singapore Next-Generation Advanced Battery Industry Revenue (Million) Forecast, by Application 2019 & 2032
- Table 58: Singapore Next-Generation Advanced Battery Industry Volume (K Unit) Forecast, by Application 2019 & 2032
- Table 59: Thailandc Next-Generation Advanced Battery Industry Revenue (Million) Forecast, by Application 2019 & 2032
- Table 60: Thailandc Next-Generation Advanced Battery Industry Volume (K Unit) Forecast, by Application 2019 & 2032
- Table 61: Rest of Asia Pacific Next-Generation Advanced Battery Industry Revenue (Million) Forecast, by Application 2019 & 2032
- Table 62: Rest of Asia Pacific Next-Generation Advanced Battery Industry Volume (K Unit) Forecast, by Application 2019 & 2032
- Table 63: Global Next-Generation Advanced Battery Industry Revenue Million Forecast, by Country 2019 & 2032
- Table 64: Global Next-Generation Advanced Battery Industry Volume K Unit Forecast, by Country 2019 & 2032
- Table 65: Brazil Next-Generation Advanced Battery Industry Revenue (Million) Forecast, by Application 2019 & 2032
- Table 66: Brazil Next-Generation Advanced Battery Industry Volume (K Unit) Forecast, by Application 2019 & 2032
- Table 67: Argentina Next-Generation Advanced Battery Industry Revenue (Million) Forecast, by Application 2019 & 2032
- Table 68: Argentina Next-Generation Advanced Battery Industry Volume (K Unit) Forecast, by Application 2019 & 2032
- Table 69: Peru Next-Generation Advanced Battery Industry Revenue (Million) Forecast, by Application 2019 & 2032
- Table 70: Peru Next-Generation Advanced Battery Industry Volume (K Unit) Forecast, by Application 2019 & 2032
- Table 71: Chile Next-Generation Advanced Battery Industry Revenue (Million) Forecast, by Application 2019 & 2032
- Table 72: Chile Next-Generation Advanced Battery Industry Volume (K Unit) Forecast, by Application 2019 & 2032
- Table 73: Colombia Next-Generation Advanced Battery Industry Revenue (Million) Forecast, by Application 2019 & 2032
- Table 74: Colombia Next-Generation Advanced Battery Industry Volume (K Unit) Forecast, by Application 2019 & 2032
- Table 75: Ecuador Next-Generation Advanced Battery Industry Revenue (Million) Forecast, by Application 2019 & 2032
- Table 76: Ecuador Next-Generation Advanced Battery Industry Volume (K Unit) Forecast, by Application 2019 & 2032
- Table 77: Venezuela Next-Generation Advanced Battery Industry Revenue (Million) Forecast, by Application 2019 & 2032
- Table 78: Venezuela Next-Generation Advanced Battery Industry Volume (K Unit) Forecast, by Application 2019 & 2032
- Table 79: Rest of South America Next-Generation Advanced Battery Industry Revenue (Million) Forecast, by Application 2019 & 2032
- Table 80: Rest of South America Next-Generation Advanced Battery Industry Volume (K Unit) Forecast, by Application 2019 & 2032
- Table 81: Global Next-Generation Advanced Battery Industry Revenue Million Forecast, by Country 2019 & 2032
- Table 82: Global Next-Generation Advanced Battery Industry Volume K Unit Forecast, by Country 2019 & 2032
- Table 83: United Arab Emirates Next-Generation Advanced Battery Industry Revenue (Million) Forecast, by Application 2019 & 2032
- Table 84: United Arab Emirates Next-Generation Advanced Battery Industry Volume (K Unit) Forecast, by Application 2019 & 2032
- Table 85: Saudi Arabia Next-Generation Advanced Battery Industry Revenue (Million) Forecast, by Application 2019 & 2032
- Table 86: Saudi Arabia Next-Generation Advanced Battery Industry Volume (K Unit) Forecast, by Application 2019 & 2032
- Table 87: South Africa Next-Generation Advanced Battery Industry Revenue (Million) Forecast, by Application 2019 & 2032
- Table 88: South Africa Next-Generation Advanced Battery Industry Volume (K Unit) Forecast, by Application 2019 & 2032
- Table 89: Rest of Middle East and Africa Next-Generation Advanced Battery Industry Revenue (Million) Forecast, by Application 2019 & 2032
- Table 90: Rest of Middle East and Africa Next-Generation Advanced Battery Industry Volume (K Unit) Forecast, by Application 2019 & 2032
- Table 91: Global Next-Generation Advanced Battery Industry Revenue Million Forecast, by Technology 2019 & 2032
- Table 92: Global Next-Generation Advanced Battery Industry Volume K Unit Forecast, by Technology 2019 & 2032
- Table 93: Global Next-Generation Advanced Battery Industry Revenue Million Forecast, by End User 2019 & 2032
- Table 94: Global Next-Generation Advanced Battery Industry Volume K Unit Forecast, by End User 2019 & 2032
- Table 95: Global Next-Generation Advanced Battery Industry Revenue Million Forecast, by Country 2019 & 2032
- Table 96: Global Next-Generation Advanced Battery Industry Volume K Unit Forecast, by Country 2019 & 2032
- Table 97: Global Next-Generation Advanced Battery Industry Revenue Million Forecast, by Technology 2019 & 2032
- Table 98: Global Next-Generation Advanced Battery Industry Volume K Unit Forecast, by Technology 2019 & 2032
- Table 99: Global Next-Generation Advanced Battery Industry Revenue Million Forecast, by End User 2019 & 2032
- Table 100: Global Next-Generation Advanced Battery Industry Volume K Unit Forecast, by End User 2019 & 2032
- Table 101: Global Next-Generation Advanced Battery Industry Revenue Million Forecast, by Country 2019 & 2032
- Table 102: Global Next-Generation Advanced Battery Industry Volume K Unit Forecast, by Country 2019 & 2032
- Table 103: Global Next-Generation Advanced Battery Industry Revenue Million Forecast, by Technology 2019 & 2032
- Table 104: Global Next-Generation Advanced Battery Industry Volume K Unit Forecast, by Technology 2019 & 2032
- Table 105: Global Next-Generation Advanced Battery Industry Revenue Million Forecast, by End User 2019 & 2032
- Table 106: Global Next-Generation Advanced Battery Industry Volume K Unit Forecast, by End User 2019 & 2032
- Table 107: Global Next-Generation Advanced Battery Industry Revenue Million Forecast, by Country 2019 & 2032
- Table 108: Global Next-Generation Advanced Battery Industry Volume K Unit Forecast, by Country 2019 & 2032
- Table 109: Global Next-Generation Advanced Battery Industry Revenue Million Forecast, by Technology 2019 & 2032
- Table 110: Global Next-Generation Advanced Battery Industry Volume K Unit Forecast, by Technology 2019 & 2032
- Table 111: Global Next-Generation Advanced Battery Industry Revenue Million Forecast, by End User 2019 & 2032
- Table 112: Global Next-Generation Advanced Battery Industry Volume K Unit Forecast, by End User 2019 & 2032
- Table 113: Global Next-Generation Advanced Battery Industry Revenue Million Forecast, by Country 2019 & 2032
- Table 114: Global Next-Generation Advanced Battery Industry Volume K Unit Forecast, by Country 2019 & 2032
- Table 115: Global Next-Generation Advanced Battery Industry Revenue Million Forecast, by Technology 2019 & 2032
- Table 116: Global Next-Generation Advanced Battery Industry Volume K Unit Forecast, by Technology 2019 & 2032
- Table 117: Global Next-Generation Advanced Battery Industry Revenue Million Forecast, by End User 2019 & 2032
- Table 118: Global Next-Generation Advanced Battery Industry Volume K Unit Forecast, by End User 2019 & 2032
- Table 119: Global Next-Generation Advanced Battery Industry Revenue Million Forecast, by Country 2019 & 2032
- Table 120: Global Next-Generation Advanced Battery Industry Volume K Unit Forecast, by Country 2019 & 2032
Frequently Asked Questions
1. What is the projected Compound Annual Growth Rate (CAGR) of the Next-Generation Advanced Battery Industry?
The projected CAGR is approximately 7.24%.
2. Which companies are prominent players in the Next-Generation Advanced Battery Industry?
Key companies in the market include Ilika PLC, Johnson Matthey PLC, Saft Groupe SA, LG Chem Ltd, Pathion Holding Inc, Contemporary Amperex Technology Co Ltd, PolyPlus Battery Co Inc, GS Yuasa Corporation, Sion Power Corporation.
3. What are the main segments of the Next-Generation Advanced Battery Industry?
The market segments include Technology, End User.
4. Can you provide details about the market size?
The market size is estimated to be USD 1.87 Million as of 2022.
5. What are some drivers contributing to market growth?
4.; Rising Industrialization across the Globe4.; Increasing Utilization of Natural Gas.
6. What are the notable trends driving market growth?
Transportation Segment Expected to Dominate the Market.
7. Are there any restraints impacting market growth?
4.; High Cost of Installation and Maintenance.
8. Can you provide examples of recent developments in the market?
In February 2022, the US Department of Energy announced that it would provide USD 2.91 billion to boost the production of advanced batteries used in stationary energy storage systems and electric vehicles, as directed by the Bipartisan Infrastructure Law.
9. What pricing options are available for accessing the report?
Pricing options include single-user, multi-user, and enterprise licenses priced at USD 4750, USD 5250, and USD 8750 respectively.
10. Is the market size provided in terms of value or volume?
The market size is provided in terms of value, measured in Million and volume, measured in K Unit.
11. Are there any specific market keywords associated with the report?
Yes, the market keyword associated with the report is "Next-Generation Advanced Battery Industry," which aids in identifying and referencing the specific market segment covered.
12. How do I determine which pricing option suits my needs best?
The pricing options vary based on user requirements and access needs. Individual users may opt for single-user licenses, while businesses requiring broader access may choose multi-user or enterprise licenses for cost-effective access to the report.
13. Are there any additional resources or data provided in the Next-Generation Advanced Battery Industry report?
While the report offers comprehensive insights, it's advisable to review the specific contents or supplementary materials provided to ascertain if additional resources or data are available.
14. How can I stay updated on further developments or reports in the Next-Generation Advanced Battery Industry?
To stay informed about further developments, trends, and reports in the Next-Generation Advanced Battery Industry, consider subscribing to industry newsletters, following relevant companies and organizations, or regularly checking reputable industry news sources and publications.
Methodology
Step 1 - Identification of Relevant Samples Size from Population Database


Step 2 - Approaches for Defining Global Market Size (Value, Volume* & Price*)

Note*: In applicable scenarios
Step 3 - Data Sources
Primary Research
- Web Analytics
- Survey Reports
- Research Institute
- Latest Research Reports
- Opinion Leaders
Secondary Research
- Annual Reports
- White Paper
- Latest Press Release
- Industry Association
- Paid Database
- Investor Presentations

Step 4 - Data Triangulation
Involves using different sources of information in order to increase the validity of a study
These sources are likely to be stakeholders in a program - participants, other researchers, program staff, other community members, and so on.
Then we put all data in single framework & apply various statistical tools to find out the dynamic on the market.
During the analysis stage, feedback from the stakeholder groups would be compared to determine areas of agreement as well as areas of divergence


