

Key Insights
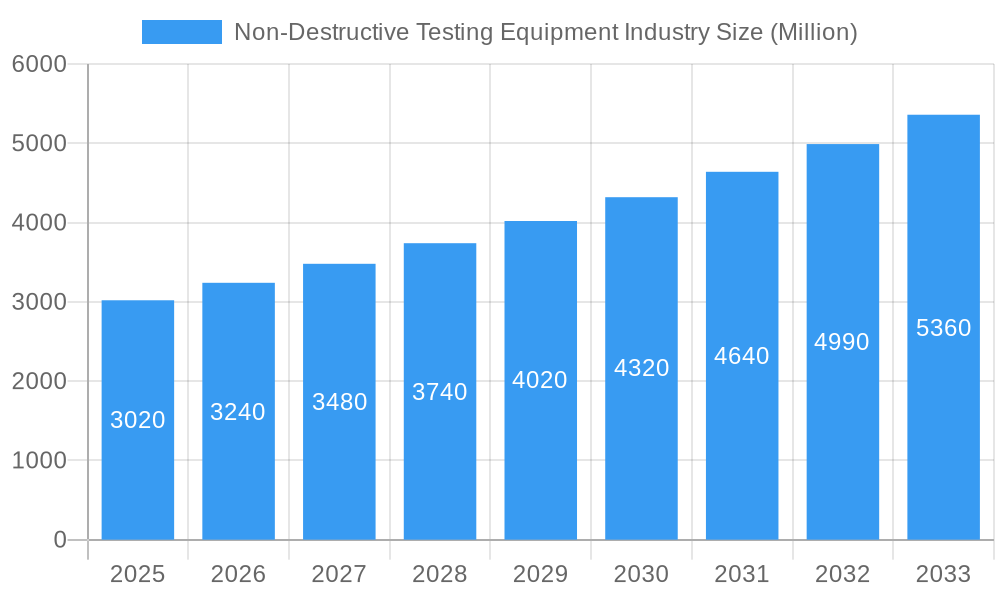
The Non-Destructive Testing (NDT) equipment market, valued at $3.02 billion in 2025, is projected to experience robust growth, driven by increasing demand across diverse sectors. A compound annual growth rate (CAGR) of 7.2% from 2025 to 2033 indicates a significant expansion, reaching an estimated market size exceeding $5.5 billion by 2033. Key drivers include the rising need for infrastructure maintenance and safety regulations across industries like oil & gas, aerospace, and automotive. The escalating complexity of manufacturing processes and the imperative for quality control further fuel market growth. Technological advancements, particularly in areas like automated inspection systems and advanced imaging techniques, are enhancing the efficiency and accuracy of NDT, making it more cost-effective and appealing to businesses. While the initial investment in advanced equipment can be a restraint, the long-term benefits in terms of reduced downtime and improved safety outweigh this initial cost, promoting market expansion. The market is segmented by technology (radiography, ultrasonic, magnetic particle, liquid penetrant, visual, eddy current, and others) and end-user industry (oil & gas, power & energy, aerospace & defense, automotive & transportation, construction, and others), with each segment contributing uniquely to overall growth. The robust growth in Asia-Pacific, particularly China and India, fuelled by infrastructure development projects and expanding manufacturing bases, is a significant factor contributing to global expansion. North America and Europe maintain substantial market shares, driven by stringent quality standards and established industrial bases.
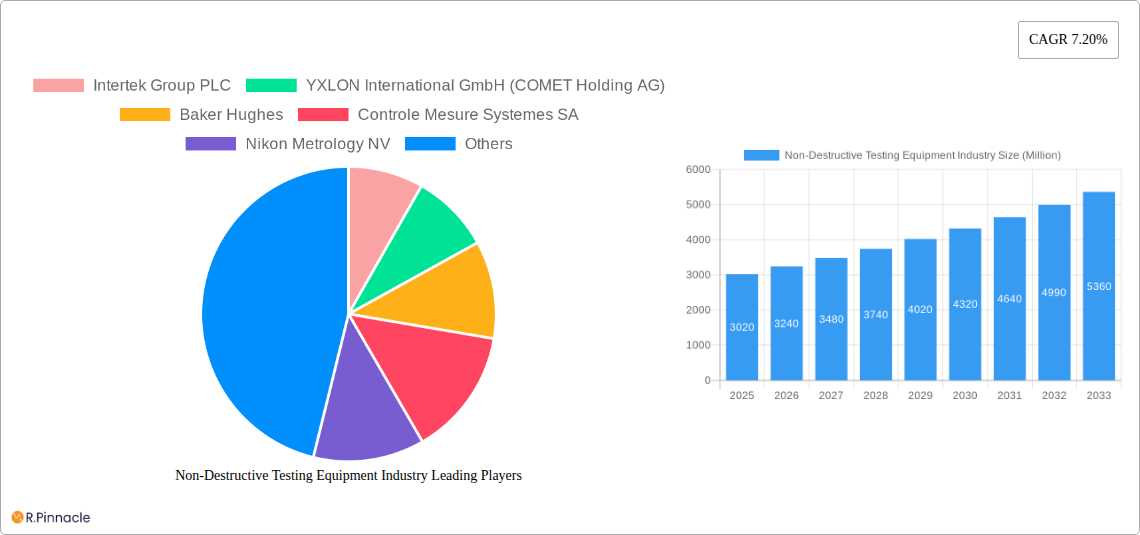
Non-Destructive Testing Equipment Industry Market Size (In Billion)
The competitive landscape is characterized by a mix of established players like Intertek, Baker Hughes, and Fujifilm, along with specialized NDT equipment manufacturers. Strategic partnerships, acquisitions, and technological innovations are common strategies employed by companies to maintain their market positioning. Future growth will be influenced by the adoption of Industry 4.0 technologies, increased automation in NDT processes, and the development of more sophisticated and portable equipment. Focus on developing sustainable and environmentally friendly testing methods will also gain traction, shaping the future trajectory of the NDT equipment market. The growing awareness of safety and the increasing demand for efficient inspection processes in various sectors ensures continuous market expansion over the forecast period.
Non-Destructive Testing Equipment Industry Company Market Share
Non-Destructive Testing (NDT) Equipment Market Report: 2019-2033
This comprehensive report provides an in-depth analysis of the Non-Destructive Testing (NDT) Equipment market, offering actionable insights for industry professionals, investors, and strategic decision-makers. The report covers the period from 2019 to 2033, with a focus on the forecast period 2025-2033 and a base year of 2025. The global market is projected to reach xx Million by 2033, showcasing significant growth potential.
Non-Destructive Testing Equipment Industry Market Structure & Innovation Trends
The NDT equipment market is moderately concentrated, with key players like Intertek Group PLC, YXLON International GmbH (COMET Holding AG), Baker Hughes, and Olympus Corporation holding significant market share. However, the presence of numerous smaller, specialized companies fosters competition and innovation. Market share estimates for 2025 suggest Intertek holds approximately xx%, while YXLON and Baker Hughes each hold approximately xx% and xx% respectively. The remaining share is distributed among other players.
Innovation is driven by the need for improved accuracy, efficiency, portability, and automation in NDT procedures. Regulatory frameworks, particularly those concerning safety and quality control in various end-user industries, significantly influence market dynamics. Product substitutes, such as advanced imaging technologies, exert competitive pressure, necessitating continuous innovation.
Mergers and acquisitions (M&A) are common, reflecting consolidation and expansion strategies. The total value of M&A deals in the NDT equipment sector during 2019-2024 was estimated at xx Million. These activities enhance market concentration and influence technological advancements. Key factors influencing M&A include access to new technologies, expansion into new markets, and increased market share.
- Market Concentration: Moderately concentrated with several key players and numerous smaller companies.
- Innovation Drivers: Improved accuracy, efficiency, portability, automation, and regulatory compliance.
- Regulatory Frameworks: Safety and quality control standards influence market dynamics.
- Product Substitutes: Advanced imaging technologies and other emerging technologies pose competitive pressures.
- M&A Activities: Significant M&A activity observed, valued at xx Million during 2019-2024.
Non-Destructive Testing Equipment Industry Market Dynamics & Trends
The NDT equipment market is experiencing robust growth, driven by increasing demand across various end-user industries. The compound annual growth rate (CAGR) from 2019 to 2024 was approximately xx%, and it is projected to maintain a similar or slightly higher CAGR during the forecast period. This growth can be attributed to several factors, including the rising need for infrastructure development, the expansion of the oil & gas and renewable energy sectors, and stringent safety regulations in industries such as aerospace and defense. Technological advancements, such as the integration of artificial intelligence (AI) and machine learning (ML) for automated defect detection, are further accelerating market growth. Consumer preferences lean toward equipment offering improved accuracy, faster testing times, and user-friendly interfaces. The competitive landscape is dynamic, with companies focusing on product differentiation, strategic partnerships, and technological innovation to gain a market edge. Market penetration of advanced NDT technologies is steadily increasing, with an estimated xx% market share in 2025.
Dominant Regions & Segments in Non-Destructive Testing Equipment Industry
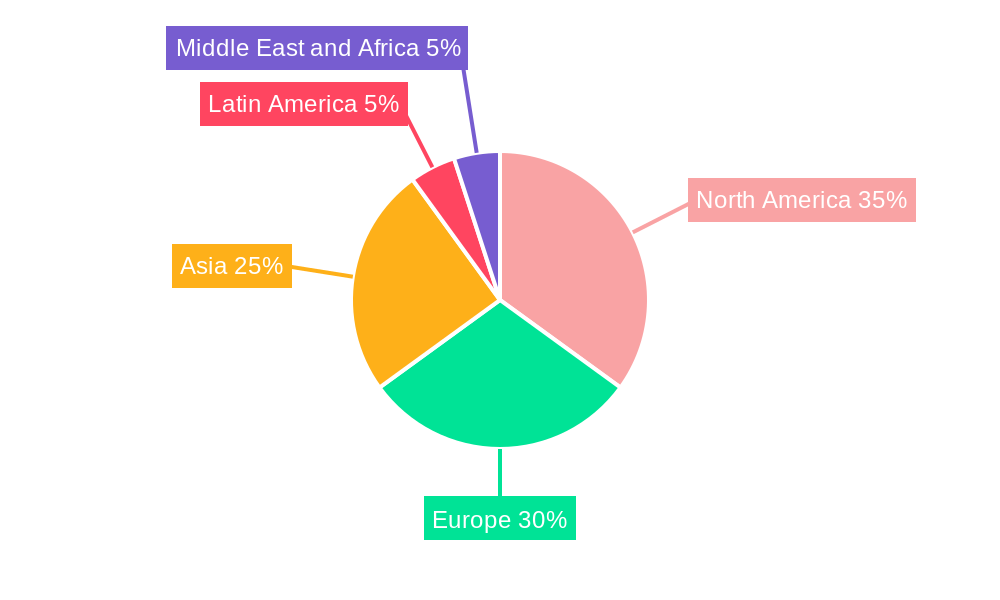
The North American region currently holds the largest market share, driven by robust infrastructure development and stringent safety regulations in various industries. Europe follows closely, while Asia-Pacific is expected to witness significant growth in the coming years due to increasing industrialization and infrastructure investments.
By technology, Ultrasonic Testing Equipment currently holds the largest market segment, followed by Radiography Testing Equipment. The high demand for ultrasonic testing is fueled by its versatility and effectiveness in various applications.
By end-user industry, the Oil & Gas sector is currently the leading segment due to its stringent safety standards and the large-scale infrastructure projects in the industry. However, Aerospace and Defense is a rapidly growing segment, due to the strict quality control measures in aircraft manufacturing and maintenance. Furthermore, the growing renewable energy sector (Power and Energy) significantly contributes to the market's overall growth.
- Key Drivers for North America: Stringent safety regulations, robust infrastructure development.
- Key Drivers for Europe: Mature industrial base, emphasis on quality control.
- Key Drivers for Asia-Pacific: Increasing industrialization and infrastructure investments.
- Dominant Technology Segment: Ultrasonic Testing Equipment, driven by versatility and effectiveness.
- Dominant End-user Industry: Oil and Gas, due to stringent safety regulations and large-scale projects.
Non-Destructive Testing Equipment Industry Product Innovations
Recent innovations focus on enhancing portability, automation, and data analysis capabilities. Miniaturized ultrasonic probes, automated flaw detection systems using AI, and cloud-based data management platforms are gaining traction. These advancements improve testing efficiency, reduce human error, and provide better data analysis for improved decision-making. The market is witnessing a strong trend towards integrating advanced technologies like AI and machine learning to enhance the accuracy and speed of NDT. This trend is boosting the adoption of sophisticated, yet user-friendly NDT equipment.
Report Scope & Segmentation Analysis
The report comprehensively analyzes the NDT equipment market across various segments:
By Technology: Radiography Testing Equipment, Ultrasonic Testing Equipment, Magnetic Particle Testing Equipment, Liquid Penetrant Testing Equipment, Visual Inspection Equipment, Eddy Current Equipment, Other Technologies Equipment. Each segment's growth is influenced by specific technological advancements and application requirements. Ultrasonic testing equipment holds the largest share.
By End-user Industry: Oil and Gas, Power and Energy, Aerospace and Defense, Automotive and Transportation, Construction, Other End-user Industries. Growth projections vary based on infrastructure spending, safety regulations, and industry-specific needs within each sector. Oil & Gas and Aerospace & Defense are currently the dominant end-user industries.
Each segment’s market size, growth projections, and competitive dynamics are detailed in the full report.
Key Drivers of Non-Destructive Testing Equipment Growth
The growth of the NDT equipment market is primarily fueled by several key factors:
- Stringent safety regulations: Across various industries, leading to increased adoption of NDT for quality control and safety assurance.
- Infrastructure development: Increased spending on infrastructure projects globally boosts the demand for NDT equipment.
- Technological advancements: Innovations such as AI and ML improve accuracy, efficiency, and data analysis capabilities.
- Growing demand from emerging economies: Rapid industrialization in developing countries fuels market expansion.
Challenges in the Non-Destructive Testing Equipment Industry Sector
The industry faces several challenges:
- High initial investment costs: Advanced NDT equipment can be expensive, limiting adoption for some companies.
- Skilled labor shortage: The need for qualified personnel to operate and interpret NDT results creates a bottleneck.
- Intense competition: The market is characterized by several established players and emerging companies, leading to price pressure.
- Supply chain disruptions: Global supply chain issues can affect the availability and cost of components.
Emerging Opportunities in Non-Destructive Testing Equipment Industry
Several emerging opportunities exist:
- Integration of AI and ML: These technologies can automate defect detection and improve data analysis, creating new market possibilities.
- Development of portable and user-friendly equipment: Makes NDT accessible to a wider range of users and applications.
- Expansion into new markets: Growing infrastructure investments in developing economies present significant opportunities.
- Focus on sustainable solutions: Environmentally friendly NDT techniques and equipment are gaining popularity.
Leading Players in the Non-Destructive Testing Equipment Industry Market
- Intertek Group PLC
- YXLON International GmbH (COMET Holding AG)
- Baker Hughes
- Controle Mesure Systemes SA
- Nikon Metrology NV
- Fujifilm Corporation
- Mistras Group Inc
- OkoNDT Group
- Innospection Limited
- Applus+ Laboratories
- Bureau Veritas SA
- Olympus Corporation
- Magnaflux Corp
Key Developments in Non-Destructive Testing Equipment Industry
- May 2023: MP Machinery and Testing announced the release of proprietary material testing equipment, expanding the capabilities of NDT in various industries.
- May 2023: The American Petroleum Institute (API) signed MoUs with ASNT and NDTMA, promoting high-quality NDT and safety improvements within the oil and gas industry.
Future Outlook for Non-Destructive Testing Equipment Market
The future of the NDT equipment market appears bright, driven by continuous technological advancements, growing demand across various sectors, and increased focus on safety and quality control. Strategic opportunities lie in developing innovative solutions that enhance efficiency, accuracy, and user-friendliness. The market is poised for continued growth, with significant potential in emerging economies and new application areas. The integration of AI and data analytics will further drive the market towards increased automation and improved decision-making capabilities.
Non-Destructive Testing Equipment Industry Segmentation
-
1. Technology
- 1.1. Radiography Testing Equipment
- 1.2. Ultrasonic Testing Equipment
- 1.3. Magnetic Particle Testing Equipment
- 1.4. Liquid Penetrant Testing Equipment
- 1.5. Visual Inspection Equipment
- 1.6. Eddy Current Equipment
- 1.7. Other Technologies Equipment
-
2. End-user Industry
- 2.1. Oil and Gas
- 2.2. Power and Energy
- 2.3. Aerospace and Defense
- 2.4. Automotive and Transportation
- 2.5. Construction
- 2.6. Other End-user Industries
Non-Destructive Testing Equipment Industry Segmentation By Geography
-
1. North America
- 1.1. United States
- 1.2. Canada
-
2. Europe
- 2.1. United Kingdom
- 2.2. Germany
- 2.3. France
- 2.4. Russia
- 2.5. Italy
-
3. Asia
- 3.1. China
- 3.2. India
- 3.3. South Korea
- 4. Australia and New Zealand
-
5. Latin America
- 5.1. Mexico
- 5.2. Brazil
- 5.3. Argentina
-
6. Middle East and Africa
- 6.1. Saudi Arabia
- 6.2. United Arab Emirates
- 6.3. Qatar
Non-Destructive Testing Equipment Industry Regional Market Share
Geographic Coverage of Non-Destructive Testing Equipment Industry
Non-Destructive Testing Equipment Industry REPORT HIGHLIGHTS
| Aspects | Details |
|---|---|
| Study Period | 2020-2034 |
| Base Year | 2025 |
| Estimated Year | 2026 |
| Forecast Period | 2026-2034 |
| Historical Period | 2020-2025 |
| Growth Rate | CAGR of 7.20% from 2020-2034 |
| Segmentation |
|
Table of Contents
- 1. Introduction
- 1.1. Research Scope
- 1.2. Market Segmentation
- 1.3. Research Objective
- 1.4. Definitions and Assumptions
- 2. Executive Summary
- 2.1. Market Snapshot
- 3. Market Dynamics
- 3.1. Market Drivers
- 3.2. Market Restrains
- 3.3. Market Trends
- 3.4. Market Opportunities
- 4. Market Factor Analysis
- 4.1. Porters Five Forces
- 4.1.1. Bargaining Power of Suppliers
- 4.1.2. Bargaining Power of Buyers
- 4.1.3. Threat of New Entrants
- 4.1.4. Threat of Substitutes
- 4.1.5. Competitive Rivalry
- 4.2. PESTEL analysis
- 4.3. BCG Analysis
- 4.3.1. Stars (High Growth, High Market Share)
- 4.3.2. Cash Cows (Low Growth, High Market Share)
- 4.3.3. Question Mark (High Growth, Low Market Share)
- 4.3.4. Dogs (Low Growth, Low Market Share)
- 4.4. Ansoff Matrix Analysis
- 4.5. Supply Chain Analysis
- 4.6. Regulatory Landscape
- 4.7. Current Market Potential and Opportunity Assessment (TAM–SAM–SOM Framework)
- 4.8. PRI Analyst Note
- 4.1. Porters Five Forces
- 5. Market Analysis, Insights and Forecast 2021-2033
- 5.1. Market Analysis, Insights and Forecast - by Technology
- 5.1.1. Radiography Testing Equipment
- 5.1.2. Ultrasonic Testing Equipment
- 5.1.3. Magnetic Particle Testing Equipment
- 5.1.4. Liquid Penetrant Testing Equipment
- 5.1.5. Visual Inspection Equipment
- 5.1.6. Eddy Current Equipment
- 5.1.7. Other Technologies Equipment
- 5.2. Market Analysis, Insights and Forecast - by End-user Industry
- 5.2.1. Oil and Gas
- 5.2.2. Power and Energy
- 5.2.3. Aerospace and Defense
- 5.2.4. Automotive and Transportation
- 5.2.5. Construction
- 5.2.6. Other End-user Industries
- 5.3. Market Analysis, Insights and Forecast - by Region
- 5.3.1. North America
- 5.3.2. Europe
- 5.3.3. Asia
- 5.3.4. Australia and New Zealand
- 5.3.5. Latin America
- 5.3.6. Middle East and Africa
- 5.1. Market Analysis, Insights and Forecast - by Technology
- 6. Global Non-Destructive Testing Equipment Industry Analysis, Insights and Forecast, 2021-2033
- 6.1. Market Analysis, Insights and Forecast - by Technology
- 6.1.1. Radiography Testing Equipment
- 6.1.2. Ultrasonic Testing Equipment
- 6.1.3. Magnetic Particle Testing Equipment
- 6.1.4. Liquid Penetrant Testing Equipment
- 6.1.5. Visual Inspection Equipment
- 6.1.6. Eddy Current Equipment
- 6.1.7. Other Technologies Equipment
- 6.2. Market Analysis, Insights and Forecast - by End-user Industry
- 6.2.1. Oil and Gas
- 6.2.2. Power and Energy
- 6.2.3. Aerospace and Defense
- 6.2.4. Automotive and Transportation
- 6.2.5. Construction
- 6.2.6. Other End-user Industries
- 6.1. Market Analysis, Insights and Forecast - by Technology
- 7. North America Non-Destructive Testing Equipment Industry Analysis, Insights and Forecast, 2020-2032
- 7.1. Market Analysis, Insights and Forecast - by Technology
- 7.1.1. Radiography Testing Equipment
- 7.1.2. Ultrasonic Testing Equipment
- 7.1.3. Magnetic Particle Testing Equipment
- 7.1.4. Liquid Penetrant Testing Equipment
- 7.1.5. Visual Inspection Equipment
- 7.1.6. Eddy Current Equipment
- 7.1.7. Other Technologies Equipment
- 7.2. Market Analysis, Insights and Forecast - by End-user Industry
- 7.2.1. Oil and Gas
- 7.2.2. Power and Energy
- 7.2.3. Aerospace and Defense
- 7.2.4. Automotive and Transportation
- 7.2.5. Construction
- 7.2.6. Other End-user Industries
- 7.1. Market Analysis, Insights and Forecast - by Technology
- 8. Europe Non-Destructive Testing Equipment Industry Analysis, Insights and Forecast, 2020-2032
- 8.1. Market Analysis, Insights and Forecast - by Technology
- 8.1.1. Radiography Testing Equipment
- 8.1.2. Ultrasonic Testing Equipment
- 8.1.3. Magnetic Particle Testing Equipment
- 8.1.4. Liquid Penetrant Testing Equipment
- 8.1.5. Visual Inspection Equipment
- 8.1.6. Eddy Current Equipment
- 8.1.7. Other Technologies Equipment
- 8.2. Market Analysis, Insights and Forecast - by End-user Industry
- 8.2.1. Oil and Gas
- 8.2.2. Power and Energy
- 8.2.3. Aerospace and Defense
- 8.2.4. Automotive and Transportation
- 8.2.5. Construction
- 8.2.6. Other End-user Industries
- 8.1. Market Analysis, Insights and Forecast - by Technology
- 9. Asia Non-Destructive Testing Equipment Industry Analysis, Insights and Forecast, 2020-2032
- 9.1. Market Analysis, Insights and Forecast - by Technology
- 9.1.1. Radiography Testing Equipment
- 9.1.2. Ultrasonic Testing Equipment
- 9.1.3. Magnetic Particle Testing Equipment
- 9.1.4. Liquid Penetrant Testing Equipment
- 9.1.5. Visual Inspection Equipment
- 9.1.6. Eddy Current Equipment
- 9.1.7. Other Technologies Equipment
- 9.2. Market Analysis, Insights and Forecast - by End-user Industry
- 9.2.1. Oil and Gas
- 9.2.2. Power and Energy
- 9.2.3. Aerospace and Defense
- 9.2.4. Automotive and Transportation
- 9.2.5. Construction
- 9.2.6. Other End-user Industries
- 9.1. Market Analysis, Insights and Forecast - by Technology
- 10. Australia and New Zealand Non-Destructive Testing Equipment Industry Analysis, Insights and Forecast, 2020-2032
- 10.1. Market Analysis, Insights and Forecast - by Technology
- 10.1.1. Radiography Testing Equipment
- 10.1.2. Ultrasonic Testing Equipment
- 10.1.3. Magnetic Particle Testing Equipment
- 10.1.4. Liquid Penetrant Testing Equipment
- 10.1.5. Visual Inspection Equipment
- 10.1.6. Eddy Current Equipment
- 10.1.7. Other Technologies Equipment
- 10.2. Market Analysis, Insights and Forecast - by End-user Industry
- 10.2.1. Oil and Gas
- 10.2.2. Power and Energy
- 10.2.3. Aerospace and Defense
- 10.2.4. Automotive and Transportation
- 10.2.5. Construction
- 10.2.6. Other End-user Industries
- 10.1. Market Analysis, Insights and Forecast - by Technology
- 11. Latin America Non-Destructive Testing Equipment Industry Analysis, Insights and Forecast, 2020-2032
- 11.1. Market Analysis, Insights and Forecast - by Technology
- 11.1.1. Radiography Testing Equipment
- 11.1.2. Ultrasonic Testing Equipment
- 11.1.3. Magnetic Particle Testing Equipment
- 11.1.4. Liquid Penetrant Testing Equipment
- 11.1.5. Visual Inspection Equipment
- 11.1.6. Eddy Current Equipment
- 11.1.7. Other Technologies Equipment
- 11.2. Market Analysis, Insights and Forecast - by End-user Industry
- 11.2.1. Oil and Gas
- 11.2.2. Power and Energy
- 11.2.3. Aerospace and Defense
- 11.2.4. Automotive and Transportation
- 11.2.5. Construction
- 11.2.6. Other End-user Industries
- 11.1. Market Analysis, Insights and Forecast - by Technology
- 12. Middle East and Africa Non-Destructive Testing Equipment Industry Analysis, Insights and Forecast, 2020-2032
- 12.1. Market Analysis, Insights and Forecast - by Technology
- 12.1.1. Radiography Testing Equipment
- 12.1.2. Ultrasonic Testing Equipment
- 12.1.3. Magnetic Particle Testing Equipment
- 12.1.4. Liquid Penetrant Testing Equipment
- 12.1.5. Visual Inspection Equipment
- 12.1.6. Eddy Current Equipment
- 12.1.7. Other Technologies Equipment
- 12.2. Market Analysis, Insights and Forecast - by End-user Industry
- 12.2.1. Oil and Gas
- 12.2.2. Power and Energy
- 12.2.3. Aerospace and Defense
- 12.2.4. Automotive and Transportation
- 12.2.5. Construction
- 12.2.6. Other End-user Industries
- 12.1. Market Analysis, Insights and Forecast - by Technology
- 13. Competitive Analysis
- 13.1. Company Profiles
- 13.1.1 Intertek Group PLC
- 13.1.1.1. Company Overview
- 13.1.1.2. Products
- 13.1.1.3. Company Financials
- 13.1.1.4. SWOT Analysis
- 13.1.2 YXLON International GmbH (COMET Holding AG)
- 13.1.2.1. Company Overview
- 13.1.2.2. Products
- 13.1.2.3. Company Financials
- 13.1.2.4. SWOT Analysis
- 13.1.3 Baker Hughes
- 13.1.3.1. Company Overview
- 13.1.3.2. Products
- 13.1.3.3. Company Financials
- 13.1.3.4. SWOT Analysis
- 13.1.4 Controle Mesure Systemes SA
- 13.1.4.1. Company Overview
- 13.1.4.2. Products
- 13.1.4.3. Company Financials
- 13.1.4.4. SWOT Analysis
- 13.1.5 Nikon Metrology NV
- 13.1.5.1. Company Overview
- 13.1.5.2. Products
- 13.1.5.3. Company Financials
- 13.1.5.4. SWOT Analysis
- 13.1.6 Fujifilm Corporation
- 13.1.6.1. Company Overview
- 13.1.6.2. Products
- 13.1.6.3. Company Financials
- 13.1.6.4. SWOT Analysis
- 13.1.7 Mistras Group Inc
- 13.1.7.1. Company Overview
- 13.1.7.2. Products
- 13.1.7.3. Company Financials
- 13.1.7.4. SWOT Analysis
- 13.1.8 OkoNDT Group
- 13.1.8.1. Company Overview
- 13.1.8.2. Products
- 13.1.8.3. Company Financials
- 13.1.8.4. SWOT Analysis
- 13.1.9 Innospection Limited
- 13.1.9.1. Company Overview
- 13.1.9.2. Products
- 13.1.9.3. Company Financials
- 13.1.9.4. SWOT Analysis
- 13.1.10 Applus+ Laboratories
- 13.1.10.1. Company Overview
- 13.1.10.2. Products
- 13.1.10.3. Company Financials
- 13.1.10.4. SWOT Analysis
- 13.1.11 Bureau Veritas SA
- 13.1.11.1. Company Overview
- 13.1.11.2. Products
- 13.1.11.3. Company Financials
- 13.1.11.4. SWOT Analysis
- 13.1.12 Olympus Corporation
- 13.1.12.1. Company Overview
- 13.1.12.2. Products
- 13.1.12.3. Company Financials
- 13.1.12.4. SWOT Analysis
- 13.1.13 Magnaflux Corp
- 13.1.13.1. Company Overview
- 13.1.13.2. Products
- 13.1.13.3. Company Financials
- 13.1.13.4. SWOT Analysis
- 13.1.1 Intertek Group PLC
- 13.2. Market Entropy
- 13.2.1 Company's Key Areas Served
- 13.2.2 Recent Developments
- 13.3. Company Market Share Analysis 2025
- 13.3.1 Top 5 Companies Market Share Analysis
- 13.3.2 Top 3 Companies Market Share Analysis
- 13.4. List of Potential Customers
- 14. Research Methodology
List of Figures
- Figure 1: Global Non-Destructive Testing Equipment Industry Revenue Breakdown (Million, %) by Region 2025 & 2033
- Figure 2: North America Non-Destructive Testing Equipment Industry Revenue (Million), by Technology 2025 & 2033
- Figure 3: North America Non-Destructive Testing Equipment Industry Revenue Share (%), by Technology 2025 & 2033
- Figure 4: North America Non-Destructive Testing Equipment Industry Revenue (Million), by End-user Industry 2025 & 2033
- Figure 5: North America Non-Destructive Testing Equipment Industry Revenue Share (%), by End-user Industry 2025 & 2033
- Figure 6: North America Non-Destructive Testing Equipment Industry Revenue (Million), by Country 2025 & 2033
- Figure 7: North America Non-Destructive Testing Equipment Industry Revenue Share (%), by Country 2025 & 2033
- Figure 8: Europe Non-Destructive Testing Equipment Industry Revenue (Million), by Technology 2025 & 2033
- Figure 9: Europe Non-Destructive Testing Equipment Industry Revenue Share (%), by Technology 2025 & 2033
- Figure 10: Europe Non-Destructive Testing Equipment Industry Revenue (Million), by End-user Industry 2025 & 2033
- Figure 11: Europe Non-Destructive Testing Equipment Industry Revenue Share (%), by End-user Industry 2025 & 2033
- Figure 12: Europe Non-Destructive Testing Equipment Industry Revenue (Million), by Country 2025 & 2033
- Figure 13: Europe Non-Destructive Testing Equipment Industry Revenue Share (%), by Country 2025 & 2033
- Figure 14: Asia Non-Destructive Testing Equipment Industry Revenue (Million), by Technology 2025 & 2033
- Figure 15: Asia Non-Destructive Testing Equipment Industry Revenue Share (%), by Technology 2025 & 2033
- Figure 16: Asia Non-Destructive Testing Equipment Industry Revenue (Million), by End-user Industry 2025 & 2033
- Figure 17: Asia Non-Destructive Testing Equipment Industry Revenue Share (%), by End-user Industry 2025 & 2033
- Figure 18: Asia Non-Destructive Testing Equipment Industry Revenue (Million), by Country 2025 & 2033
- Figure 19: Asia Non-Destructive Testing Equipment Industry Revenue Share (%), by Country 2025 & 2033
- Figure 20: Australia and New Zealand Non-Destructive Testing Equipment Industry Revenue (Million), by Technology 2025 & 2033
- Figure 21: Australia and New Zealand Non-Destructive Testing Equipment Industry Revenue Share (%), by Technology 2025 & 2033
- Figure 22: Australia and New Zealand Non-Destructive Testing Equipment Industry Revenue (Million), by End-user Industry 2025 & 2033
- Figure 23: Australia and New Zealand Non-Destructive Testing Equipment Industry Revenue Share (%), by End-user Industry 2025 & 2033
- Figure 24: Australia and New Zealand Non-Destructive Testing Equipment Industry Revenue (Million), by Country 2025 & 2033
- Figure 25: Australia and New Zealand Non-Destructive Testing Equipment Industry Revenue Share (%), by Country 2025 & 2033
- Figure 26: Latin America Non-Destructive Testing Equipment Industry Revenue (Million), by Technology 2025 & 2033
- Figure 27: Latin America Non-Destructive Testing Equipment Industry Revenue Share (%), by Technology 2025 & 2033
- Figure 28: Latin America Non-Destructive Testing Equipment Industry Revenue (Million), by End-user Industry 2025 & 2033
- Figure 29: Latin America Non-Destructive Testing Equipment Industry Revenue Share (%), by End-user Industry 2025 & 2033
- Figure 30: Latin America Non-Destructive Testing Equipment Industry Revenue (Million), by Country 2025 & 2033
- Figure 31: Latin America Non-Destructive Testing Equipment Industry Revenue Share (%), by Country 2025 & 2033
- Figure 32: Middle East and Africa Non-Destructive Testing Equipment Industry Revenue (Million), by Technology 2025 & 2033
- Figure 33: Middle East and Africa Non-Destructive Testing Equipment Industry Revenue Share (%), by Technology 2025 & 2033
- Figure 34: Middle East and Africa Non-Destructive Testing Equipment Industry Revenue (Million), by End-user Industry 2025 & 2033
- Figure 35: Middle East and Africa Non-Destructive Testing Equipment Industry Revenue Share (%), by End-user Industry 2025 & 2033
- Figure 36: Middle East and Africa Non-Destructive Testing Equipment Industry Revenue (Million), by Country 2025 & 2033
- Figure 37: Middle East and Africa Non-Destructive Testing Equipment Industry Revenue Share (%), by Country 2025 & 2033
List of Tables
- Table 1: Global Non-Destructive Testing Equipment Industry Revenue Million Forecast, by Technology 2020 & 2033
- Table 2: Global Non-Destructive Testing Equipment Industry Revenue Million Forecast, by End-user Industry 2020 & 2033
- Table 3: Global Non-Destructive Testing Equipment Industry Revenue Million Forecast, by Region 2020 & 2033
- Table 4: Global Non-Destructive Testing Equipment Industry Revenue Million Forecast, by Technology 2020 & 2033
- Table 5: Global Non-Destructive Testing Equipment Industry Revenue Million Forecast, by End-user Industry 2020 & 2033
- Table 6: Global Non-Destructive Testing Equipment Industry Revenue Million Forecast, by Country 2020 & 2033
- Table 7: United States Non-Destructive Testing Equipment Industry Revenue (Million) Forecast, by Application 2020 & 2033
- Table 8: Canada Non-Destructive Testing Equipment Industry Revenue (Million) Forecast, by Application 2020 & 2033
- Table 9: Global Non-Destructive Testing Equipment Industry Revenue Million Forecast, by Technology 2020 & 2033
- Table 10: Global Non-Destructive Testing Equipment Industry Revenue Million Forecast, by End-user Industry 2020 & 2033
- Table 11: Global Non-Destructive Testing Equipment Industry Revenue Million Forecast, by Country 2020 & 2033
- Table 12: United Kingdom Non-Destructive Testing Equipment Industry Revenue (Million) Forecast, by Application 2020 & 2033
- Table 13: Germany Non-Destructive Testing Equipment Industry Revenue (Million) Forecast, by Application 2020 & 2033
- Table 14: France Non-Destructive Testing Equipment Industry Revenue (Million) Forecast, by Application 2020 & 2033
- Table 15: Russia Non-Destructive Testing Equipment Industry Revenue (Million) Forecast, by Application 2020 & 2033
- Table 16: Italy Non-Destructive Testing Equipment Industry Revenue (Million) Forecast, by Application 2020 & 2033
- Table 17: Global Non-Destructive Testing Equipment Industry Revenue Million Forecast, by Technology 2020 & 2033
- Table 18: Global Non-Destructive Testing Equipment Industry Revenue Million Forecast, by End-user Industry 2020 & 2033
- Table 19: Global Non-Destructive Testing Equipment Industry Revenue Million Forecast, by Country 2020 & 2033
- Table 20: China Non-Destructive Testing Equipment Industry Revenue (Million) Forecast, by Application 2020 & 2033
- Table 21: India Non-Destructive Testing Equipment Industry Revenue (Million) Forecast, by Application 2020 & 2033
- Table 22: South Korea Non-Destructive Testing Equipment Industry Revenue (Million) Forecast, by Application 2020 & 2033
- Table 23: Global Non-Destructive Testing Equipment Industry Revenue Million Forecast, by Technology 2020 & 2033
- Table 24: Global Non-Destructive Testing Equipment Industry Revenue Million Forecast, by End-user Industry 2020 & 2033
- Table 25: Global Non-Destructive Testing Equipment Industry Revenue Million Forecast, by Country 2020 & 2033
- Table 26: Global Non-Destructive Testing Equipment Industry Revenue Million Forecast, by Technology 2020 & 2033
- Table 27: Global Non-Destructive Testing Equipment Industry Revenue Million Forecast, by End-user Industry 2020 & 2033
- Table 28: Global Non-Destructive Testing Equipment Industry Revenue Million Forecast, by Country 2020 & 2033
- Table 29: Mexico Non-Destructive Testing Equipment Industry Revenue (Million) Forecast, by Application 2020 & 2033
- Table 30: Brazil Non-Destructive Testing Equipment Industry Revenue (Million) Forecast, by Application 2020 & 2033
- Table 31: Argentina Non-Destructive Testing Equipment Industry Revenue (Million) Forecast, by Application 2020 & 2033
- Table 32: Global Non-Destructive Testing Equipment Industry Revenue Million Forecast, by Technology 2020 & 2033
- Table 33: Global Non-Destructive Testing Equipment Industry Revenue Million Forecast, by End-user Industry 2020 & 2033
- Table 34: Global Non-Destructive Testing Equipment Industry Revenue Million Forecast, by Country 2020 & 2033
- Table 35: Saudi Arabia Non-Destructive Testing Equipment Industry Revenue (Million) Forecast, by Application 2020 & 2033
- Table 36: United Arab Emirates Non-Destructive Testing Equipment Industry Revenue (Million) Forecast, by Application 2020 & 2033
- Table 37: Qatar Non-Destructive Testing Equipment Industry Revenue (Million) Forecast, by Application 2020 & 2033
Frequently Asked Questions
1. What is the projected Compound Annual Growth Rate (CAGR) of the Non-Destructive Testing Equipment Industry?
The projected CAGR is approximately 7.20%.
2. Which companies are prominent players in the Non-Destructive Testing Equipment Industry?
Key companies in the market include Intertek Group PLC, YXLON International GmbH (COMET Holding AG), Baker Hughes, Controle Mesure Systemes SA, Nikon Metrology NV, Fujifilm Corporation, Mistras Group Inc, OkoNDT Group, Innospection Limited, Applus+ Laboratories, Bureau Veritas SA, Olympus Corporation, Magnaflux Corp.
3. What are the main segments of the Non-Destructive Testing Equipment Industry?
The market segments include Technology, End-user Industry.
4. Can you provide details about the market size?
The market size is estimated to be USD 3.02 Million as of 2022.
5. What are some drivers contributing to market growth?
Stringent Regulations Mandating Safety; Aging Infrastructure and Increasing Need for Maintenance.
6. What are the notable trends driving market growth?
Oil and Gas Holds Highest Market Share.
7. Are there any restraints impacting market growth?
Lack of Skilled Personnel and Training Facilities.
8. Can you provide examples of recent developments in the market?
May 2023: MP Machinery and Testing announced the release of proprietary material testing equipment that non-destructively determines the material properties of structures and in-service components. MPM provides advanced material testing products and services for the steel, nuclear power & energy, aerospace, pipe, defense, and transportation industries.
9. What pricing options are available for accessing the report?
Pricing options include single-user, multi-user, and enterprise licenses priced at USD 4750, USD 5250, and USD 8750 respectively.
10. Is the market size provided in terms of value or volume?
The market size is provided in terms of value, measured in Million.
11. Are there any specific market keywords associated with the report?
Yes, the market keyword associated with the report is "Non-Destructive Testing Equipment Industry," which aids in identifying and referencing the specific market segment covered.
12. How do I determine which pricing option suits my needs best?
The pricing options vary based on user requirements and access needs. Individual users may opt for single-user licenses, while businesses requiring broader access may choose multi-user or enterprise licenses for cost-effective access to the report.
13. Are there any additional resources or data provided in the Non-Destructive Testing Equipment Industry report?
While the report offers comprehensive insights, it's advisable to review the specific contents or supplementary materials provided to ascertain if additional resources or data are available.
14. How can I stay updated on further developments or reports in the Non-Destructive Testing Equipment Industry?
To stay informed about further developments, trends, and reports in the Non-Destructive Testing Equipment Industry, consider subscribing to industry newsletters, following relevant companies and organizations, or regularly checking reputable industry news sources and publications.
Methodology
Step 1 - Identification of Relevant Samples Size from Population Database


Step 2 - Approaches for Defining Global Market Size (Value, Volume* & Price*)

Note*: In applicable scenarios
Step 3 - Data Sources
Primary Research
- Web Analytics
- Survey Reports
- Research Institute
- Latest Research Reports
- Opinion Leaders
Secondary Research
- Annual Reports
- White Paper
- Latest Press Release
- Industry Association
- Paid Database
- Investor Presentations

Step 4 - Data Triangulation
Involves using different sources of information in order to increase the validity of a study
These sources are likely to be stakeholders in a program - participants, other researchers, program staff, other community members, and so on.
Then we put all data in single framework & apply various statistical tools to find out the dynamic on the market.
During the analysis stage, feedback from the stakeholder groups would be compared to determine areas of agreement as well as areas of divergence