
Key Insights
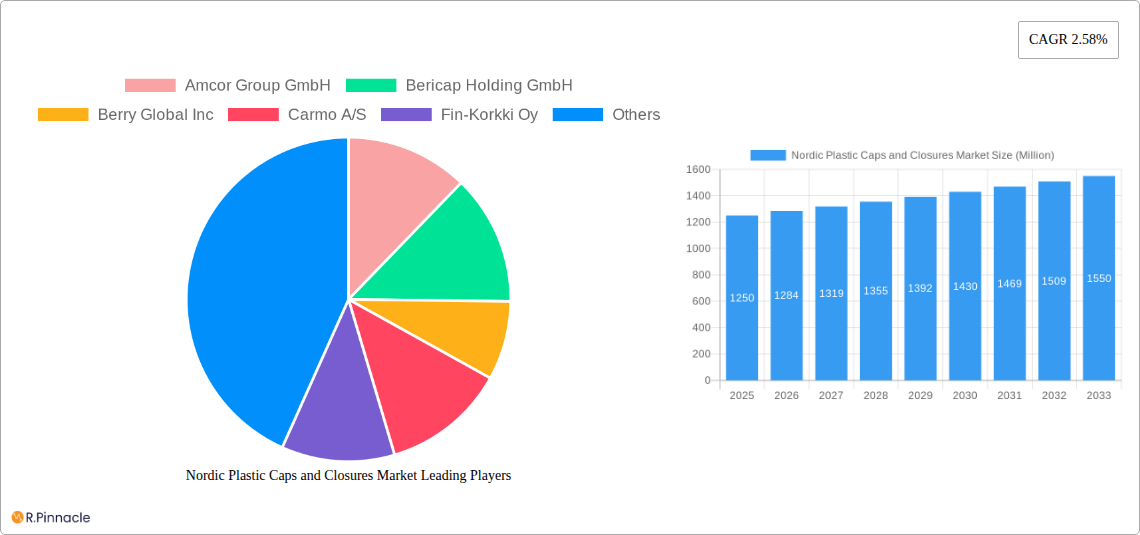
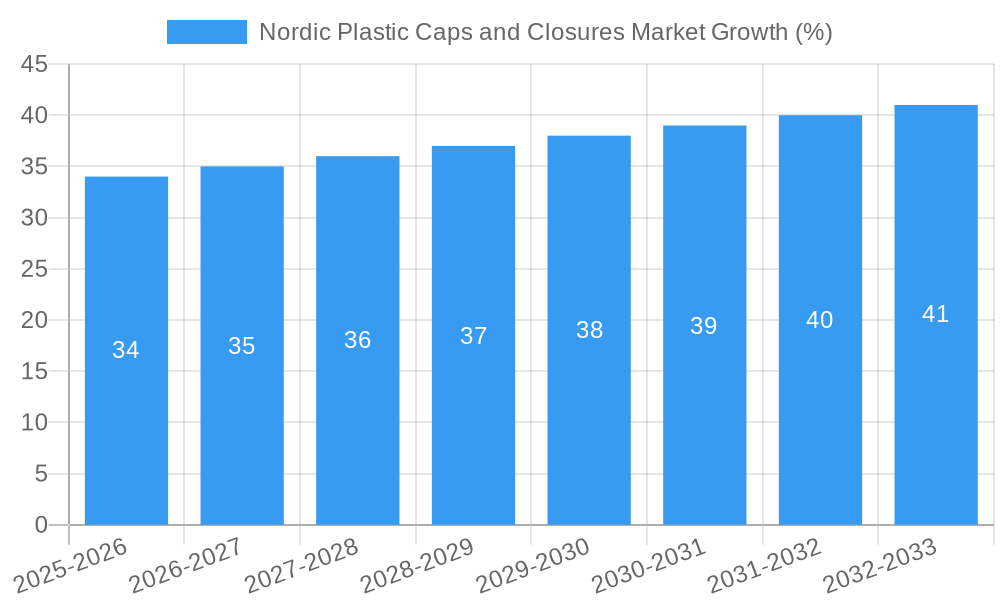
The Nordic plastic caps and closures market, valued at $1.25 billion in 2025, is projected to experience steady growth, driven primarily by the robust food and beverage industry in the region and the increasing demand for convenient packaging solutions. The market's Compound Annual Growth Rate (CAGR) of 2.58% from 2025 to 2033 reflects a consistent, albeit moderate, expansion trajectory. Key drivers include the rising popularity of single-serve packaging, the growing adoption of tamper-evident closures for enhanced product safety, and the increasing focus on sustainable and recyclable materials within the packaging sector. While the market faces potential restraints such as fluctuating raw material prices and environmental concerns surrounding plastic waste, the trend towards lightweighting and innovative closure designs is mitigating these challenges. The market is segmented by type (e.g., screw caps, flip-top closures, etc.), material (e.g., HDPE, PP, etc.), application (e.g., beverages, food, pharmaceuticals, etc.), and end-user industries. Leading players like Amcor, Berry Global, and Tetra Pak are actively engaged in product innovation and strategic partnerships to maintain their market positions. The competitive landscape is characterized by a blend of established multinational corporations and smaller, specialized players, with each focusing on specific niches and geographic markets.
The forecast period (2025-2033) will likely see continued growth, albeit at a pace influenced by macroeconomic factors and evolving consumer preferences. Increased investments in research and development by key industry participants are expected to bring about innovative closures incorporating smart technologies and improved functionalities. Regional variations in market growth will be influenced by factors such as regulatory frameworks concerning plastic waste, economic growth patterns across the Nordic countries, and the evolving preferences for sustainable packaging options. The competitive landscape is expected to remain dynamic, characterized by both organic growth through product diversification and mergers and acquisitions to consolidate market share. The focus on sustainable packaging solutions and circular economy principles will shape future market developments, driving the adoption of recycled content and biodegradable alternatives.
Nordic Plastic Caps and Closures Market: A Comprehensive Report (2019-2033)
This in-depth report provides a comprehensive analysis of the Nordic plastic caps and closures market, offering invaluable insights for industry professionals, investors, and strategic decision-makers. Covering the period 2019-2033, with a focus on 2025, this report unveils market dynamics, growth drivers, challenges, and future opportunities within this dynamic sector. The report leverages robust data and analysis to illuminate key trends and provide actionable intelligence. The total market size is estimated at xx Million in 2025, projected to reach xx Million by 2033, exhibiting a CAGR of xx%.
Nordic Plastic Caps and Closures Market Structure & Innovation Trends
The Nordic plastic caps and closures market exhibits a moderately concentrated structure, with key players like Amcor Group GmbH, Bericap Holding GmbH, Berry Global Inc, Carmo A/S, Fin-Korkki Oy, Modulpac AB, Tetra Pak International SV, and Robinson PLC holding significant market share. Market share distribution varies across segments, with xx% attributed to the top 5 players in 2025. Innovation is driven by sustainability concerns, increasing demand for lightweight packaging, and the adoption of advanced materials like bioplastics. Stringent regulatory frameworks concerning plastic waste management significantly influence the market. The market is witnessing a notable rise in mergers and acquisitions (M&A), with deal values exceeding xx Million in the past five years. Key factors driving M&A activity include expansion into new markets, access to technology, and diversification of product portfolios.
- Market Concentration: Moderately concentrated, with the top 5 players holding xx% market share in 2025.
- Innovation Drivers: Sustainability, lightweight packaging, advanced materials (bioplastics).
- Regulatory Frameworks: Stringent regulations on plastic waste management impacting market strategies.
- Product Substitutes: Growing interest in alternative closure materials (e.g., metal, cork).
- End-User Demographics: Shifting consumer preferences towards sustainable and convenient packaging solutions.
- M&A Activity: Significant M&A activity with total deal values exceeding xx Million over the past five years.
Nordic Plastic Caps and Closures Market Dynamics & Trends
The Nordic plastic caps and closures market is experiencing robust growth, driven by factors such as the burgeoning food and beverage industry, increasing demand for convenient packaging in personal care and pharmaceuticals, and the expansion of e-commerce. Technological advancements, including the development of lightweight and recyclable materials, are further fueling market expansion. Consumer preferences are shifting towards sustainable and eco-friendly packaging options, pushing manufacturers to adopt sustainable practices and introduce innovative materials. The competitive landscape is characterized by intense rivalry, with established players focusing on innovation and expansion, while emerging players target niche segments. The market penetration of sustainable packaging is growing rapidly, with xx% of the total market volume expected to be sustainable by 2033.
Dominant Regions & Segments in Nordic Plastic Caps and Closures Market
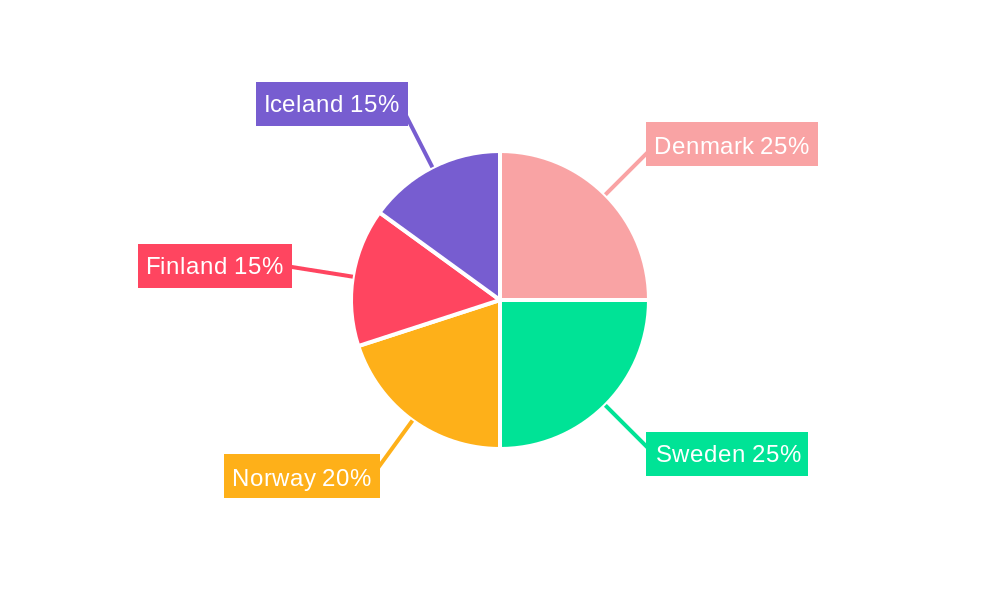
The Scandinavian region, specifically Sweden and Denmark, represent the dominant markets within the Nordic region due to factors such as strong economic growth, developed infrastructure, and a high degree of consumer awareness regarding sustainability. The food and beverage segment holds the largest market share, followed by the personal care and pharmaceutical sectors.
Key Drivers (Sweden & Denmark):
- Robust economic growth
- Developed infrastructure supporting efficient supply chains
- High consumer awareness of sustainability and eco-friendly packaging
- Strong government support for sustainable initiatives.
Dominance Analysis: The dominance of Sweden and Denmark stems from a combination of high disposable income, established retail infrastructure, and a proactive approach to environmental sustainability. This creates a favourable environment for growth within the plastic caps and closures market. Further, the high demand for food and beverage products within the region directly correlates with the increased need for efficient and reliable packaging solutions.
Nordic Plastic Caps and Closures Market Product Innovations
Recent innovations in the Nordic market include the introduction of lightweight, recyclable closures made from PE and PP, such as Berry Global Inc.'s Slimline range. This reflects a significant shift towards sustainable and efficient packaging solutions. Technological advancements, such as improved sealing technologies and tamper-evident features, are enhancing product appeal. These innovations cater to growing consumer demands for convenience, sustainability, and product integrity.
Report Scope & Segmentation Analysis
This report segments the Nordic plastic caps and closures market by material type (PE, PP, PET, others), application (food & beverage, personal care, pharmaceuticals, industrial, others), closure type (screw caps, snap caps, flip-top caps, others), and country (Sweden, Denmark, Norway, Finland, Iceland). Each segment presents distinct growth projections and competitive dynamics, providing a granular understanding of the market landscape.
Key Drivers of Nordic Plastic Caps and Closures Market Growth
Several key factors propel the growth of the Nordic plastic caps and closures market. These include the increasing demand for packaged goods across various industries, the adoption of innovative and sustainable packaging solutions, advancements in materials science leading to the development of lighter and more efficient closures, and supportive government policies promoting sustainable packaging. Furthermore, stringent regulations on plastic waste are driving the adoption of recyclable and compostable materials.
Challenges in the Nordic Plastic Caps and Closures Market Sector
The market faces challenges such as fluctuations in raw material prices, increasing environmental concerns leading to stricter regulations on plastic waste, and intense competition from both established and emerging players. Supply chain disruptions can also affect production and delivery timelines. Meeting the growing demand for sustainable alternatives while managing cost pressures is a significant challenge for market participants. The overall impact of these challenges is estimated to be a xx% reduction in market growth by 2033.
Emerging Opportunities in Nordic Plastic Caps and Closures Market
The increasing focus on sustainability presents significant opportunities for innovative and eco-friendly packaging solutions. Growing demand for lightweight and recyclable closures from PE and PP materials is creating opportunities for manufacturers. The rise of e-commerce and its associated packaging needs further fuels market expansion. The development of new materials with enhanced functionality and sustainability is another significant growth opportunity.
Leading Players in the Nordic Plastic Caps and Closures Market Market
- Amcor Group GmbH
- Bericap Holding GmbH
- Berry Global Inc
- Carmo A/S
- Fin-Korkki Oy
- Modulpac AB
- Tetra Pak International SV
- Robinson PLC
Key Developments in Nordic Plastic Caps and Closures Market Industry
- October 2023: Berry Global Inc. launched its Slimline range of lightweight tube closures made from PE and PP, targeting the personal care and pharmaceutical sectors. This reflects a strategic move towards sustainable and cost-effective solutions.
- February 2024: Robinson PLC showcased its products at Packaging Innovations and Empack in Birmingham, UK, highlighting its presence in the Danish market and commitment to innovation. This demonstrates the company's proactive approach to market engagement and expansion.
Future Outlook for Nordic Plastic Caps and Closures Market Market
The Nordic plastic caps and closures market is poised for continued growth, driven by increasing demand for sustainable and innovative packaging solutions. Strategic investments in R&D, focusing on lightweight and recyclable materials, will be crucial for market success. Companies adapting to stringent environmental regulations and embracing circular economy principles are expected to thrive. The market's future hinges on a balance between cost-effectiveness, sustainability, and functionality, creating opportunities for players who effectively meet these evolving demands.
Nordic Plastic Caps and Closures Market Segmentation
-
1. Resin
- 1.1. Polyethylene (PE)
- 1.2. Polyethylene Terephthalate (PET)
- 1.3. Polypropylene (PP)
- 1.4. Other Pl
-
2. Product Type
- 2.1. Threaded - Screw Caps, Vacuum, etc.
- 2.2. Dispensing
- 2.3. Unthread
- 2.4. Child-resistant
-
3. End-user Industries
- 3.1. Food
-
3.2. Beverage
- 3.2.1. Bottled Water
- 3.2.2. Carbonated Soft Drinks
- 3.2.3. Alcoholic Beverages
- 3.2.4. Juices and Energy Drinks
- 3.2.5. Other Beverages
- 3.3. Personal Care and Cosmetics
- 3.4. Household Chemicals
- 3.5. Other End-user Industries
Nordic Plastic Caps and Closures Market Segmentation By Geography
-
1. North America
- 1.1. United States
- 1.2. Canada
- 1.3. Mexico
-
2. South America
- 2.1. Brazil
- 2.2. Argentina
- 2.3. Rest of South America
-
3. Europe
- 3.1. United Kingdom
- 3.2. Germany
- 3.3. France
- 3.4. Italy
- 3.5. Spain
- 3.6. Russia
- 3.7. Benelux
- 3.8. Nordics
- 3.9. Rest of Europe
-
4. Middle East & Africa
- 4.1. Turkey
- 4.2. Israel
- 4.3. GCC
- 4.4. North Africa
- 4.5. South Africa
- 4.6. Rest of Middle East & Africa
-
5. Asia Pacific
- 5.1. China
- 5.2. India
- 5.3. Japan
- 5.4. South Korea
- 5.5. ASEAN
- 5.6. Oceania
- 5.7. Rest of Asia Pacific
Nordic Plastic Caps and Closures Market REPORT HIGHLIGHTS
| Aspects | Details |
|---|---|
| Study Period | 2019-2033 |
| Base Year | 2024 |
| Estimated Year | 2025 |
| Forecast Period | 2025-2033 |
| Historical Period | 2019-2024 |
| Growth Rate | CAGR of 2.58% from 2019-2033 |
| Segmentation |
|
Table of Contents
- 1. Introduction
- 1.1. Research Scope
- 1.2. Market Segmentation
- 1.3. Research Methodology
- 1.4. Definitions and Assumptions
- 2. Executive Summary
- 2.1. Introduction
- 3. Market Dynamics
- 3.1. Introduction
- 3.2. Market Drivers
- 3.2.1. Growing Tourism Boosts the Food and Beverage Industry; Increasing Product Innovation in the Market
- 3.3. Market Restrains
- 3.3.1. Growing Tourism Boosts the Food and Beverage Industry; Increasing Product Innovation in the Market
- 3.4. Market Trends
- 3.4.1. Polypropylene (PP) Segment is Estimated to Have the Largest Market Share
- 4. Market Factor Analysis
- 4.1. Porters Five Forces
- 4.2. Supply/Value Chain
- 4.3. PESTEL analysis
- 4.4. Market Entropy
- 4.5. Patent/Trademark Analysis
- 5. Global Nordic Plastic Caps and Closures Market Analysis, Insights and Forecast, 2019-2031
- 5.1. Market Analysis, Insights and Forecast - by Resin
- 5.1.1. Polyethylene (PE)
- 5.1.2. Polyethylene Terephthalate (PET)
- 5.1.3. Polypropylene (PP)
- 5.1.4. Other Pl
- 5.2. Market Analysis, Insights and Forecast - by Product Type
- 5.2.1. Threaded - Screw Caps, Vacuum, etc.
- 5.2.2. Dispensing
- 5.2.3. Unthread
- 5.2.4. Child-resistant
- 5.3. Market Analysis, Insights and Forecast - by End-user Industries
- 5.3.1. Food
- 5.3.2. Beverage
- 5.3.2.1. Bottled Water
- 5.3.2.2. Carbonated Soft Drinks
- 5.3.2.3. Alcoholic Beverages
- 5.3.2.4. Juices and Energy Drinks
- 5.3.2.5. Other Beverages
- 5.3.3. Personal Care and Cosmetics
- 5.3.4. Household Chemicals
- 5.3.5. Other End-user Industries
- 5.4. Market Analysis, Insights and Forecast - by Region
- 5.4.1. North America
- 5.4.2. South America
- 5.4.3. Europe
- 5.4.4. Middle East & Africa
- 5.4.5. Asia Pacific
- 5.1. Market Analysis, Insights and Forecast - by Resin
- 6. North America Nordic Plastic Caps and Closures Market Analysis, Insights and Forecast, 2019-2031
- 6.1. Market Analysis, Insights and Forecast - by Resin
- 6.1.1. Polyethylene (PE)
- 6.1.2. Polyethylene Terephthalate (PET)
- 6.1.3. Polypropylene (PP)
- 6.1.4. Other Pl
- 6.2. Market Analysis, Insights and Forecast - by Product Type
- 6.2.1. Threaded - Screw Caps, Vacuum, etc.
- 6.2.2. Dispensing
- 6.2.3. Unthread
- 6.2.4. Child-resistant
- 6.3. Market Analysis, Insights and Forecast - by End-user Industries
- 6.3.1. Food
- 6.3.2. Beverage
- 6.3.2.1. Bottled Water
- 6.3.2.2. Carbonated Soft Drinks
- 6.3.2.3. Alcoholic Beverages
- 6.3.2.4. Juices and Energy Drinks
- 6.3.2.5. Other Beverages
- 6.3.3. Personal Care and Cosmetics
- 6.3.4. Household Chemicals
- 6.3.5. Other End-user Industries
- 6.1. Market Analysis, Insights and Forecast - by Resin
- 7. South America Nordic Plastic Caps and Closures Market Analysis, Insights and Forecast, 2019-2031
- 7.1. Market Analysis, Insights and Forecast - by Resin
- 7.1.1. Polyethylene (PE)
- 7.1.2. Polyethylene Terephthalate (PET)
- 7.1.3. Polypropylene (PP)
- 7.1.4. Other Pl
- 7.2. Market Analysis, Insights and Forecast - by Product Type
- 7.2.1. Threaded - Screw Caps, Vacuum, etc.
- 7.2.2. Dispensing
- 7.2.3. Unthread
- 7.2.4. Child-resistant
- 7.3. Market Analysis, Insights and Forecast - by End-user Industries
- 7.3.1. Food
- 7.3.2. Beverage
- 7.3.2.1. Bottled Water
- 7.3.2.2. Carbonated Soft Drinks
- 7.3.2.3. Alcoholic Beverages
- 7.3.2.4. Juices and Energy Drinks
- 7.3.2.5. Other Beverages
- 7.3.3. Personal Care and Cosmetics
- 7.3.4. Household Chemicals
- 7.3.5. Other End-user Industries
- 7.1. Market Analysis, Insights and Forecast - by Resin
- 8. Europe Nordic Plastic Caps and Closures Market Analysis, Insights and Forecast, 2019-2031
- 8.1. Market Analysis, Insights and Forecast - by Resin
- 8.1.1. Polyethylene (PE)
- 8.1.2. Polyethylene Terephthalate (PET)
- 8.1.3. Polypropylene (PP)
- 8.1.4. Other Pl
- 8.2. Market Analysis, Insights and Forecast - by Product Type
- 8.2.1. Threaded - Screw Caps, Vacuum, etc.
- 8.2.2. Dispensing
- 8.2.3. Unthread
- 8.2.4. Child-resistant
- 8.3. Market Analysis, Insights and Forecast - by End-user Industries
- 8.3.1. Food
- 8.3.2. Beverage
- 8.3.2.1. Bottled Water
- 8.3.2.2. Carbonated Soft Drinks
- 8.3.2.3. Alcoholic Beverages
- 8.3.2.4. Juices and Energy Drinks
- 8.3.2.5. Other Beverages
- 8.3.3. Personal Care and Cosmetics
- 8.3.4. Household Chemicals
- 8.3.5. Other End-user Industries
- 8.1. Market Analysis, Insights and Forecast - by Resin
- 9. Middle East & Africa Nordic Plastic Caps and Closures Market Analysis, Insights and Forecast, 2019-2031
- 9.1. Market Analysis, Insights and Forecast - by Resin
- 9.1.1. Polyethylene (PE)
- 9.1.2. Polyethylene Terephthalate (PET)
- 9.1.3. Polypropylene (PP)
- 9.1.4. Other Pl
- 9.2. Market Analysis, Insights and Forecast - by Product Type
- 9.2.1. Threaded - Screw Caps, Vacuum, etc.
- 9.2.2. Dispensing
- 9.2.3. Unthread
- 9.2.4. Child-resistant
- 9.3. Market Analysis, Insights and Forecast - by End-user Industries
- 9.3.1. Food
- 9.3.2. Beverage
- 9.3.2.1. Bottled Water
- 9.3.2.2. Carbonated Soft Drinks
- 9.3.2.3. Alcoholic Beverages
- 9.3.2.4. Juices and Energy Drinks
- 9.3.2.5. Other Beverages
- 9.3.3. Personal Care and Cosmetics
- 9.3.4. Household Chemicals
- 9.3.5. Other End-user Industries
- 9.1. Market Analysis, Insights and Forecast - by Resin
- 10. Asia Pacific Nordic Plastic Caps and Closures Market Analysis, Insights and Forecast, 2019-2031
- 10.1. Market Analysis, Insights and Forecast - by Resin
- 10.1.1. Polyethylene (PE)
- 10.1.2. Polyethylene Terephthalate (PET)
- 10.1.3. Polypropylene (PP)
- 10.1.4. Other Pl
- 10.2. Market Analysis, Insights and Forecast - by Product Type
- 10.2.1. Threaded - Screw Caps, Vacuum, etc.
- 10.2.2. Dispensing
- 10.2.3. Unthread
- 10.2.4. Child-resistant
- 10.3. Market Analysis, Insights and Forecast - by End-user Industries
- 10.3.1. Food
- 10.3.2. Beverage
- 10.3.2.1. Bottled Water
- 10.3.2.2. Carbonated Soft Drinks
- 10.3.2.3. Alcoholic Beverages
- 10.3.2.4. Juices and Energy Drinks
- 10.3.2.5. Other Beverages
- 10.3.3. Personal Care and Cosmetics
- 10.3.4. Household Chemicals
- 10.3.5. Other End-user Industries
- 10.1. Market Analysis, Insights and Forecast - by Resin
- 11. Competitive Analysis
- 11.1. Global Market Share Analysis 2024
- 11.2. Company Profiles
- 11.2.1 Amcor Group GmbH
- 11.2.1.1. Overview
- 11.2.1.2. Products
- 11.2.1.3. SWOT Analysis
- 11.2.1.4. Recent Developments
- 11.2.1.5. Financials (Based on Availability)
- 11.2.2 Bericap Holding GmbH
- 11.2.2.1. Overview
- 11.2.2.2. Products
- 11.2.2.3. SWOT Analysis
- 11.2.2.4. Recent Developments
- 11.2.2.5. Financials (Based on Availability)
- 11.2.3 Berry Global Inc
- 11.2.3.1. Overview
- 11.2.3.2. Products
- 11.2.3.3. SWOT Analysis
- 11.2.3.4. Recent Developments
- 11.2.3.5. Financials (Based on Availability)
- 11.2.4 Carmo A/S
- 11.2.4.1. Overview
- 11.2.4.2. Products
- 11.2.4.3. SWOT Analysis
- 11.2.4.4. Recent Developments
- 11.2.4.5. Financials (Based on Availability)
- 11.2.5 Fin-Korkki Oy
- 11.2.5.1. Overview
- 11.2.5.2. Products
- 11.2.5.3. SWOT Analysis
- 11.2.5.4. Recent Developments
- 11.2.5.5. Financials (Based on Availability)
- 11.2.6 Modulpac AB
- 11.2.6.1. Overview
- 11.2.6.2. Products
- 11.2.6.3. SWOT Analysis
- 11.2.6.4. Recent Developments
- 11.2.6.5. Financials (Based on Availability)
- 11.2.7 Tetra Pak International SV
- 11.2.7.1. Overview
- 11.2.7.2. Products
- 11.2.7.3. SWOT Analysis
- 11.2.7.4. Recent Developments
- 11.2.7.5. Financials (Based on Availability)
- 11.2.8 Robinson PLC8 2 Heat Map Analysis8 3 Competitor Analysis - Emerging vs Established Player
- 11.2.8.1. Overview
- 11.2.8.2. Products
- 11.2.8.3. SWOT Analysis
- 11.2.8.4. Recent Developments
- 11.2.8.5. Financials (Based on Availability)
- 11.2.1 Amcor Group GmbH
List of Figures
- Figure 1: Global Nordic Plastic Caps and Closures Market Revenue Breakdown (Million, %) by Region 2024 & 2032
- Figure 2: Global Nordic Plastic Caps and Closures Market Volume Breakdown (Billion, %) by Region 2024 & 2032
- Figure 3: North America Nordic Plastic Caps and Closures Market Revenue (Million), by Resin 2024 & 2032
- Figure 4: North America Nordic Plastic Caps and Closures Market Volume (Billion), by Resin 2024 & 2032
- Figure 5: North America Nordic Plastic Caps and Closures Market Revenue Share (%), by Resin 2024 & 2032
- Figure 6: North America Nordic Plastic Caps and Closures Market Volume Share (%), by Resin 2024 & 2032
- Figure 7: North America Nordic Plastic Caps and Closures Market Revenue (Million), by Product Type 2024 & 2032
- Figure 8: North America Nordic Plastic Caps and Closures Market Volume (Billion), by Product Type 2024 & 2032
- Figure 9: North America Nordic Plastic Caps and Closures Market Revenue Share (%), by Product Type 2024 & 2032
- Figure 10: North America Nordic Plastic Caps and Closures Market Volume Share (%), by Product Type 2024 & 2032
- Figure 11: North America Nordic Plastic Caps and Closures Market Revenue (Million), by End-user Industries 2024 & 2032
- Figure 12: North America Nordic Plastic Caps and Closures Market Volume (Billion), by End-user Industries 2024 & 2032
- Figure 13: North America Nordic Plastic Caps and Closures Market Revenue Share (%), by End-user Industries 2024 & 2032
- Figure 14: North America Nordic Plastic Caps and Closures Market Volume Share (%), by End-user Industries 2024 & 2032
- Figure 15: North America Nordic Plastic Caps and Closures Market Revenue (Million), by Country 2024 & 2032
- Figure 16: North America Nordic Plastic Caps and Closures Market Volume (Billion), by Country 2024 & 2032
- Figure 17: North America Nordic Plastic Caps and Closures Market Revenue Share (%), by Country 2024 & 2032
- Figure 18: North America Nordic Plastic Caps and Closures Market Volume Share (%), by Country 2024 & 2032
- Figure 19: South America Nordic Plastic Caps and Closures Market Revenue (Million), by Resin 2024 & 2032
- Figure 20: South America Nordic Plastic Caps and Closures Market Volume (Billion), by Resin 2024 & 2032
- Figure 21: South America Nordic Plastic Caps and Closures Market Revenue Share (%), by Resin 2024 & 2032
- Figure 22: South America Nordic Plastic Caps and Closures Market Volume Share (%), by Resin 2024 & 2032
- Figure 23: South America Nordic Plastic Caps and Closures Market Revenue (Million), by Product Type 2024 & 2032
- Figure 24: South America Nordic Plastic Caps and Closures Market Volume (Billion), by Product Type 2024 & 2032
- Figure 25: South America Nordic Plastic Caps and Closures Market Revenue Share (%), by Product Type 2024 & 2032
- Figure 26: South America Nordic Plastic Caps and Closures Market Volume Share (%), by Product Type 2024 & 2032
- Figure 27: South America Nordic Plastic Caps and Closures Market Revenue (Million), by End-user Industries 2024 & 2032
- Figure 28: South America Nordic Plastic Caps and Closures Market Volume (Billion), by End-user Industries 2024 & 2032
- Figure 29: South America Nordic Plastic Caps and Closures Market Revenue Share (%), by End-user Industries 2024 & 2032
- Figure 30: South America Nordic Plastic Caps and Closures Market Volume Share (%), by End-user Industries 2024 & 2032
- Figure 31: South America Nordic Plastic Caps and Closures Market Revenue (Million), by Country 2024 & 2032
- Figure 32: South America Nordic Plastic Caps and Closures Market Volume (Billion), by Country 2024 & 2032
- Figure 33: South America Nordic Plastic Caps and Closures Market Revenue Share (%), by Country 2024 & 2032
- Figure 34: South America Nordic Plastic Caps and Closures Market Volume Share (%), by Country 2024 & 2032
- Figure 35: Europe Nordic Plastic Caps and Closures Market Revenue (Million), by Resin 2024 & 2032
- Figure 36: Europe Nordic Plastic Caps and Closures Market Volume (Billion), by Resin 2024 & 2032
- Figure 37: Europe Nordic Plastic Caps and Closures Market Revenue Share (%), by Resin 2024 & 2032
- Figure 38: Europe Nordic Plastic Caps and Closures Market Volume Share (%), by Resin 2024 & 2032
- Figure 39: Europe Nordic Plastic Caps and Closures Market Revenue (Million), by Product Type 2024 & 2032
- Figure 40: Europe Nordic Plastic Caps and Closures Market Volume (Billion), by Product Type 2024 & 2032
- Figure 41: Europe Nordic Plastic Caps and Closures Market Revenue Share (%), by Product Type 2024 & 2032
- Figure 42: Europe Nordic Plastic Caps and Closures Market Volume Share (%), by Product Type 2024 & 2032
- Figure 43: Europe Nordic Plastic Caps and Closures Market Revenue (Million), by End-user Industries 2024 & 2032
- Figure 44: Europe Nordic Plastic Caps and Closures Market Volume (Billion), by End-user Industries 2024 & 2032
- Figure 45: Europe Nordic Plastic Caps and Closures Market Revenue Share (%), by End-user Industries 2024 & 2032
- Figure 46: Europe Nordic Plastic Caps and Closures Market Volume Share (%), by End-user Industries 2024 & 2032
- Figure 47: Europe Nordic Plastic Caps and Closures Market Revenue (Million), by Country 2024 & 2032
- Figure 48: Europe Nordic Plastic Caps and Closures Market Volume (Billion), by Country 2024 & 2032
- Figure 49: Europe Nordic Plastic Caps and Closures Market Revenue Share (%), by Country 2024 & 2032
- Figure 50: Europe Nordic Plastic Caps and Closures Market Volume Share (%), by Country 2024 & 2032
- Figure 51: Middle East & Africa Nordic Plastic Caps and Closures Market Revenue (Million), by Resin 2024 & 2032
- Figure 52: Middle East & Africa Nordic Plastic Caps and Closures Market Volume (Billion), by Resin 2024 & 2032
- Figure 53: Middle East & Africa Nordic Plastic Caps and Closures Market Revenue Share (%), by Resin 2024 & 2032
- Figure 54: Middle East & Africa Nordic Plastic Caps and Closures Market Volume Share (%), by Resin 2024 & 2032
- Figure 55: Middle East & Africa Nordic Plastic Caps and Closures Market Revenue (Million), by Product Type 2024 & 2032
- Figure 56: Middle East & Africa Nordic Plastic Caps and Closures Market Volume (Billion), by Product Type 2024 & 2032
- Figure 57: Middle East & Africa Nordic Plastic Caps and Closures Market Revenue Share (%), by Product Type 2024 & 2032
- Figure 58: Middle East & Africa Nordic Plastic Caps and Closures Market Volume Share (%), by Product Type 2024 & 2032
- Figure 59: Middle East & Africa Nordic Plastic Caps and Closures Market Revenue (Million), by End-user Industries 2024 & 2032
- Figure 60: Middle East & Africa Nordic Plastic Caps and Closures Market Volume (Billion), by End-user Industries 2024 & 2032
- Figure 61: Middle East & Africa Nordic Plastic Caps and Closures Market Revenue Share (%), by End-user Industries 2024 & 2032
- Figure 62: Middle East & Africa Nordic Plastic Caps and Closures Market Volume Share (%), by End-user Industries 2024 & 2032
- Figure 63: Middle East & Africa Nordic Plastic Caps and Closures Market Revenue (Million), by Country 2024 & 2032
- Figure 64: Middle East & Africa Nordic Plastic Caps and Closures Market Volume (Billion), by Country 2024 & 2032
- Figure 65: Middle East & Africa Nordic Plastic Caps and Closures Market Revenue Share (%), by Country 2024 & 2032
- Figure 66: Middle East & Africa Nordic Plastic Caps and Closures Market Volume Share (%), by Country 2024 & 2032
- Figure 67: Asia Pacific Nordic Plastic Caps and Closures Market Revenue (Million), by Resin 2024 & 2032
- Figure 68: Asia Pacific Nordic Plastic Caps and Closures Market Volume (Billion), by Resin 2024 & 2032
- Figure 69: Asia Pacific Nordic Plastic Caps and Closures Market Revenue Share (%), by Resin 2024 & 2032
- Figure 70: Asia Pacific Nordic Plastic Caps and Closures Market Volume Share (%), by Resin 2024 & 2032
- Figure 71: Asia Pacific Nordic Plastic Caps and Closures Market Revenue (Million), by Product Type 2024 & 2032
- Figure 72: Asia Pacific Nordic Plastic Caps and Closures Market Volume (Billion), by Product Type 2024 & 2032
- Figure 73: Asia Pacific Nordic Plastic Caps and Closures Market Revenue Share (%), by Product Type 2024 & 2032
- Figure 74: Asia Pacific Nordic Plastic Caps and Closures Market Volume Share (%), by Product Type 2024 & 2032
- Figure 75: Asia Pacific Nordic Plastic Caps and Closures Market Revenue (Million), by End-user Industries 2024 & 2032
- Figure 76: Asia Pacific Nordic Plastic Caps and Closures Market Volume (Billion), by End-user Industries 2024 & 2032
- Figure 77: Asia Pacific Nordic Plastic Caps and Closures Market Revenue Share (%), by End-user Industries 2024 & 2032
- Figure 78: Asia Pacific Nordic Plastic Caps and Closures Market Volume Share (%), by End-user Industries 2024 & 2032
- Figure 79: Asia Pacific Nordic Plastic Caps and Closures Market Revenue (Million), by Country 2024 & 2032
- Figure 80: Asia Pacific Nordic Plastic Caps and Closures Market Volume (Billion), by Country 2024 & 2032
- Figure 81: Asia Pacific Nordic Plastic Caps and Closures Market Revenue Share (%), by Country 2024 & 2032
- Figure 82: Asia Pacific Nordic Plastic Caps and Closures Market Volume Share (%), by Country 2024 & 2032
List of Tables
- Table 1: Global Nordic Plastic Caps and Closures Market Revenue Million Forecast, by Region 2019 & 2032
- Table 2: Global Nordic Plastic Caps and Closures Market Volume Billion Forecast, by Region 2019 & 2032
- Table 3: Global Nordic Plastic Caps and Closures Market Revenue Million Forecast, by Resin 2019 & 2032
- Table 4: Global Nordic Plastic Caps and Closures Market Volume Billion Forecast, by Resin 2019 & 2032
- Table 5: Global Nordic Plastic Caps and Closures Market Revenue Million Forecast, by Product Type 2019 & 2032
- Table 6: Global Nordic Plastic Caps and Closures Market Volume Billion Forecast, by Product Type 2019 & 2032
- Table 7: Global Nordic Plastic Caps and Closures Market Revenue Million Forecast, by End-user Industries 2019 & 2032
- Table 8: Global Nordic Plastic Caps and Closures Market Volume Billion Forecast, by End-user Industries 2019 & 2032
- Table 9: Global Nordic Plastic Caps and Closures Market Revenue Million Forecast, by Region 2019 & 2032
- Table 10: Global Nordic Plastic Caps and Closures Market Volume Billion Forecast, by Region 2019 & 2032
- Table 11: Global Nordic Plastic Caps and Closures Market Revenue Million Forecast, by Resin 2019 & 2032
- Table 12: Global Nordic Plastic Caps and Closures Market Volume Billion Forecast, by Resin 2019 & 2032
- Table 13: Global Nordic Plastic Caps and Closures Market Revenue Million Forecast, by Product Type 2019 & 2032
- Table 14: Global Nordic Plastic Caps and Closures Market Volume Billion Forecast, by Product Type 2019 & 2032
- Table 15: Global Nordic Plastic Caps and Closures Market Revenue Million Forecast, by End-user Industries 2019 & 2032
- Table 16: Global Nordic Plastic Caps and Closures Market Volume Billion Forecast, by End-user Industries 2019 & 2032
- Table 17: Global Nordic Plastic Caps and Closures Market Revenue Million Forecast, by Country 2019 & 2032
- Table 18: Global Nordic Plastic Caps and Closures Market Volume Billion Forecast, by Country 2019 & 2032
- Table 19: United States Nordic Plastic Caps and Closures Market Revenue (Million) Forecast, by Application 2019 & 2032
- Table 20: United States Nordic Plastic Caps and Closures Market Volume (Billion) Forecast, by Application 2019 & 2032
- Table 21: Canada Nordic Plastic Caps and Closures Market Revenue (Million) Forecast, by Application 2019 & 2032
- Table 22: Canada Nordic Plastic Caps and Closures Market Volume (Billion) Forecast, by Application 2019 & 2032
- Table 23: Mexico Nordic Plastic Caps and Closures Market Revenue (Million) Forecast, by Application 2019 & 2032
- Table 24: Mexico Nordic Plastic Caps and Closures Market Volume (Billion) Forecast, by Application 2019 & 2032
- Table 25: Global Nordic Plastic Caps and Closures Market Revenue Million Forecast, by Resin 2019 & 2032
- Table 26: Global Nordic Plastic Caps and Closures Market Volume Billion Forecast, by Resin 2019 & 2032
- Table 27: Global Nordic Plastic Caps and Closures Market Revenue Million Forecast, by Product Type 2019 & 2032
- Table 28: Global Nordic Plastic Caps and Closures Market Volume Billion Forecast, by Product Type 2019 & 2032
- Table 29: Global Nordic Plastic Caps and Closures Market Revenue Million Forecast, by End-user Industries 2019 & 2032
- Table 30: Global Nordic Plastic Caps and Closures Market Volume Billion Forecast, by End-user Industries 2019 & 2032
- Table 31: Global Nordic Plastic Caps and Closures Market Revenue Million Forecast, by Country 2019 & 2032
- Table 32: Global Nordic Plastic Caps and Closures Market Volume Billion Forecast, by Country 2019 & 2032
- Table 33: Brazil Nordic Plastic Caps and Closures Market Revenue (Million) Forecast, by Application 2019 & 2032
- Table 34: Brazil Nordic Plastic Caps and Closures Market Volume (Billion) Forecast, by Application 2019 & 2032
- Table 35: Argentina Nordic Plastic Caps and Closures Market Revenue (Million) Forecast, by Application 2019 & 2032
- Table 36: Argentina Nordic Plastic Caps and Closures Market Volume (Billion) Forecast, by Application 2019 & 2032
- Table 37: Rest of South America Nordic Plastic Caps and Closures Market Revenue (Million) Forecast, by Application 2019 & 2032
- Table 38: Rest of South America Nordic Plastic Caps and Closures Market Volume (Billion) Forecast, by Application 2019 & 2032
- Table 39: Global Nordic Plastic Caps and Closures Market Revenue Million Forecast, by Resin 2019 & 2032
- Table 40: Global Nordic Plastic Caps and Closures Market Volume Billion Forecast, by Resin 2019 & 2032
- Table 41: Global Nordic Plastic Caps and Closures Market Revenue Million Forecast, by Product Type 2019 & 2032
- Table 42: Global Nordic Plastic Caps and Closures Market Volume Billion Forecast, by Product Type 2019 & 2032
- Table 43: Global Nordic Plastic Caps and Closures Market Revenue Million Forecast, by End-user Industries 2019 & 2032
- Table 44: Global Nordic Plastic Caps and Closures Market Volume Billion Forecast, by End-user Industries 2019 & 2032
- Table 45: Global Nordic Plastic Caps and Closures Market Revenue Million Forecast, by Country 2019 & 2032
- Table 46: Global Nordic Plastic Caps and Closures Market Volume Billion Forecast, by Country 2019 & 2032
- Table 47: United Kingdom Nordic Plastic Caps and Closures Market Revenue (Million) Forecast, by Application 2019 & 2032
- Table 48: United Kingdom Nordic Plastic Caps and Closures Market Volume (Billion) Forecast, by Application 2019 & 2032
- Table 49: Germany Nordic Plastic Caps and Closures Market Revenue (Million) Forecast, by Application 2019 & 2032
- Table 50: Germany Nordic Plastic Caps and Closures Market Volume (Billion) Forecast, by Application 2019 & 2032
- Table 51: France Nordic Plastic Caps and Closures Market Revenue (Million) Forecast, by Application 2019 & 2032
- Table 52: France Nordic Plastic Caps and Closures Market Volume (Billion) Forecast, by Application 2019 & 2032
- Table 53: Italy Nordic Plastic Caps and Closures Market Revenue (Million) Forecast, by Application 2019 & 2032
- Table 54: Italy Nordic Plastic Caps and Closures Market Volume (Billion) Forecast, by Application 2019 & 2032
- Table 55: Spain Nordic Plastic Caps and Closures Market Revenue (Million) Forecast, by Application 2019 & 2032
- Table 56: Spain Nordic Plastic Caps and Closures Market Volume (Billion) Forecast, by Application 2019 & 2032
- Table 57: Russia Nordic Plastic Caps and Closures Market Revenue (Million) Forecast, by Application 2019 & 2032
- Table 58: Russia Nordic Plastic Caps and Closures Market Volume (Billion) Forecast, by Application 2019 & 2032
- Table 59: Benelux Nordic Plastic Caps and Closures Market Revenue (Million) Forecast, by Application 2019 & 2032
- Table 60: Benelux Nordic Plastic Caps and Closures Market Volume (Billion) Forecast, by Application 2019 & 2032
- Table 61: Nordics Nordic Plastic Caps and Closures Market Revenue (Million) Forecast, by Application 2019 & 2032
- Table 62: Nordics Nordic Plastic Caps and Closures Market Volume (Billion) Forecast, by Application 2019 & 2032
- Table 63: Rest of Europe Nordic Plastic Caps and Closures Market Revenue (Million) Forecast, by Application 2019 & 2032
- Table 64: Rest of Europe Nordic Plastic Caps and Closures Market Volume (Billion) Forecast, by Application 2019 & 2032
- Table 65: Global Nordic Plastic Caps and Closures Market Revenue Million Forecast, by Resin 2019 & 2032
- Table 66: Global Nordic Plastic Caps and Closures Market Volume Billion Forecast, by Resin 2019 & 2032
- Table 67: Global Nordic Plastic Caps and Closures Market Revenue Million Forecast, by Product Type 2019 & 2032
- Table 68: Global Nordic Plastic Caps and Closures Market Volume Billion Forecast, by Product Type 2019 & 2032
- Table 69: Global Nordic Plastic Caps and Closures Market Revenue Million Forecast, by End-user Industries 2019 & 2032
- Table 70: Global Nordic Plastic Caps and Closures Market Volume Billion Forecast, by End-user Industries 2019 & 2032
- Table 71: Global Nordic Plastic Caps and Closures Market Revenue Million Forecast, by Country 2019 & 2032
- Table 72: Global Nordic Plastic Caps and Closures Market Volume Billion Forecast, by Country 2019 & 2032
- Table 73: Turkey Nordic Plastic Caps and Closures Market Revenue (Million) Forecast, by Application 2019 & 2032
- Table 74: Turkey Nordic Plastic Caps and Closures Market Volume (Billion) Forecast, by Application 2019 & 2032
- Table 75: Israel Nordic Plastic Caps and Closures Market Revenue (Million) Forecast, by Application 2019 & 2032
- Table 76: Israel Nordic Plastic Caps and Closures Market Volume (Billion) Forecast, by Application 2019 & 2032
- Table 77: GCC Nordic Plastic Caps and Closures Market Revenue (Million) Forecast, by Application 2019 & 2032
- Table 78: GCC Nordic Plastic Caps and Closures Market Volume (Billion) Forecast, by Application 2019 & 2032
- Table 79: North Africa Nordic Plastic Caps and Closures Market Revenue (Million) Forecast, by Application 2019 & 2032
- Table 80: North Africa Nordic Plastic Caps and Closures Market Volume (Billion) Forecast, by Application 2019 & 2032
- Table 81: South Africa Nordic Plastic Caps and Closures Market Revenue (Million) Forecast, by Application 2019 & 2032
- Table 82: South Africa Nordic Plastic Caps and Closures Market Volume (Billion) Forecast, by Application 2019 & 2032
- Table 83: Rest of Middle East & Africa Nordic Plastic Caps and Closures Market Revenue (Million) Forecast, by Application 2019 & 2032
- Table 84: Rest of Middle East & Africa Nordic Plastic Caps and Closures Market Volume (Billion) Forecast, by Application 2019 & 2032
- Table 85: Global Nordic Plastic Caps and Closures Market Revenue Million Forecast, by Resin 2019 & 2032
- Table 86: Global Nordic Plastic Caps and Closures Market Volume Billion Forecast, by Resin 2019 & 2032
- Table 87: Global Nordic Plastic Caps and Closures Market Revenue Million Forecast, by Product Type 2019 & 2032
- Table 88: Global Nordic Plastic Caps and Closures Market Volume Billion Forecast, by Product Type 2019 & 2032
- Table 89: Global Nordic Plastic Caps and Closures Market Revenue Million Forecast, by End-user Industries 2019 & 2032
- Table 90: Global Nordic Plastic Caps and Closures Market Volume Billion Forecast, by End-user Industries 2019 & 2032
- Table 91: Global Nordic Plastic Caps and Closures Market Revenue Million Forecast, by Country 2019 & 2032
- Table 92: Global Nordic Plastic Caps and Closures Market Volume Billion Forecast, by Country 2019 & 2032
- Table 93: China Nordic Plastic Caps and Closures Market Revenue (Million) Forecast, by Application 2019 & 2032
- Table 94: China Nordic Plastic Caps and Closures Market Volume (Billion) Forecast, by Application 2019 & 2032
- Table 95: India Nordic Plastic Caps and Closures Market Revenue (Million) Forecast, by Application 2019 & 2032
- Table 96: India Nordic Plastic Caps and Closures Market Volume (Billion) Forecast, by Application 2019 & 2032
- Table 97: Japan Nordic Plastic Caps and Closures Market Revenue (Million) Forecast, by Application 2019 & 2032
- Table 98: Japan Nordic Plastic Caps and Closures Market Volume (Billion) Forecast, by Application 2019 & 2032
- Table 99: South Korea Nordic Plastic Caps and Closures Market Revenue (Million) Forecast, by Application 2019 & 2032
- Table 100: South Korea Nordic Plastic Caps and Closures Market Volume (Billion) Forecast, by Application 2019 & 2032
- Table 101: ASEAN Nordic Plastic Caps and Closures Market Revenue (Million) Forecast, by Application 2019 & 2032
- Table 102: ASEAN Nordic Plastic Caps and Closures Market Volume (Billion) Forecast, by Application 2019 & 2032
- Table 103: Oceania Nordic Plastic Caps and Closures Market Revenue (Million) Forecast, by Application 2019 & 2032
- Table 104: Oceania Nordic Plastic Caps and Closures Market Volume (Billion) Forecast, by Application 2019 & 2032
- Table 105: Rest of Asia Pacific Nordic Plastic Caps and Closures Market Revenue (Million) Forecast, by Application 2019 & 2032
- Table 106: Rest of Asia Pacific Nordic Plastic Caps and Closures Market Volume (Billion) Forecast, by Application 2019 & 2032
Frequently Asked Questions
1. What is the projected Compound Annual Growth Rate (CAGR) of the Nordic Plastic Caps and Closures Market?
The projected CAGR is approximately 2.58%.
2. Which companies are prominent players in the Nordic Plastic Caps and Closures Market?
Key companies in the market include Amcor Group GmbH, Bericap Holding GmbH, Berry Global Inc, Carmo A/S, Fin-Korkki Oy, Modulpac AB, Tetra Pak International SV, Robinson PLC8 2 Heat Map Analysis8 3 Competitor Analysis - Emerging vs Established Player.
3. What are the main segments of the Nordic Plastic Caps and Closures Market?
The market segments include Resin, Product Type, End-user Industries.
4. Can you provide details about the market size?
The market size is estimated to be USD 1.25 Million as of 2022.
5. What are some drivers contributing to market growth?
Growing Tourism Boosts the Food and Beverage Industry; Increasing Product Innovation in the Market.
6. What are the notable trends driving market growth?
Polypropylene (PP) Segment is Estimated to Have the Largest Market Share.
7. Are there any restraints impacting market growth?
Growing Tourism Boosts the Food and Beverage Industry; Increasing Product Innovation in the Market.
8. Can you provide examples of recent developments in the market?
February 2024: Robinson PLC, a UK-based company operating in Denmark, exhibited its products at Packaging Innovations and Empack, hosted at Birmingham's National Exhibition Centre (NEC).
9. What pricing options are available for accessing the report?
Pricing options include single-user, multi-user, and enterprise licenses priced at USD 3800, USD 4500, and USD 5800 respectively.
10. Is the market size provided in terms of value or volume?
The market size is provided in terms of value, measured in Million and volume, measured in Billion.
11. Are there any specific market keywords associated with the report?
Yes, the market keyword associated with the report is "Nordic Plastic Caps and Closures Market," which aids in identifying and referencing the specific market segment covered.
12. How do I determine which pricing option suits my needs best?
The pricing options vary based on user requirements and access needs. Individual users may opt for single-user licenses, while businesses requiring broader access may choose multi-user or enterprise licenses for cost-effective access to the report.
13. Are there any additional resources or data provided in the Nordic Plastic Caps and Closures Market report?
While the report offers comprehensive insights, it's advisable to review the specific contents or supplementary materials provided to ascertain if additional resources or data are available.
14. How can I stay updated on further developments or reports in the Nordic Plastic Caps and Closures Market?
To stay informed about further developments, trends, and reports in the Nordic Plastic Caps and Closures Market, consider subscribing to industry newsletters, following relevant companies and organizations, or regularly checking reputable industry news sources and publications.
Methodology
Step 1 - Identification of Relevant Samples Size from Population Database


Step 2 - Approaches for Defining Global Market Size (Value, Volume* & Price*)

Note*: In applicable scenarios
Step 3 - Data Sources
Primary Research
- Web Analytics
- Survey Reports
- Research Institute
- Latest Research Reports
- Opinion Leaders
Secondary Research
- Annual Reports
- White Paper
- Latest Press Release
- Industry Association
- Paid Database
- Investor Presentations

Step 4 - Data Triangulation
Involves using different sources of information in order to increase the validity of a study
These sources are likely to be stakeholders in a program - participants, other researchers, program staff, other community members, and so on.
Then we put all data in single framework & apply various statistical tools to find out the dynamic on the market.
During the analysis stage, feedback from the stakeholder groups would be compared to determine areas of agreement as well as areas of divergence


