
Key Insights
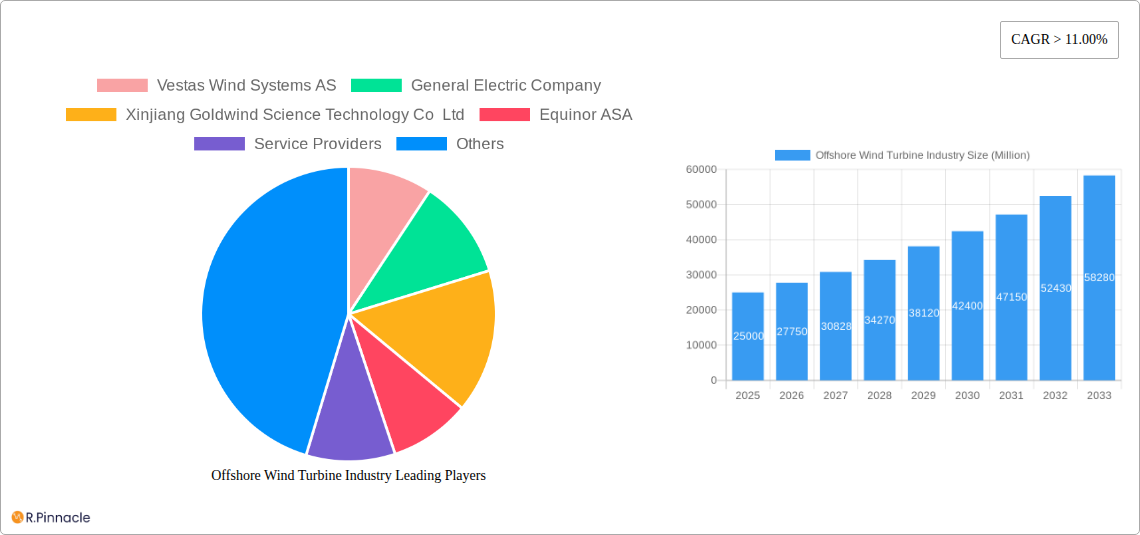
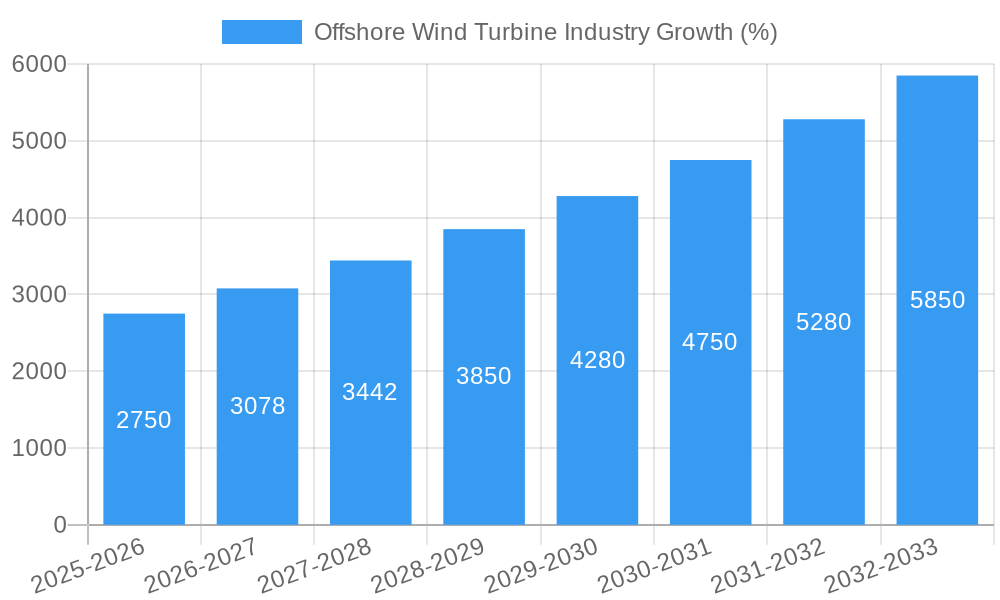
The offshore wind turbine industry is experiencing robust growth, driven by the global imperative to transition to renewable energy sources and mitigate climate change. The market, currently valued in the billions (exact figure unavailable but estimated based on the 11% CAGR and provided data points to a substantial market size) is projected to maintain a Compound Annual Growth Rate (CAGR) exceeding 11% from 2025 to 2033. This expansion is fueled by several key factors: supportive government policies and subsidies incentivizing offshore wind energy development, technological advancements leading to increased turbine capacity and efficiency (particularly in the "Greater Than or Equal to 5 MW" segment, expected to show higher growth), and falling installation and maintenance costs making the technology increasingly competitive with fossil fuels. Furthermore, a growing awareness of the environmental impact of traditional energy sources, coupled with ambitious renewable energy targets set by many countries, is further boosting demand. The Asia-Pacific region, particularly China, is expected to be a major growth driver due to significant investments and supportive government initiatives.
However, the industry also faces challenges. These include the high initial capital expenditure required for offshore wind farm development, complex permitting and regulatory processes, potential environmental impacts (e.g., on marine ecosystems), and the logistical challenges associated with offshore installation and maintenance in often harsh weather conditions. The "Fixed Foundation" segment currently holds a larger market share but the "Floating Foundation" segment is expected to gain significant traction in deeper waters, presenting both opportunities and technological hurdles to overcome. Competition among major players such as Vestas, GE, Goldwind, and Siemens Gamesa will intensify, pushing innovation and cost reduction. The market segmentation by capacity (less than and greater than or equal to 5 MW) highlights the strategic importance of technological advances in turbine capacity, directly impacting overall project economics and profitability. Success in this market will depend on companies' ability to navigate these challenges and adapt to the evolving technological and regulatory landscape.
Offshore Wind Turbine Industry: A Comprehensive Market Report (2019-2033)
This comprehensive report provides an in-depth analysis of the offshore wind turbine industry, offering invaluable insights for industry professionals, investors, and stakeholders. Covering the period from 2019 to 2033, with a focus on 2025, this report analyzes market dynamics, technological advancements, key players, and future growth potential. The report leverages extensive market data and expert analysis to provide actionable intelligence for strategic decision-making. Market values are expressed in Millions.
Offshore Wind Turbine Industry Market Structure & Innovation Trends
This section analyzes the market structure of the offshore wind turbine industry, focusing on market concentration, innovation drivers, regulatory frameworks, product substitutes, end-user demographics, and M&A activities. The global offshore wind turbine market is characterized by a moderately concentrated landscape with a few major players holding significant market share. Vestas Wind Systems AS, Siemens Gamesa Renewable Energy SA, and General Electric Company are among the leading players, collectively accounting for an estimated xx% of the market share in 2025. However, several regional players and smaller specialized companies are also contributing to the industry's growth.
- Market Concentration: High, with top 5 players controlling approximately xx% of the market.
- Innovation Drivers: Technological advancements in turbine design, increased focus on efficiency and cost reduction, and supportive government policies.
- Regulatory Frameworks: Stringent safety regulations, permitting processes, and grid integration standards vary significantly across regions.
- Product Substitutes: Other renewable energy sources such as solar power and onshore wind power offer competition.
- End-User Demographics: Primarily utility companies, independent power producers, and government entities.
- M&A Activities: The industry has witnessed significant M&A activity in recent years, with deal values totaling approximately $xx Million in 2024. These acquisitions aim to expand geographic reach, enhance technological capabilities, and consolidate market share.
Offshore Wind Turbine Industry Market Dynamics & Trends
The offshore wind turbine market is experiencing robust growth, driven by increasing global demand for renewable energy, supportive government policies, and technological advancements. The market's Compound Annual Growth Rate (CAGR) is projected to be xx% during the forecast period (2025-2033). Market penetration is expected to increase significantly in both developed and emerging economies due to declining technology costs and rising energy security concerns. Technological disruptions, such as advancements in floating foundation technology, are opening up new possibilities in deeper waters. Consumer preference for cleaner energy sources further fuels market growth, whilst competitive dynamics are characterized by intense competition, particularly among major Original Equipment Manufacturers (OEMs) and service providers.
Dominant Regions & Segments in Offshore Wind Turbine Industry
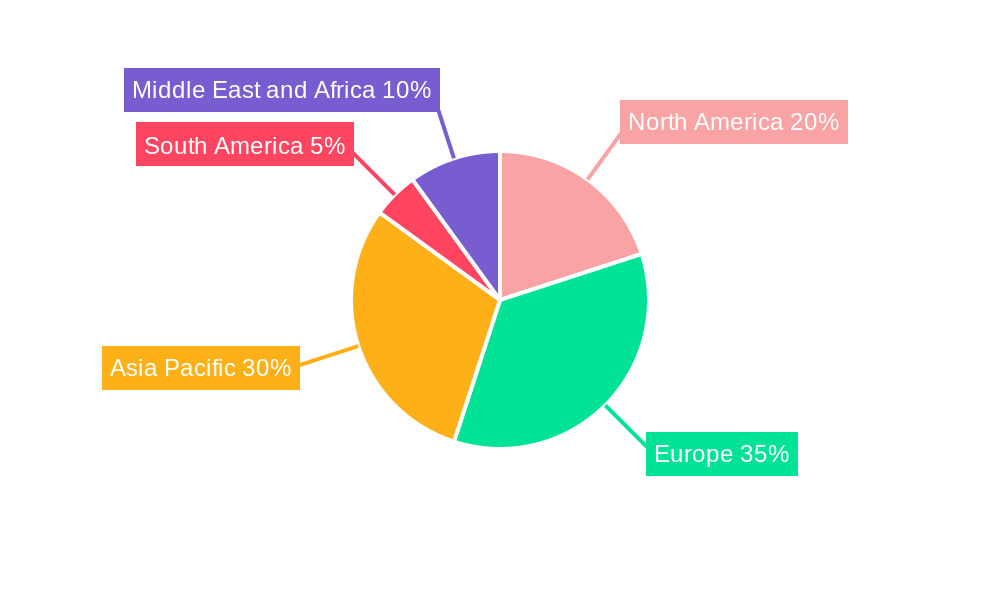
Europe, particularly the UK, Germany, and Denmark, holds the dominant position in the offshore wind turbine market due to established infrastructure, supportive government policies, and early adoption of offshore wind technology. The Asia-Pacific region is witnessing rapid growth, primarily driven by China's ambitious renewable energy targets and substantial investments in offshore wind capacity.
- Dominant Region: Europe (specifically the UK, Germany, and Denmark)
- Dominant Foundation Type: Fixed Foundation (currently holds a larger market share compared to floating foundation, although floating is experiencing rapid growth)
- Dominant Capacity Segment: Greater than or equal to 5 MW (This segment shows significant market growth, driven by economies of scale and improved efficiency)
Key Drivers:
- Europe: Strong government support through subsidies, tax incentives, and renewable energy targets. Established supply chains and infrastructure, experience and technical expertise.
- Asia-Pacific (China): Government's aggressive renewable energy expansion strategy and huge investments in offshore wind projects. Large coastal areas suitable for offshore wind farms.
Offshore Wind Turbine Industry Product Innovations
The offshore wind turbine industry is marked by continuous product innovation, primarily focused on enhancing efficiency, increasing capacity, and reducing costs. Recent developments include the integration of advanced materials, improved blade designs, and the implementation of digital technologies for predictive maintenance and operational optimization. These innovations significantly contribute to improved energy yield, reduced lifecycle costs, and enhanced operational reliability, leading to higher market acceptance. Floating foundation technology is a particularly promising area of innovation, opening up opportunities for harnessing wind energy in deeper waters.
Report Scope & Segmentation Analysis
This report segments the offshore wind turbine market based on foundation type (fixed and floating) and capacity (less than 5 MW and greater than or equal to 5 MW). The fixed foundation segment currently dominates the market, driven by established technology and lower costs. However, the floating foundation segment is expected to witness substantial growth over the forecast period, driven by advancements in technology and the potential to exploit deepwater resources. The greater than or equal to 5 MW capacity segment is experiencing faster growth, owing to economies of scale and improved efficiency. Both segments are expected to display significant growth during the forecast period, with the greater than or equal to 5 MW capacity segment exhibiting a faster expansion rate.
Key Drivers of Offshore Wind Turbine Industry Growth
Several key factors are driving the growth of the offshore wind turbine industry. These include:
- Government policies and regulations: Numerous governments are implementing supportive policies and regulations, including renewable energy targets, subsidies, and tax incentives, to encourage the development of offshore wind energy.
- Technological advancements: Innovations in turbine design, materials science, and control systems are leading to increased efficiency, capacity, and reliability of offshore wind turbines.
- Decreasing costs: Economies of scale and technological advancements are driving down the costs of offshore wind energy, making it increasingly competitive with traditional energy sources.
Challenges in the Offshore Wind Turbine Industry Sector
Despite its growth potential, the offshore wind turbine industry faces several challenges:
- High capital costs: The initial investment required for offshore wind projects is significant, often posing a barrier to entry for smaller companies.
- Supply chain constraints: The availability of specialized components and skilled labor can sometimes constrain project development and deployment.
- Environmental concerns: Potential impacts on marine ecosystems and visual impacts are significant concerns that need mitigation strategies.
Emerging Opportunities in Offshore Wind Turbine Industry
The offshore wind turbine industry presents numerous emerging opportunities:
- Floating wind farms: The ability to harness wind energy in deep waters opens vast untapped resources.
- Hybrid energy systems: Integration of offshore wind with other renewable energy technologies offers diversification and resilience.
- Digitalization and smart grids: Advanced monitoring, control, and grid management systems enhance efficiency and reduce operational costs.
Leading Players in the Offshore Wind Turbine Industry Market
- Vestas Wind Systems AS
- General Electric Company
- Xinjiang Goldwind Science Technology Co Ltd
- Equinor ASA
- Service Providers
- Nordex SE
- Operators
- E.ON SE
- Northland Power Inc
- Suzlon Energy Limited
- Siemens Gamesa Renewable Energy SA
- Ørsted AS
- EDF SA
Key Developments in Offshore Wind Turbine Industry
- August 2022: Ping Petroleum and Cerulean Winds signed an agreement to develop a floating wind power solution for the Avalon oil project in the UK North Sea.
- April 2022: General Electric (GE) Company started building a facility in Bergen to 3D print wind turbine tower bottom portions, reducing transportation costs.
Future Outlook for Offshore Wind Turbine Market
The future outlook for the offshore wind turbine market is highly positive, driven by increasing global demand for renewable energy, technological advancements, and supportive government policies. The market is expected to witness sustained growth over the forecast period, with significant opportunities for innovation and expansion into new markets. The increasing focus on energy security and decarbonization will further propel the sector's growth in the coming years. Strategic partnerships, technological advancements, and government support will shape the industry's trajectory, potentially leading to a considerable increase in global offshore wind capacity.
Offshore Wind Turbine Industry Segmentation
-
1. Foundation Type
- 1.1. Fixed Foundation
- 1.2. Floating Foundation
-
2. Capacity
- 2.1. Less Than 5 MW
- 2.2. Greater Than or Equal to 5 MW
Offshore Wind Turbine Industry Segmentation By Geography
-
1. North America
- 1.1. United States
- 1.2. Canada
-
2. Asia Pacific
- 2.1. China
- 2.2. India
- 2.3. Japan
- 2.4. South Korea
- 2.5. Rest of Asia Pacific
-
3. Europe
- 3.1. Germany
- 3.2. United Kingdom
- 3.3. Netherlands
- 3.4. Spain
- 3.5. Norway
- 3.6. Rest of Europe
-
4. South America
- 4.1. Brazil
- 4.2. Argentina
- 4.3. Rest of South America
-
5. Middle East and Africa
- 5.1. Saudi Arabia
- 5.2. United Arab Emirates
- 5.3. South Africa
- 5.4. Rest of Middle East and Africa
Offshore Wind Turbine Industry REPORT HIGHLIGHTS
| Aspects | Details |
|---|---|
| Study Period | 2019-2033 |
| Base Year | 2024 |
| Estimated Year | 2025 |
| Forecast Period | 2025-2033 |
| Historical Period | 2019-2024 |
| Growth Rate | CAGR of > 11.00% from 2019-2033 |
| Segmentation |
|
Table of Contents
- 1. Introduction
- 1.1. Research Scope
- 1.2. Market Segmentation
- 1.3. Research Methodology
- 1.4. Definitions and Assumptions
- 2. Executive Summary
- 2.1. Introduction
- 3. Market Dynamics
- 3.1. Introduction
- 3.2. Market Drivers
- 3.2.1. 4.; Rising Deep-Water Offshore Development Activity4.; Improved Viability of Offshore Oil and Gas Projects
- 3.3. Market Restrains
- 3.3.1. 4.; Competition from Crew Transfer Ships
- 3.4. Market Trends
- 3.4.1. Floating Foundation Type to Witness Significant Growth
- 4. Market Factor Analysis
- 4.1. Porters Five Forces
- 4.2. Supply/Value Chain
- 4.3. PESTEL analysis
- 4.4. Market Entropy
- 4.5. Patent/Trademark Analysis
- 5. Global Offshore Wind Turbine Industry Analysis, Insights and Forecast, 2019-2031
- 5.1. Market Analysis, Insights and Forecast - by Foundation Type
- 5.1.1. Fixed Foundation
- 5.1.2. Floating Foundation
- 5.2. Market Analysis, Insights and Forecast - by Capacity
- 5.2.1. Less Than 5 MW
- 5.2.2. Greater Than or Equal to 5 MW
- 5.3. Market Analysis, Insights and Forecast - by Region
- 5.3.1. North America
- 5.3.2. Asia Pacific
- 5.3.3. Europe
- 5.3.4. South America
- 5.3.5. Middle East and Africa
- 5.1. Market Analysis, Insights and Forecast - by Foundation Type
- 6. North America Offshore Wind Turbine Industry Analysis, Insights and Forecast, 2019-2031
- 6.1. Market Analysis, Insights and Forecast - by Foundation Type
- 6.1.1. Fixed Foundation
- 6.1.2. Floating Foundation
- 6.2. Market Analysis, Insights and Forecast - by Capacity
- 6.2.1. Less Than 5 MW
- 6.2.2. Greater Than or Equal to 5 MW
- 6.1. Market Analysis, Insights and Forecast - by Foundation Type
- 7. Asia Pacific Offshore Wind Turbine Industry Analysis, Insights and Forecast, 2019-2031
- 7.1. Market Analysis, Insights and Forecast - by Foundation Type
- 7.1.1. Fixed Foundation
- 7.1.2. Floating Foundation
- 7.2. Market Analysis, Insights and Forecast - by Capacity
- 7.2.1. Less Than 5 MW
- 7.2.2. Greater Than or Equal to 5 MW
- 7.1. Market Analysis, Insights and Forecast - by Foundation Type
- 8. Europe Offshore Wind Turbine Industry Analysis, Insights and Forecast, 2019-2031
- 8.1. Market Analysis, Insights and Forecast - by Foundation Type
- 8.1.1. Fixed Foundation
- 8.1.2. Floating Foundation
- 8.2. Market Analysis, Insights and Forecast - by Capacity
- 8.2.1. Less Than 5 MW
- 8.2.2. Greater Than or Equal to 5 MW
- 8.1. Market Analysis, Insights and Forecast - by Foundation Type
- 9. South America Offshore Wind Turbine Industry Analysis, Insights and Forecast, 2019-2031
- 9.1. Market Analysis, Insights and Forecast - by Foundation Type
- 9.1.1. Fixed Foundation
- 9.1.2. Floating Foundation
- 9.2. Market Analysis, Insights and Forecast - by Capacity
- 9.2.1. Less Than 5 MW
- 9.2.2. Greater Than or Equal to 5 MW
- 9.1. Market Analysis, Insights and Forecast - by Foundation Type
- 10. Middle East and Africa Offshore Wind Turbine Industry Analysis, Insights and Forecast, 2019-2031
- 10.1. Market Analysis, Insights and Forecast - by Foundation Type
- 10.1.1. Fixed Foundation
- 10.1.2. Floating Foundation
- 10.2. Market Analysis, Insights and Forecast - by Capacity
- 10.2.1. Less Than 5 MW
- 10.2.2. Greater Than or Equal to 5 MW
- 10.1. Market Analysis, Insights and Forecast - by Foundation Type
- 11. North America Offshore Wind Turbine Industry Analysis, Insights and Forecast, 2019-2031
- 11.1. Market Analysis, Insights and Forecast - By Country/Sub-region
- 11.1.1 United States
- 11.1.2 Canada
- 12. Asia Pacific Offshore Wind Turbine Industry Analysis, Insights and Forecast, 2019-2031
- 12.1. Market Analysis, Insights and Forecast - By Country/Sub-region
- 12.1.1 China
- 12.1.2 India
- 12.1.3 Japan
- 12.1.4 South Korea
- 12.1.5 Rest of Asia Pacific
- 13. Europe Offshore Wind Turbine Industry Analysis, Insights and Forecast, 2019-2031
- 13.1. Market Analysis, Insights and Forecast - By Country/Sub-region
- 13.1.1 Germany
- 13.1.2 United Kingdom
- 13.1.3 Netherlands
- 13.1.4 Spain
- 13.1.5 Norway
- 13.1.6 Rest of Europe
- 14. South America Offshore Wind Turbine Industry Analysis, Insights and Forecast, 2019-2031
- 14.1. Market Analysis, Insights and Forecast - By Country/Sub-region
- 14.1.1 Brazil
- 14.1.2 Argentina
- 14.1.3 Rest of South America
- 15. Middle East and Africa Offshore Wind Turbine Industry Analysis, Insights and Forecast, 2019-2031
- 15.1. Market Analysis, Insights and Forecast - By Country/Sub-region
- 15.1.1 Saudi Arabia
- 15.1.2 United Arab Emirates
- 15.1.3 South Africa
- 15.1.4 Rest of Middle East and Africa
- 16. Competitive Analysis
- 16.1. Global Market Share Analysis 2024
- 16.2. Company Profiles
- 16.2.1 Vestas Wind Systems AS
- 16.2.1.1. Overview
- 16.2.1.2. Products
- 16.2.1.3. SWOT Analysis
- 16.2.1.4. Recent Developments
- 16.2.1.5. Financials (Based on Availability)
- 16.2.2 General Electric Company
- 16.2.2.1. Overview
- 16.2.2.2. Products
- 16.2.2.3. SWOT Analysis
- 16.2.2.4. Recent Developments
- 16.2.2.5. Financials (Based on Availability)
- 16.2.3 Xinjiang Goldwind Science Technology Co Ltd
- 16.2.3.1. Overview
- 16.2.3.2. Products
- 16.2.3.3. SWOT Analysis
- 16.2.3.4. Recent Developments
- 16.2.3.5. Financials (Based on Availability)
- 16.2.4 Equinor ASA
- 16.2.4.1. Overview
- 16.2.4.2. Products
- 16.2.4.3. SWOT Analysis
- 16.2.4.4. Recent Developments
- 16.2.4.5. Financials (Based on Availability)
- 16.2.5 Service Providers
- 16.2.5.1. Overview
- 16.2.5.2. Products
- 16.2.5.3. SWOT Analysis
- 16.2.5.4. Recent Developments
- 16.2.5.5. Financials (Based on Availability)
- 16.2.6 Nordex SE
- 16.2.6.1. Overview
- 16.2.6.2. Products
- 16.2.6.3. SWOT Analysis
- 16.2.6.4. Recent Developments
- 16.2.6.5. Financials (Based on Availability)
- 16.2.7 Operators
- 16.2.7.1. Overview
- 16.2.7.2. Products
- 16.2.7.3. SWOT Analysis
- 16.2.7.4. Recent Developments
- 16.2.7.5. Financials (Based on Availability)
- 16.2.8 E ON SE
- 16.2.8.1. Overview
- 16.2.8.2. Products
- 16.2.8.3. SWOT Analysis
- 16.2.8.4. Recent Developments
- 16.2.8.5. Financials (Based on Availability)
- 16.2.9 Northland Power Inc
- 16.2.9.1. Overview
- 16.2.9.2. Products
- 16.2.9.3. SWOT Analysis
- 16.2.9.4. Recent Developments
- 16.2.9.5. Financials (Based on Availability)
- 16.2.10 Suzlon Energy Limited
- 16.2.10.1. Overview
- 16.2.10.2. Products
- 16.2.10.3. SWOT Analysis
- 16.2.10.4. Recent Developments
- 16.2.10.5. Financials (Based on Availability)
- 16.2.11 Siemens Gamesa Renewable Energy SA
- 16.2.11.1. Overview
- 16.2.11.2. Products
- 16.2.11.3. SWOT Analysis
- 16.2.11.4. Recent Developments
- 16.2.11.5. Financials (Based on Availability)
- 16.2.12 Ørsted AS
- 16.2.12.1. Overview
- 16.2.12.2. Products
- 16.2.12.3. SWOT Analysis
- 16.2.12.4. Recent Developments
- 16.2.12.5. Financials (Based on Availability)
- 16.2.13 EDF SA
- 16.2.13.1. Overview
- 16.2.13.2. Products
- 16.2.13.3. SWOT Analysis
- 16.2.13.4. Recent Developments
- 16.2.13.5. Financials (Based on Availability)
- 16.2.1 Vestas Wind Systems AS
List of Figures
- Figure 1: Global Offshore Wind Turbine Industry Revenue Breakdown (Million, %) by Region 2024 & 2032
- Figure 2: Global Offshore Wind Turbine Industry Volume Breakdown (Gigawatt, %) by Region 2024 & 2032
- Figure 3: North America Offshore Wind Turbine Industry Revenue (Million), by Country 2024 & 2032
- Figure 4: North America Offshore Wind Turbine Industry Volume (Gigawatt), by Country 2024 & 2032
- Figure 5: North America Offshore Wind Turbine Industry Revenue Share (%), by Country 2024 & 2032
- Figure 6: North America Offshore Wind Turbine Industry Volume Share (%), by Country 2024 & 2032
- Figure 7: Asia Pacific Offshore Wind Turbine Industry Revenue (Million), by Country 2024 & 2032
- Figure 8: Asia Pacific Offshore Wind Turbine Industry Volume (Gigawatt), by Country 2024 & 2032
- Figure 9: Asia Pacific Offshore Wind Turbine Industry Revenue Share (%), by Country 2024 & 2032
- Figure 10: Asia Pacific Offshore Wind Turbine Industry Volume Share (%), by Country 2024 & 2032
- Figure 11: Europe Offshore Wind Turbine Industry Revenue (Million), by Country 2024 & 2032
- Figure 12: Europe Offshore Wind Turbine Industry Volume (Gigawatt), by Country 2024 & 2032
- Figure 13: Europe Offshore Wind Turbine Industry Revenue Share (%), by Country 2024 & 2032
- Figure 14: Europe Offshore Wind Turbine Industry Volume Share (%), by Country 2024 & 2032
- Figure 15: South America Offshore Wind Turbine Industry Revenue (Million), by Country 2024 & 2032
- Figure 16: South America Offshore Wind Turbine Industry Volume (Gigawatt), by Country 2024 & 2032
- Figure 17: South America Offshore Wind Turbine Industry Revenue Share (%), by Country 2024 & 2032
- Figure 18: South America Offshore Wind Turbine Industry Volume Share (%), by Country 2024 & 2032
- Figure 19: Middle East and Africa Offshore Wind Turbine Industry Revenue (Million), by Country 2024 & 2032
- Figure 20: Middle East and Africa Offshore Wind Turbine Industry Volume (Gigawatt), by Country 2024 & 2032
- Figure 21: Middle East and Africa Offshore Wind Turbine Industry Revenue Share (%), by Country 2024 & 2032
- Figure 22: Middle East and Africa Offshore Wind Turbine Industry Volume Share (%), by Country 2024 & 2032
- Figure 23: North America Offshore Wind Turbine Industry Revenue (Million), by Foundation Type 2024 & 2032
- Figure 24: North America Offshore Wind Turbine Industry Volume (Gigawatt), by Foundation Type 2024 & 2032
- Figure 25: North America Offshore Wind Turbine Industry Revenue Share (%), by Foundation Type 2024 & 2032
- Figure 26: North America Offshore Wind Turbine Industry Volume Share (%), by Foundation Type 2024 & 2032
- Figure 27: North America Offshore Wind Turbine Industry Revenue (Million), by Capacity 2024 & 2032
- Figure 28: North America Offshore Wind Turbine Industry Volume (Gigawatt), by Capacity 2024 & 2032
- Figure 29: North America Offshore Wind Turbine Industry Revenue Share (%), by Capacity 2024 & 2032
- Figure 30: North America Offshore Wind Turbine Industry Volume Share (%), by Capacity 2024 & 2032
- Figure 31: North America Offshore Wind Turbine Industry Revenue (Million), by Country 2024 & 2032
- Figure 32: North America Offshore Wind Turbine Industry Volume (Gigawatt), by Country 2024 & 2032
- Figure 33: North America Offshore Wind Turbine Industry Revenue Share (%), by Country 2024 & 2032
- Figure 34: North America Offshore Wind Turbine Industry Volume Share (%), by Country 2024 & 2032
- Figure 35: Asia Pacific Offshore Wind Turbine Industry Revenue (Million), by Foundation Type 2024 & 2032
- Figure 36: Asia Pacific Offshore Wind Turbine Industry Volume (Gigawatt), by Foundation Type 2024 & 2032
- Figure 37: Asia Pacific Offshore Wind Turbine Industry Revenue Share (%), by Foundation Type 2024 & 2032
- Figure 38: Asia Pacific Offshore Wind Turbine Industry Volume Share (%), by Foundation Type 2024 & 2032
- Figure 39: Asia Pacific Offshore Wind Turbine Industry Revenue (Million), by Capacity 2024 & 2032
- Figure 40: Asia Pacific Offshore Wind Turbine Industry Volume (Gigawatt), by Capacity 2024 & 2032
- Figure 41: Asia Pacific Offshore Wind Turbine Industry Revenue Share (%), by Capacity 2024 & 2032
- Figure 42: Asia Pacific Offshore Wind Turbine Industry Volume Share (%), by Capacity 2024 & 2032
- Figure 43: Asia Pacific Offshore Wind Turbine Industry Revenue (Million), by Country 2024 & 2032
- Figure 44: Asia Pacific Offshore Wind Turbine Industry Volume (Gigawatt), by Country 2024 & 2032
- Figure 45: Asia Pacific Offshore Wind Turbine Industry Revenue Share (%), by Country 2024 & 2032
- Figure 46: Asia Pacific Offshore Wind Turbine Industry Volume Share (%), by Country 2024 & 2032
- Figure 47: Europe Offshore Wind Turbine Industry Revenue (Million), by Foundation Type 2024 & 2032
- Figure 48: Europe Offshore Wind Turbine Industry Volume (Gigawatt), by Foundation Type 2024 & 2032
- Figure 49: Europe Offshore Wind Turbine Industry Revenue Share (%), by Foundation Type 2024 & 2032
- Figure 50: Europe Offshore Wind Turbine Industry Volume Share (%), by Foundation Type 2024 & 2032
- Figure 51: Europe Offshore Wind Turbine Industry Revenue (Million), by Capacity 2024 & 2032
- Figure 52: Europe Offshore Wind Turbine Industry Volume (Gigawatt), by Capacity 2024 & 2032
- Figure 53: Europe Offshore Wind Turbine Industry Revenue Share (%), by Capacity 2024 & 2032
- Figure 54: Europe Offshore Wind Turbine Industry Volume Share (%), by Capacity 2024 & 2032
- Figure 55: Europe Offshore Wind Turbine Industry Revenue (Million), by Country 2024 & 2032
- Figure 56: Europe Offshore Wind Turbine Industry Volume (Gigawatt), by Country 2024 & 2032
- Figure 57: Europe Offshore Wind Turbine Industry Revenue Share (%), by Country 2024 & 2032
- Figure 58: Europe Offshore Wind Turbine Industry Volume Share (%), by Country 2024 & 2032
- Figure 59: South America Offshore Wind Turbine Industry Revenue (Million), by Foundation Type 2024 & 2032
- Figure 60: South America Offshore Wind Turbine Industry Volume (Gigawatt), by Foundation Type 2024 & 2032
- Figure 61: South America Offshore Wind Turbine Industry Revenue Share (%), by Foundation Type 2024 & 2032
- Figure 62: South America Offshore Wind Turbine Industry Volume Share (%), by Foundation Type 2024 & 2032
- Figure 63: South America Offshore Wind Turbine Industry Revenue (Million), by Capacity 2024 & 2032
- Figure 64: South America Offshore Wind Turbine Industry Volume (Gigawatt), by Capacity 2024 & 2032
- Figure 65: South America Offshore Wind Turbine Industry Revenue Share (%), by Capacity 2024 & 2032
- Figure 66: South America Offshore Wind Turbine Industry Volume Share (%), by Capacity 2024 & 2032
- Figure 67: South America Offshore Wind Turbine Industry Revenue (Million), by Country 2024 & 2032
- Figure 68: South America Offshore Wind Turbine Industry Volume (Gigawatt), by Country 2024 & 2032
- Figure 69: South America Offshore Wind Turbine Industry Revenue Share (%), by Country 2024 & 2032
- Figure 70: South America Offshore Wind Turbine Industry Volume Share (%), by Country 2024 & 2032
- Figure 71: Middle East and Africa Offshore Wind Turbine Industry Revenue (Million), by Foundation Type 2024 & 2032
- Figure 72: Middle East and Africa Offshore Wind Turbine Industry Volume (Gigawatt), by Foundation Type 2024 & 2032
- Figure 73: Middle East and Africa Offshore Wind Turbine Industry Revenue Share (%), by Foundation Type 2024 & 2032
- Figure 74: Middle East and Africa Offshore Wind Turbine Industry Volume Share (%), by Foundation Type 2024 & 2032
- Figure 75: Middle East and Africa Offshore Wind Turbine Industry Revenue (Million), by Capacity 2024 & 2032
- Figure 76: Middle East and Africa Offshore Wind Turbine Industry Volume (Gigawatt), by Capacity 2024 & 2032
- Figure 77: Middle East and Africa Offshore Wind Turbine Industry Revenue Share (%), by Capacity 2024 & 2032
- Figure 78: Middle East and Africa Offshore Wind Turbine Industry Volume Share (%), by Capacity 2024 & 2032
- Figure 79: Middle East and Africa Offshore Wind Turbine Industry Revenue (Million), by Country 2024 & 2032
- Figure 80: Middle East and Africa Offshore Wind Turbine Industry Volume (Gigawatt), by Country 2024 & 2032
- Figure 81: Middle East and Africa Offshore Wind Turbine Industry Revenue Share (%), by Country 2024 & 2032
- Figure 82: Middle East and Africa Offshore Wind Turbine Industry Volume Share (%), by Country 2024 & 2032
List of Tables
- Table 1: Global Offshore Wind Turbine Industry Revenue Million Forecast, by Region 2019 & 2032
- Table 2: Global Offshore Wind Turbine Industry Volume Gigawatt Forecast, by Region 2019 & 2032
- Table 3: Global Offshore Wind Turbine Industry Revenue Million Forecast, by Foundation Type 2019 & 2032
- Table 4: Global Offshore Wind Turbine Industry Volume Gigawatt Forecast, by Foundation Type 2019 & 2032
- Table 5: Global Offshore Wind Turbine Industry Revenue Million Forecast, by Capacity 2019 & 2032
- Table 6: Global Offshore Wind Turbine Industry Volume Gigawatt Forecast, by Capacity 2019 & 2032
- Table 7: Global Offshore Wind Turbine Industry Revenue Million Forecast, by Region 2019 & 2032
- Table 8: Global Offshore Wind Turbine Industry Volume Gigawatt Forecast, by Region 2019 & 2032
- Table 9: Global Offshore Wind Turbine Industry Revenue Million Forecast, by Country 2019 & 2032
- Table 10: Global Offshore Wind Turbine Industry Volume Gigawatt Forecast, by Country 2019 & 2032
- Table 11: United States Offshore Wind Turbine Industry Revenue (Million) Forecast, by Application 2019 & 2032
- Table 12: United States Offshore Wind Turbine Industry Volume (Gigawatt) Forecast, by Application 2019 & 2032
- Table 13: Canada Offshore Wind Turbine Industry Revenue (Million) Forecast, by Application 2019 & 2032
- Table 14: Canada Offshore Wind Turbine Industry Volume (Gigawatt) Forecast, by Application 2019 & 2032
- Table 15: Global Offshore Wind Turbine Industry Revenue Million Forecast, by Country 2019 & 2032
- Table 16: Global Offshore Wind Turbine Industry Volume Gigawatt Forecast, by Country 2019 & 2032
- Table 17: China Offshore Wind Turbine Industry Revenue (Million) Forecast, by Application 2019 & 2032
- Table 18: China Offshore Wind Turbine Industry Volume (Gigawatt) Forecast, by Application 2019 & 2032
- Table 19: India Offshore Wind Turbine Industry Revenue (Million) Forecast, by Application 2019 & 2032
- Table 20: India Offshore Wind Turbine Industry Volume (Gigawatt) Forecast, by Application 2019 & 2032
- Table 21: Japan Offshore Wind Turbine Industry Revenue (Million) Forecast, by Application 2019 & 2032
- Table 22: Japan Offshore Wind Turbine Industry Volume (Gigawatt) Forecast, by Application 2019 & 2032
- Table 23: South Korea Offshore Wind Turbine Industry Revenue (Million) Forecast, by Application 2019 & 2032
- Table 24: South Korea Offshore Wind Turbine Industry Volume (Gigawatt) Forecast, by Application 2019 & 2032
- Table 25: Rest of Asia Pacific Offshore Wind Turbine Industry Revenue (Million) Forecast, by Application 2019 & 2032
- Table 26: Rest of Asia Pacific Offshore Wind Turbine Industry Volume (Gigawatt) Forecast, by Application 2019 & 2032
- Table 27: Global Offshore Wind Turbine Industry Revenue Million Forecast, by Country 2019 & 2032
- Table 28: Global Offshore Wind Turbine Industry Volume Gigawatt Forecast, by Country 2019 & 2032
- Table 29: Germany Offshore Wind Turbine Industry Revenue (Million) Forecast, by Application 2019 & 2032
- Table 30: Germany Offshore Wind Turbine Industry Volume (Gigawatt) Forecast, by Application 2019 & 2032
- Table 31: United Kingdom Offshore Wind Turbine Industry Revenue (Million) Forecast, by Application 2019 & 2032
- Table 32: United Kingdom Offshore Wind Turbine Industry Volume (Gigawatt) Forecast, by Application 2019 & 2032
- Table 33: Netherlands Offshore Wind Turbine Industry Revenue (Million) Forecast, by Application 2019 & 2032
- Table 34: Netherlands Offshore Wind Turbine Industry Volume (Gigawatt) Forecast, by Application 2019 & 2032
- Table 35: Spain Offshore Wind Turbine Industry Revenue (Million) Forecast, by Application 2019 & 2032
- Table 36: Spain Offshore Wind Turbine Industry Volume (Gigawatt) Forecast, by Application 2019 & 2032
- Table 37: Norway Offshore Wind Turbine Industry Revenue (Million) Forecast, by Application 2019 & 2032
- Table 38: Norway Offshore Wind Turbine Industry Volume (Gigawatt) Forecast, by Application 2019 & 2032
- Table 39: Rest of Europe Offshore Wind Turbine Industry Revenue (Million) Forecast, by Application 2019 & 2032
- Table 40: Rest of Europe Offshore Wind Turbine Industry Volume (Gigawatt) Forecast, by Application 2019 & 2032
- Table 41: Global Offshore Wind Turbine Industry Revenue Million Forecast, by Country 2019 & 2032
- Table 42: Global Offshore Wind Turbine Industry Volume Gigawatt Forecast, by Country 2019 & 2032
- Table 43: Brazil Offshore Wind Turbine Industry Revenue (Million) Forecast, by Application 2019 & 2032
- Table 44: Brazil Offshore Wind Turbine Industry Volume (Gigawatt) Forecast, by Application 2019 & 2032
- Table 45: Argentina Offshore Wind Turbine Industry Revenue (Million) Forecast, by Application 2019 & 2032
- Table 46: Argentina Offshore Wind Turbine Industry Volume (Gigawatt) Forecast, by Application 2019 & 2032
- Table 47: Rest of South America Offshore Wind Turbine Industry Revenue (Million) Forecast, by Application 2019 & 2032
- Table 48: Rest of South America Offshore Wind Turbine Industry Volume (Gigawatt) Forecast, by Application 2019 & 2032
- Table 49: Global Offshore Wind Turbine Industry Revenue Million Forecast, by Country 2019 & 2032
- Table 50: Global Offshore Wind Turbine Industry Volume Gigawatt Forecast, by Country 2019 & 2032
- Table 51: Saudi Arabia Offshore Wind Turbine Industry Revenue (Million) Forecast, by Application 2019 & 2032
- Table 52: Saudi Arabia Offshore Wind Turbine Industry Volume (Gigawatt) Forecast, by Application 2019 & 2032
- Table 53: United Arab Emirates Offshore Wind Turbine Industry Revenue (Million) Forecast, by Application 2019 & 2032
- Table 54: United Arab Emirates Offshore Wind Turbine Industry Volume (Gigawatt) Forecast, by Application 2019 & 2032
- Table 55: South Africa Offshore Wind Turbine Industry Revenue (Million) Forecast, by Application 2019 & 2032
- Table 56: South Africa Offshore Wind Turbine Industry Volume (Gigawatt) Forecast, by Application 2019 & 2032
- Table 57: Rest of Middle East and Africa Offshore Wind Turbine Industry Revenue (Million) Forecast, by Application 2019 & 2032
- Table 58: Rest of Middle East and Africa Offshore Wind Turbine Industry Volume (Gigawatt) Forecast, by Application 2019 & 2032
- Table 59: Global Offshore Wind Turbine Industry Revenue Million Forecast, by Foundation Type 2019 & 2032
- Table 60: Global Offshore Wind Turbine Industry Volume Gigawatt Forecast, by Foundation Type 2019 & 2032
- Table 61: Global Offshore Wind Turbine Industry Revenue Million Forecast, by Capacity 2019 & 2032
- Table 62: Global Offshore Wind Turbine Industry Volume Gigawatt Forecast, by Capacity 2019 & 2032
- Table 63: Global Offshore Wind Turbine Industry Revenue Million Forecast, by Country 2019 & 2032
- Table 64: Global Offshore Wind Turbine Industry Volume Gigawatt Forecast, by Country 2019 & 2032
- Table 65: United States Offshore Wind Turbine Industry Revenue (Million) Forecast, by Application 2019 & 2032
- Table 66: United States Offshore Wind Turbine Industry Volume (Gigawatt) Forecast, by Application 2019 & 2032
- Table 67: Canada Offshore Wind Turbine Industry Revenue (Million) Forecast, by Application 2019 & 2032
- Table 68: Canada Offshore Wind Turbine Industry Volume (Gigawatt) Forecast, by Application 2019 & 2032
- Table 69: Global Offshore Wind Turbine Industry Revenue Million Forecast, by Foundation Type 2019 & 2032
- Table 70: Global Offshore Wind Turbine Industry Volume Gigawatt Forecast, by Foundation Type 2019 & 2032
- Table 71: Global Offshore Wind Turbine Industry Revenue Million Forecast, by Capacity 2019 & 2032
- Table 72: Global Offshore Wind Turbine Industry Volume Gigawatt Forecast, by Capacity 2019 & 2032
- Table 73: Global Offshore Wind Turbine Industry Revenue Million Forecast, by Country 2019 & 2032
- Table 74: Global Offshore Wind Turbine Industry Volume Gigawatt Forecast, by Country 2019 & 2032
- Table 75: China Offshore Wind Turbine Industry Revenue (Million) Forecast, by Application 2019 & 2032
- Table 76: China Offshore Wind Turbine Industry Volume (Gigawatt) Forecast, by Application 2019 & 2032
- Table 77: India Offshore Wind Turbine Industry Revenue (Million) Forecast, by Application 2019 & 2032
- Table 78: India Offshore Wind Turbine Industry Volume (Gigawatt) Forecast, by Application 2019 & 2032
- Table 79: Japan Offshore Wind Turbine Industry Revenue (Million) Forecast, by Application 2019 & 2032
- Table 80: Japan Offshore Wind Turbine Industry Volume (Gigawatt) Forecast, by Application 2019 & 2032
- Table 81: South Korea Offshore Wind Turbine Industry Revenue (Million) Forecast, by Application 2019 & 2032
- Table 82: South Korea Offshore Wind Turbine Industry Volume (Gigawatt) Forecast, by Application 2019 & 2032
- Table 83: Rest of Asia Pacific Offshore Wind Turbine Industry Revenue (Million) Forecast, by Application 2019 & 2032
- Table 84: Rest of Asia Pacific Offshore Wind Turbine Industry Volume (Gigawatt) Forecast, by Application 2019 & 2032
- Table 85: Global Offshore Wind Turbine Industry Revenue Million Forecast, by Foundation Type 2019 & 2032
- Table 86: Global Offshore Wind Turbine Industry Volume Gigawatt Forecast, by Foundation Type 2019 & 2032
- Table 87: Global Offshore Wind Turbine Industry Revenue Million Forecast, by Capacity 2019 & 2032
- Table 88: Global Offshore Wind Turbine Industry Volume Gigawatt Forecast, by Capacity 2019 & 2032
- Table 89: Global Offshore Wind Turbine Industry Revenue Million Forecast, by Country 2019 & 2032
- Table 90: Global Offshore Wind Turbine Industry Volume Gigawatt Forecast, by Country 2019 & 2032
- Table 91: Germany Offshore Wind Turbine Industry Revenue (Million) Forecast, by Application 2019 & 2032
- Table 92: Germany Offshore Wind Turbine Industry Volume (Gigawatt) Forecast, by Application 2019 & 2032
- Table 93: United Kingdom Offshore Wind Turbine Industry Revenue (Million) Forecast, by Application 2019 & 2032
- Table 94: United Kingdom Offshore Wind Turbine Industry Volume (Gigawatt) Forecast, by Application 2019 & 2032
- Table 95: Netherlands Offshore Wind Turbine Industry Revenue (Million) Forecast, by Application 2019 & 2032
- Table 96: Netherlands Offshore Wind Turbine Industry Volume (Gigawatt) Forecast, by Application 2019 & 2032
- Table 97: Spain Offshore Wind Turbine Industry Revenue (Million) Forecast, by Application 2019 & 2032
- Table 98: Spain Offshore Wind Turbine Industry Volume (Gigawatt) Forecast, by Application 2019 & 2032
- Table 99: Norway Offshore Wind Turbine Industry Revenue (Million) Forecast, by Application 2019 & 2032
- Table 100: Norway Offshore Wind Turbine Industry Volume (Gigawatt) Forecast, by Application 2019 & 2032
- Table 101: Rest of Europe Offshore Wind Turbine Industry Revenue (Million) Forecast, by Application 2019 & 2032
- Table 102: Rest of Europe Offshore Wind Turbine Industry Volume (Gigawatt) Forecast, by Application 2019 & 2032
- Table 103: Global Offshore Wind Turbine Industry Revenue Million Forecast, by Foundation Type 2019 & 2032
- Table 104: Global Offshore Wind Turbine Industry Volume Gigawatt Forecast, by Foundation Type 2019 & 2032
- Table 105: Global Offshore Wind Turbine Industry Revenue Million Forecast, by Capacity 2019 & 2032
- Table 106: Global Offshore Wind Turbine Industry Volume Gigawatt Forecast, by Capacity 2019 & 2032
- Table 107: Global Offshore Wind Turbine Industry Revenue Million Forecast, by Country 2019 & 2032
- Table 108: Global Offshore Wind Turbine Industry Volume Gigawatt Forecast, by Country 2019 & 2032
- Table 109: Brazil Offshore Wind Turbine Industry Revenue (Million) Forecast, by Application 2019 & 2032
- Table 110: Brazil Offshore Wind Turbine Industry Volume (Gigawatt) Forecast, by Application 2019 & 2032
- Table 111: Argentina Offshore Wind Turbine Industry Revenue (Million) Forecast, by Application 2019 & 2032
- Table 112: Argentina Offshore Wind Turbine Industry Volume (Gigawatt) Forecast, by Application 2019 & 2032
- Table 113: Rest of South America Offshore Wind Turbine Industry Revenue (Million) Forecast, by Application 2019 & 2032
- Table 114: Rest of South America Offshore Wind Turbine Industry Volume (Gigawatt) Forecast, by Application 2019 & 2032
- Table 115: Global Offshore Wind Turbine Industry Revenue Million Forecast, by Foundation Type 2019 & 2032
- Table 116: Global Offshore Wind Turbine Industry Volume Gigawatt Forecast, by Foundation Type 2019 & 2032
- Table 117: Global Offshore Wind Turbine Industry Revenue Million Forecast, by Capacity 2019 & 2032
- Table 118: Global Offshore Wind Turbine Industry Volume Gigawatt Forecast, by Capacity 2019 & 2032
- Table 119: Global Offshore Wind Turbine Industry Revenue Million Forecast, by Country 2019 & 2032
- Table 120: Global Offshore Wind Turbine Industry Volume Gigawatt Forecast, by Country 2019 & 2032
- Table 121: Saudi Arabia Offshore Wind Turbine Industry Revenue (Million) Forecast, by Application 2019 & 2032
- Table 122: Saudi Arabia Offshore Wind Turbine Industry Volume (Gigawatt) Forecast, by Application 2019 & 2032
- Table 123: United Arab Emirates Offshore Wind Turbine Industry Revenue (Million) Forecast, by Application 2019 & 2032
- Table 124: United Arab Emirates Offshore Wind Turbine Industry Volume (Gigawatt) Forecast, by Application 2019 & 2032
- Table 125: South Africa Offshore Wind Turbine Industry Revenue (Million) Forecast, by Application 2019 & 2032
- Table 126: South Africa Offshore Wind Turbine Industry Volume (Gigawatt) Forecast, by Application 2019 & 2032
- Table 127: Rest of Middle East and Africa Offshore Wind Turbine Industry Revenue (Million) Forecast, by Application 2019 & 2032
- Table 128: Rest of Middle East and Africa Offshore Wind Turbine Industry Volume (Gigawatt) Forecast, by Application 2019 & 2032
Frequently Asked Questions
1. What is the projected Compound Annual Growth Rate (CAGR) of the Offshore Wind Turbine Industry?
The projected CAGR is approximately > 11.00%.
2. Which companies are prominent players in the Offshore Wind Turbine Industry?
Key companies in the market include Vestas Wind Systems AS, General Electric Company, Xinjiang Goldwind Science Technology Co Ltd, Equinor ASA, Service Providers, Nordex SE, Operators, E ON SE, Northland Power Inc, Suzlon Energy Limited, Siemens Gamesa Renewable Energy SA, Ørsted AS, EDF SA.
3. What are the main segments of the Offshore Wind Turbine Industry?
The market segments include Foundation Type, Capacity.
4. Can you provide details about the market size?
The market size is estimated to be USD XX Million as of 2022.
5. What are some drivers contributing to market growth?
4.; Rising Deep-Water Offshore Development Activity4.; Improved Viability of Offshore Oil and Gas Projects.
6. What are the notable trends driving market growth?
Floating Foundation Type to Witness Significant Growth.
7. Are there any restraints impacting market growth?
4.; Competition from Crew Transfer Ships.
8. Can you provide examples of recent developments in the market?
In August 2022, an agreement was signed between Ping Petroleum and Cerulean Winds to work on a wind power solution for the floating production, storage, and offloading vessel (FPSO) reserved for the Avalon oil project in the UK North Sea. A large floating offshore wind turbine is likely to be connected, via a cable, to the cylindrical Sevan Hummingbird FPSO, which Ping acquired (in July 2022) from TeekayCorporation. The two companies aim to form a joint venture company with the necessary seabed lease rights to develop, deploy and operate the floating wind unit.
9. What pricing options are available for accessing the report?
Pricing options include single-user, multi-user, and enterprise licenses priced at USD 4750, USD 5250, and USD 8750 respectively.
10. Is the market size provided in terms of value or volume?
The market size is provided in terms of value, measured in Million and volume, measured in Gigawatt.
11. Are there any specific market keywords associated with the report?
Yes, the market keyword associated with the report is "Offshore Wind Turbine Industry," which aids in identifying and referencing the specific market segment covered.
12. How do I determine which pricing option suits my needs best?
The pricing options vary based on user requirements and access needs. Individual users may opt for single-user licenses, while businesses requiring broader access may choose multi-user or enterprise licenses for cost-effective access to the report.
13. Are there any additional resources or data provided in the Offshore Wind Turbine Industry report?
While the report offers comprehensive insights, it's advisable to review the specific contents or supplementary materials provided to ascertain if additional resources or data are available.
14. How can I stay updated on further developments or reports in the Offshore Wind Turbine Industry?
To stay informed about further developments, trends, and reports in the Offshore Wind Turbine Industry, consider subscribing to industry newsletters, following relevant companies and organizations, or regularly checking reputable industry news sources and publications.
Methodology
Step 1 - Identification of Relevant Samples Size from Population Database


Step 2 - Approaches for Defining Global Market Size (Value, Volume* & Price*)

Note*: In applicable scenarios
Step 3 - Data Sources
Primary Research
- Web Analytics
- Survey Reports
- Research Institute
- Latest Research Reports
- Opinion Leaders
Secondary Research
- Annual Reports
- White Paper
- Latest Press Release
- Industry Association
- Paid Database
- Investor Presentations

Step 4 - Data Triangulation
Involves using different sources of information in order to increase the validity of a study
These sources are likely to be stakeholders in a program - participants, other researchers, program staff, other community members, and so on.
Then we put all data in single framework & apply various statistical tools to find out the dynamic on the market.
During the analysis stage, feedback from the stakeholder groups would be compared to determine areas of agreement as well as areas of divergence


