
Key Insights
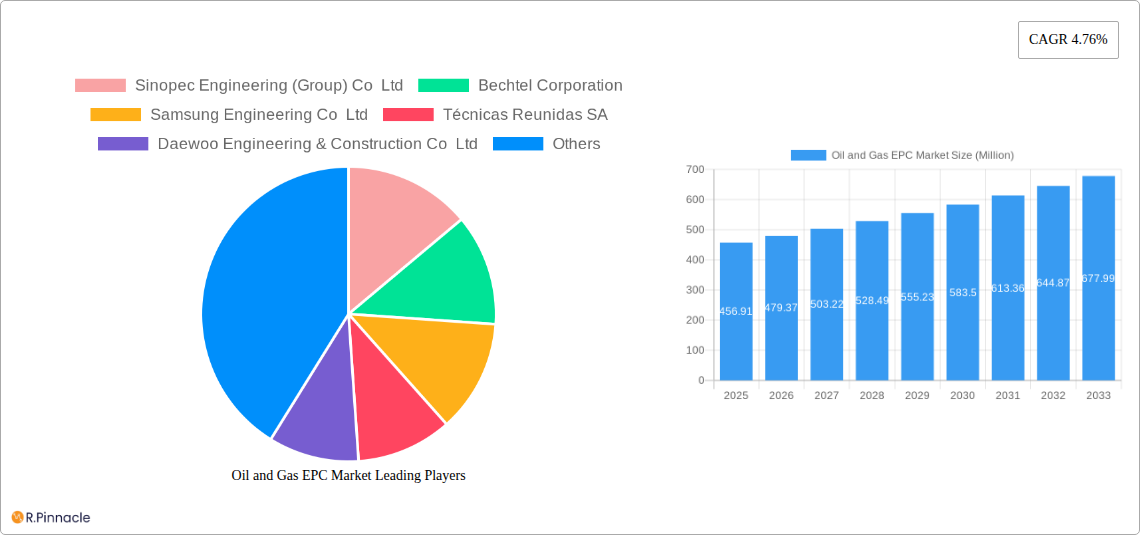
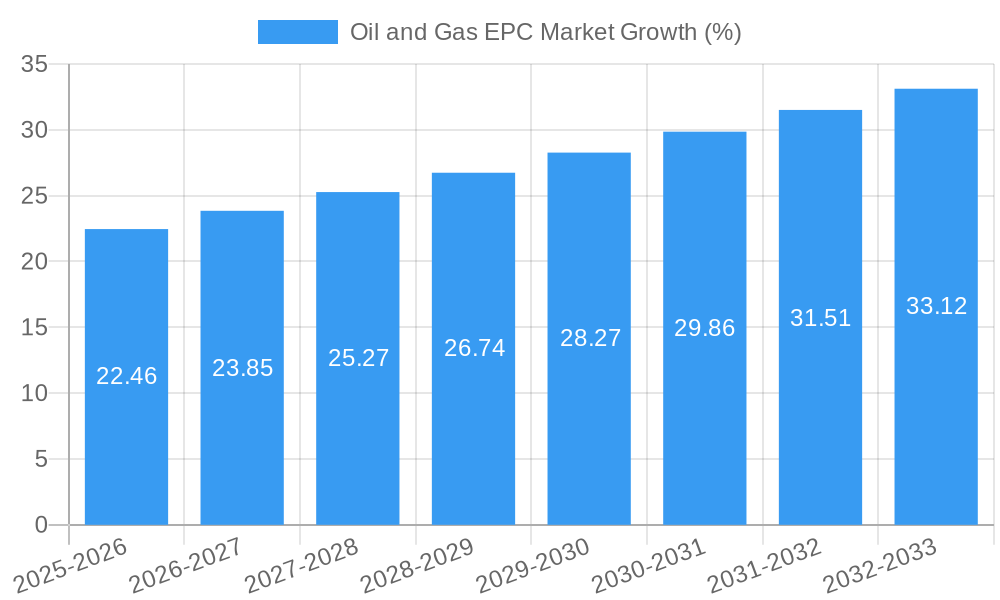
The Oil and Gas Engineering, Procurement, and Construction (EPC) market, currently valued at $456.91 million in 2025, is projected to experience robust growth, driven by increasing global energy demand and significant investments in upstream and downstream oil and gas infrastructure projects. The market's Compound Annual Growth Rate (CAGR) of 4.76% from 2025 to 2033 indicates a steady expansion, fueled by ongoing exploration and production activities, particularly in regions like the Middle East and Asia Pacific. Major drivers include the need to modernize aging infrastructure, the transition to cleaner energy sources (requiring new infrastructure), and the ongoing exploration and development of new oil and gas reserves. Growth will likely be uneven across sectors; upstream projects (exploration and production) may see more volatility dependent on global oil prices, while downstream (refineries and processing) and midstream (pipelines and storage) are expected to show more consistent, albeit slower, growth due to less price volatility and their role in established energy supply chains. Competitive dynamics are shaped by a mix of multinational giants like Bechtel and Fluor, along with regional players such as Sinopec Engineering and National Petroleum Construction Company, creating a complex landscape characterized by both strategic partnerships and intense competition for lucrative contracts. The market faces constraints such as fluctuating oil prices, geopolitical instability in key oil-producing regions, and increasing environmental regulations impacting project approvals and costs. These factors will influence the market's trajectory, requiring EPC companies to adapt strategically to maintain competitiveness.
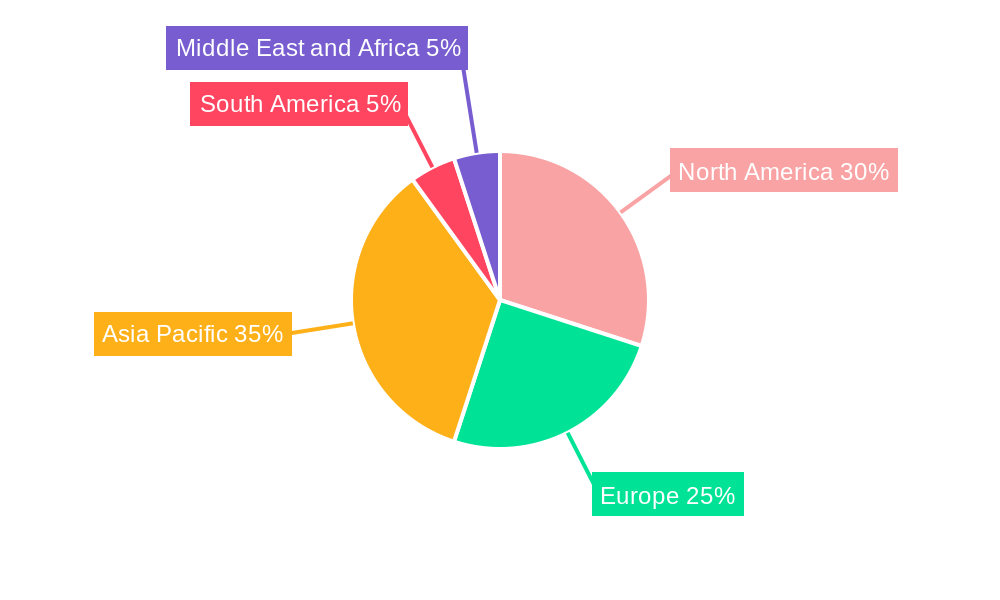
The regional breakdown reveals significant opportunities across diverse geographical areas. North America, propelled by shale gas production and ongoing infrastructure upgrades, is expected to maintain a considerable market share. The Asia Pacific region, particularly China and India, will witness substantial growth due to their rapidly expanding economies and rising energy consumption. Europe, while relatively mature, will still contribute significant value, focusing on renewable energy integration and efficiency improvements. The Middle East and Africa, while resource-rich, will see growth impacted by geopolitical factors and the transition towards sustainable energy. South America will exhibit moderate growth, driven by both domestic demand and potential international partnerships. Companies will need to navigate the regulatory landscape and project financing challenges specific to each region to capitalize on these growth prospects, emphasizing localized expertise and strategic partnerships to mitigate risks and succeed in this dynamic market.
This comprehensive report provides a detailed analysis of the Oil and Gas EPC market, offering actionable insights for industry professionals. Covering the period 2019-2033, with a focus on 2025, this report examines market dynamics, key players, and future growth potential. The study encompasses upstream, midstream, and downstream sectors, offering a holistic view of this dynamic market.
Oil and Gas EPC Market Structure & Innovation Trends
The Oil and Gas EPC market is characterized by a moderately concentrated structure with several multinational corporations dominating the landscape. Key players such as Sinopec Engineering (Group) Co Ltd, Bechtel Corporation, Samsung Engineering Co Ltd, Técnicas Reunidas SA, Daewoo Engineering & Construction Co Ltd, National Petroleum Construction Company, KBR Inc, Petrofac Limited, Hyundai Engineering & Construction Co Ltd, Saipem SpA, Korea Shipbuilding & Offshore Engineering Co Ltd, Fluor Corporation, John Wood Group PLC, TechnipFMC PLC, and McDermott International Ltd hold significant market share, with estimates placing the top 5 companies at approximately xx% combined in 2025.
Innovation is driven by increasing demand for efficient and sustainable solutions, stricter environmental regulations, and advancements in digital technologies. M&A activity plays a crucial role in shaping the market structure, with deal values exceeding USD xx Billion in the last five years, largely focused on expanding geographical reach and technological capabilities.
- Market Concentration: High, with a few large players dominating.
- Innovation Drivers: Sustainability, digitalization, regulatory pressures.
- Regulatory Frameworks: Vary significantly by region, impacting project timelines and costs.
- Product Substitutes: Limited, given the specialized nature of EPC services.
- End-User Demographics: Primarily large oil and gas companies and national oil companies.
- M&A Activity: Significant, driving consolidation and expansion.
Oil and Gas EPC Market Dynamics & Trends
The Oil and Gas EPC market is projected to experience a Compound Annual Growth Rate (CAGR) of xx% during the forecast period (2025-2033), driven by factors such as rising global energy demand, increasing investments in upstream projects, and ongoing LNG expansion projects globally. Technological disruptions, such as the adoption of digital twins and advanced analytics, are enhancing project efficiency and reducing costs. Consumer preferences are shifting towards cleaner energy sources, although oil and gas remain central to global energy needs. Market penetration of digital technologies is expected to reach xx% by 2033, impacting project execution and risk management strategies significantly. Competitive dynamics are intense, with companies focusing on differentiation through technological expertise and project management capabilities.
Dominant Regions & Segments in Oil and Gas EPC Market
The Middle East and Asia-Pacific regions are currently the dominant markets for Oil and Gas EPC services.
Middle East Dominance:
- Key Drivers: Massive investments in LNG projects (e.g., QatarEnergy's North Field expansion), significant oil and gas reserves, and supportive government policies.
- Dominance Analysis: The region's abundant resources, coupled with large-scale infrastructure projects, attract significant EPC investments, creating a highly competitive but lucrative market.
Asia-Pacific Growth:
- Key Drivers: Rapid economic growth, increasing energy demand, and significant investments in petrochemical and refining projects.
- Dominance Analysis: The region’s robust economic expansion and large-scale infrastructure development provide significant growth opportunities for Oil and Gas EPC players.
Segment Analysis:
The Upstream sector currently dominates, driven by exploration and production activities. However, the Downstream sector shows high potential due to refinery expansions and petrochemical growth. Midstream presents moderate growth, mostly attributed to pipeline and storage infrastructure projects.
Oil and Gas EPC Market Product Innovations
Recent innovations in Oil and Gas EPC include the deployment of advanced digital technologies such as Building Information Modeling (BIM), Artificial Intelligence (AI) for predictive maintenance, and the use of drones and robotics for inspection and construction. These innovations improve project efficiency, reduce costs, and enhance safety, offering a compelling competitive advantage in the market.
Report Scope & Segmentation Analysis
This report segments the Oil and Gas EPC market by sector: Upstream, Midstream, and Downstream.
Upstream: This segment focuses on exploration, drilling, and production activities. The market size is estimated at USD xx Million in 2025, with a projected CAGR of xx% during the forecast period. Competition is fierce, with major players vying for large-scale projects.
Midstream: This segment involves the transportation and storage of oil and gas. The market size is estimated at USD xx Million in 2025, with a projected CAGR of xx% during the forecast period. Growth is driven by the need for efficient and reliable pipeline networks.
Downstream: This segment encompasses refining, petrochemicals, and marketing activities. The market size is estimated at USD xx Million in 2025, with a projected CAGR of xx% during the forecast period. Growth is fuelled by rising demand for refined products and petrochemicals.
Key Drivers of Oil and Gas EPC Market Growth
Several factors drive growth in the Oil and Gas EPC market:
- Rising Global Energy Demand: Continued growth in global energy consumption fuels demand for oil and gas infrastructure.
- LNG Expansion Projects: Major LNG projects worldwide require significant EPC investments.
- Technological Advancements: Digitalization and automation improve efficiency and reduce project costs.
- Government Regulations: Regulations promoting energy security and infrastructure development stimulate market growth.
Challenges in the Oil and Gas EPC Market Sector
The Oil and Gas EPC market faces challenges including:
- Fluctuating Oil and Gas Prices: Price volatility creates uncertainty and impacts investment decisions.
- Geopolitical Instability: Political risks in certain regions can disrupt projects and investments.
- Supply Chain Disruptions: Global supply chain issues can lead to project delays and cost overruns.
- Environmental Concerns: Growing environmental awareness leads to stricter regulations and increased scrutiny of EPC projects.
Emerging Opportunities in Oil and Gas EPC Market
Emerging opportunities include:
- Renewable Energy Integration: EPC companies are expanding into renewable energy projects, offering integrated solutions.
- Carbon Capture and Storage: Growing interest in CCS technologies opens new market segments for EPC services.
- Digitalization and Automation: Adoption of advanced technologies offers significant efficiency gains and cost savings.
- New Market Entry: Expansion into emerging markets with growing energy demand presents significant opportunities.
Leading Players in the Oil and Gas EPC Market Market
- Sinopec Engineering (Group) Co Ltd
- Bechtel Corporation
- Samsung Engineering Co Ltd
- Técnicas Reunidas SA
- Daewoo Engineering & Construction Co Ltd
- National Petroleum Construction Company
- KBR Inc
- Petrofac Limited
- Hyundai Engineering & Construction Co Ltd
- Saipem SpA
- Korea Shipbuilding & Offshore Engineering Co Ltd
- Fluor Corporation
- John Wood Group PLC
- TechnipFMC PLC
- McDermott International Ltd
Key Developments in Oil and Gas EPC Market Industry
- May 2023: QatarEnergy awards EPC contract for the North Field South project, a significant development expanding Qatar's LNG production capacity. This signals a continued massive investment in the LNG sector.
- July 2022: Saipem SpA secures USD 1.25 Billion in onshore and offshore contracts in the Middle East, highlighting the ongoing robust demand for EPC services in the region.
Future Outlook for Oil and Gas EPC Market Market
The future of the Oil and Gas EPC market looks promising, with continued growth driven by global energy demand and significant investments in new infrastructure. Strategic opportunities exist for companies that can leverage digital technologies, embrace sustainable practices, and adapt to evolving regulatory landscapes. The market is expected to witness further consolidation through M&A activity, with larger companies acquiring smaller firms to expand their geographic reach and technological capabilities.
Oil and Gas EPC Market Segmentation
-
1. Sector
- 1.1. Upstream
- 1.2. Downstream
- 1.3. Midstream
Oil and Gas EPC Market Segmentation By Geography
-
1. North America
- 1.1. United States
- 1.2. Canada
- 1.3. Rest of North America
-
2. Europe
- 2.1. Germany
- 2.2. France
- 2.3. United Kingdom
- 2.4. Rest of Europe
-
3. Asia Pacific
- 3.1. China
- 3.2. India
- 3.3. Japan
- 3.4. South Korea
- 3.5. Rest of Asia Pacific
-
4. South America
- 4.1. Brazil
- 4.2. Argentina
- 4.3. Rest of South America
-
5. Middle East and Africa
- 5.1. Saudi Arabia
- 5.2. United Arab Emirates
- 5.3. South Africa
- 5.4. Rest of Middle East and Africa
Oil and Gas EPC Market REPORT HIGHLIGHTS
| Aspects | Details |
|---|---|
| Study Period | 2019-2033 |
| Base Year | 2024 |
| Estimated Year | 2025 |
| Forecast Period | 2025-2033 |
| Historical Period | 2019-2024 |
| Growth Rate | CAGR of 4.76% from 2019-2033 |
| Segmentation |
|
Table of Contents
- 1. Introduction
- 1.1. Research Scope
- 1.2. Market Segmentation
- 1.3. Research Methodology
- 1.4. Definitions and Assumptions
- 2. Executive Summary
- 2.1. Introduction
- 3. Market Dynamics
- 3.1. Introduction
- 3.2. Market Drivers
- 3.2.1. 4.; Growing Demand to Develop the Natural Gas Infrastructure4.; Increase in Offshore Oil and Gas Exploration and Production (E&P) Activities
- 3.3. Market Restrains
- 3.3.1. 4.; High Volatility of Oil and Gas Prices
- 3.4. Market Trends
- 3.4.1. Upstream Segment Expected to Dominate the Market
- 4. Market Factor Analysis
- 4.1. Porters Five Forces
- 4.2. Supply/Value Chain
- 4.3. PESTEL analysis
- 4.4. Market Entropy
- 4.5. Patent/Trademark Analysis
- 5. Global Oil and Gas EPC Market Analysis, Insights and Forecast, 2019-2031
- 5.1. Market Analysis, Insights and Forecast - by Sector
- 5.1.1. Upstream
- 5.1.2. Downstream
- 5.1.3. Midstream
- 5.2. Market Analysis, Insights and Forecast - by Region
- 5.2.1. North America
- 5.2.2. Europe
- 5.2.3. Asia Pacific
- 5.2.4. South America
- 5.2.5. Middle East and Africa
- 5.1. Market Analysis, Insights and Forecast - by Sector
- 6. North America Oil and Gas EPC Market Analysis, Insights and Forecast, 2019-2031
- 6.1. Market Analysis, Insights and Forecast - by Sector
- 6.1.1. Upstream
- 6.1.2. Downstream
- 6.1.3. Midstream
- 6.1. Market Analysis, Insights and Forecast - by Sector
- 7. Europe Oil and Gas EPC Market Analysis, Insights and Forecast, 2019-2031
- 7.1. Market Analysis, Insights and Forecast - by Sector
- 7.1.1. Upstream
- 7.1.2. Downstream
- 7.1.3. Midstream
- 7.1. Market Analysis, Insights and Forecast - by Sector
- 8. Asia Pacific Oil and Gas EPC Market Analysis, Insights and Forecast, 2019-2031
- 8.1. Market Analysis, Insights and Forecast - by Sector
- 8.1.1. Upstream
- 8.1.2. Downstream
- 8.1.3. Midstream
- 8.1. Market Analysis, Insights and Forecast - by Sector
- 9. South America Oil and Gas EPC Market Analysis, Insights and Forecast, 2019-2031
- 9.1. Market Analysis, Insights and Forecast - by Sector
- 9.1.1. Upstream
- 9.1.2. Downstream
- 9.1.3. Midstream
- 9.1. Market Analysis, Insights and Forecast - by Sector
- 10. Middle East and Africa Oil and Gas EPC Market Analysis, Insights and Forecast, 2019-2031
- 10.1. Market Analysis, Insights and Forecast - by Sector
- 10.1.1. Upstream
- 10.1.2. Downstream
- 10.1.3. Midstream
- 10.1. Market Analysis, Insights and Forecast - by Sector
- 11. North America Oil and Gas EPC Market Analysis, Insights and Forecast, 2019-2031
- 11.1. Market Analysis, Insights and Forecast - By Country/Sub-region
- 11.1.1 United States
- 11.1.2 Canada
- 11.1.3 Rest of North America
- 12. Europe Oil and Gas EPC Market Analysis, Insights and Forecast, 2019-2031
- 12.1. Market Analysis, Insights and Forecast - By Country/Sub-region
- 12.1.1 Germany
- 12.1.2 France
- 12.1.3 United Kingdom
- 12.1.4 Rest of Europe
- 13. Asia Pacific Oil and Gas EPC Market Analysis, Insights and Forecast, 2019-2031
- 13.1. Market Analysis, Insights and Forecast - By Country/Sub-region
- 13.1.1 China
- 13.1.2 India
- 13.1.3 Japan
- 13.1.4 South Korea
- 13.1.5 Rest of Asia Pacific
- 14. South America Oil and Gas EPC Market Analysis, Insights and Forecast, 2019-2031
- 14.1. Market Analysis, Insights and Forecast - By Country/Sub-region
- 14.1.1 Brazil
- 14.1.2 Argentina
- 14.1.3 Rest of South America
- 15. Middle East and Africa Oil and Gas EPC Market Analysis, Insights and Forecast, 2019-2031
- 15.1. Market Analysis, Insights and Forecast - By Country/Sub-region
- 15.1.1 Saudi Arabia
- 15.1.2 United Arab Emirates
- 15.1.3 South Africa
- 15.1.4 Rest of Middle East and Africa
- 16. Competitive Analysis
- 16.1. Global Market Share Analysis 2024
- 16.2. Company Profiles
- 16.2.1 Sinopec Engineering (Group) Co Ltd
- 16.2.1.1. Overview
- 16.2.1.2. Products
- 16.2.1.3. SWOT Analysis
- 16.2.1.4. Recent Developments
- 16.2.1.5. Financials (Based on Availability)
- 16.2.2 Bechtel Corporation
- 16.2.2.1. Overview
- 16.2.2.2. Products
- 16.2.2.3. SWOT Analysis
- 16.2.2.4. Recent Developments
- 16.2.2.5. Financials (Based on Availability)
- 16.2.3 Samsung Engineering Co Ltd
- 16.2.3.1. Overview
- 16.2.3.2. Products
- 16.2.3.3. SWOT Analysis
- 16.2.3.4. Recent Developments
- 16.2.3.5. Financials (Based on Availability)
- 16.2.4 Técnicas Reunidas SA
- 16.2.4.1. Overview
- 16.2.4.2. Products
- 16.2.4.3. SWOT Analysis
- 16.2.4.4. Recent Developments
- 16.2.4.5. Financials (Based on Availability)
- 16.2.5 Daewoo Engineering & Construction Co Ltd
- 16.2.5.1. Overview
- 16.2.5.2. Products
- 16.2.5.3. SWOT Analysis
- 16.2.5.4. Recent Developments
- 16.2.5.5. Financials (Based on Availability)
- 16.2.6 National Petroleum Construction Company
- 16.2.6.1. Overview
- 16.2.6.2. Products
- 16.2.6.3. SWOT Analysis
- 16.2.6.4. Recent Developments
- 16.2.6.5. Financials (Based on Availability)
- 16.2.7 KBR Inc
- 16.2.7.1. Overview
- 16.2.7.2. Products
- 16.2.7.3. SWOT Analysis
- 16.2.7.4. Recent Developments
- 16.2.7.5. Financials (Based on Availability)
- 16.2.8 Petrofac Limited
- 16.2.8.1. Overview
- 16.2.8.2. Products
- 16.2.8.3. SWOT Analysis
- 16.2.8.4. Recent Developments
- 16.2.8.5. Financials (Based on Availability)
- 16.2.9 Hyundai Engineering & Construction Co Ltd
- 16.2.9.1. Overview
- 16.2.9.2. Products
- 16.2.9.3. SWOT Analysis
- 16.2.9.4. Recent Developments
- 16.2.9.5. Financials (Based on Availability)
- 16.2.10 Saipem SpA
- 16.2.10.1. Overview
- 16.2.10.2. Products
- 16.2.10.3. SWOT Analysis
- 16.2.10.4. Recent Developments
- 16.2.10.5. Financials (Based on Availability)
- 16.2.11 Korea Shipbuilding & Offshore Engineering Co Ltd
- 16.2.11.1. Overview
- 16.2.11.2. Products
- 16.2.11.3. SWOT Analysis
- 16.2.11.4. Recent Developments
- 16.2.11.5. Financials (Based on Availability)
- 16.2.12 Fluor Corporation
- 16.2.12.1. Overview
- 16.2.12.2. Products
- 16.2.12.3. SWOT Analysis
- 16.2.12.4. Recent Developments
- 16.2.12.5. Financials (Based on Availability)
- 16.2.13 John Wood Group PLC
- 16.2.13.1. Overview
- 16.2.13.2. Products
- 16.2.13.3. SWOT Analysis
- 16.2.13.4. Recent Developments
- 16.2.13.5. Financials (Based on Availability)
- 16.2.14 TechnipFMC PLC
- 16.2.14.1. Overview
- 16.2.14.2. Products
- 16.2.14.3. SWOT Analysis
- 16.2.14.4. Recent Developments
- 16.2.14.5. Financials (Based on Availability)
- 16.2.15 McDermott International Ltd
- 16.2.15.1. Overview
- 16.2.15.2. Products
- 16.2.15.3. SWOT Analysis
- 16.2.15.4. Recent Developments
- 16.2.15.5. Financials (Based on Availability)
- 16.2.1 Sinopec Engineering (Group) Co Ltd
List of Figures
- Figure 1: Global Oil and Gas EPC Market Revenue Breakdown (Million, %) by Region 2024 & 2032
- Figure 2: North America Oil and Gas EPC Market Revenue (Million), by Country 2024 & 2032
- Figure 3: North America Oil and Gas EPC Market Revenue Share (%), by Country 2024 & 2032
- Figure 4: Europe Oil and Gas EPC Market Revenue (Million), by Country 2024 & 2032
- Figure 5: Europe Oil and Gas EPC Market Revenue Share (%), by Country 2024 & 2032
- Figure 6: Asia Pacific Oil and Gas EPC Market Revenue (Million), by Country 2024 & 2032
- Figure 7: Asia Pacific Oil and Gas EPC Market Revenue Share (%), by Country 2024 & 2032
- Figure 8: South America Oil and Gas EPC Market Revenue (Million), by Country 2024 & 2032
- Figure 9: South America Oil and Gas EPC Market Revenue Share (%), by Country 2024 & 2032
- Figure 10: Middle East and Africa Oil and Gas EPC Market Revenue (Million), by Country 2024 & 2032
- Figure 11: Middle East and Africa Oil and Gas EPC Market Revenue Share (%), by Country 2024 & 2032
- Figure 12: North America Oil and Gas EPC Market Revenue (Million), by Sector 2024 & 2032
- Figure 13: North America Oil and Gas EPC Market Revenue Share (%), by Sector 2024 & 2032
- Figure 14: North America Oil and Gas EPC Market Revenue (Million), by Country 2024 & 2032
- Figure 15: North America Oil and Gas EPC Market Revenue Share (%), by Country 2024 & 2032
- Figure 16: Europe Oil and Gas EPC Market Revenue (Million), by Sector 2024 & 2032
- Figure 17: Europe Oil and Gas EPC Market Revenue Share (%), by Sector 2024 & 2032
- Figure 18: Europe Oil and Gas EPC Market Revenue (Million), by Country 2024 & 2032
- Figure 19: Europe Oil and Gas EPC Market Revenue Share (%), by Country 2024 & 2032
- Figure 20: Asia Pacific Oil and Gas EPC Market Revenue (Million), by Sector 2024 & 2032
- Figure 21: Asia Pacific Oil and Gas EPC Market Revenue Share (%), by Sector 2024 & 2032
- Figure 22: Asia Pacific Oil and Gas EPC Market Revenue (Million), by Country 2024 & 2032
- Figure 23: Asia Pacific Oil and Gas EPC Market Revenue Share (%), by Country 2024 & 2032
- Figure 24: South America Oil and Gas EPC Market Revenue (Million), by Sector 2024 & 2032
- Figure 25: South America Oil and Gas EPC Market Revenue Share (%), by Sector 2024 & 2032
- Figure 26: South America Oil and Gas EPC Market Revenue (Million), by Country 2024 & 2032
- Figure 27: South America Oil and Gas EPC Market Revenue Share (%), by Country 2024 & 2032
- Figure 28: Middle East and Africa Oil and Gas EPC Market Revenue (Million), by Sector 2024 & 2032
- Figure 29: Middle East and Africa Oil and Gas EPC Market Revenue Share (%), by Sector 2024 & 2032
- Figure 30: Middle East and Africa Oil and Gas EPC Market Revenue (Million), by Country 2024 & 2032
- Figure 31: Middle East and Africa Oil and Gas EPC Market Revenue Share (%), by Country 2024 & 2032
List of Tables
- Table 1: Global Oil and Gas EPC Market Revenue Million Forecast, by Region 2019 & 2032
- Table 2: Global Oil and Gas EPC Market Revenue Million Forecast, by Sector 2019 & 2032
- Table 3: Global Oil and Gas EPC Market Revenue Million Forecast, by Region 2019 & 2032
- Table 4: Global Oil and Gas EPC Market Revenue Million Forecast, by Country 2019 & 2032
- Table 5: United States Oil and Gas EPC Market Revenue (Million) Forecast, by Application 2019 & 2032
- Table 6: Canada Oil and Gas EPC Market Revenue (Million) Forecast, by Application 2019 & 2032
- Table 7: Rest of North America Oil and Gas EPC Market Revenue (Million) Forecast, by Application 2019 & 2032
- Table 8: Global Oil and Gas EPC Market Revenue Million Forecast, by Country 2019 & 2032
- Table 9: Germany Oil and Gas EPC Market Revenue (Million) Forecast, by Application 2019 & 2032
- Table 10: France Oil and Gas EPC Market Revenue (Million) Forecast, by Application 2019 & 2032
- Table 11: United Kingdom Oil and Gas EPC Market Revenue (Million) Forecast, by Application 2019 & 2032
- Table 12: Rest of Europe Oil and Gas EPC Market Revenue (Million) Forecast, by Application 2019 & 2032
- Table 13: Global Oil and Gas EPC Market Revenue Million Forecast, by Country 2019 & 2032
- Table 14: China Oil and Gas EPC Market Revenue (Million) Forecast, by Application 2019 & 2032
- Table 15: India Oil and Gas EPC Market Revenue (Million) Forecast, by Application 2019 & 2032
- Table 16: Japan Oil and Gas EPC Market Revenue (Million) Forecast, by Application 2019 & 2032
- Table 17: South Korea Oil and Gas EPC Market Revenue (Million) Forecast, by Application 2019 & 2032
- Table 18: Rest of Asia Pacific Oil and Gas EPC Market Revenue (Million) Forecast, by Application 2019 & 2032
- Table 19: Global Oil and Gas EPC Market Revenue Million Forecast, by Country 2019 & 2032
- Table 20: Brazil Oil and Gas EPC Market Revenue (Million) Forecast, by Application 2019 & 2032
- Table 21: Argentina Oil and Gas EPC Market Revenue (Million) Forecast, by Application 2019 & 2032
- Table 22: Rest of South America Oil and Gas EPC Market Revenue (Million) Forecast, by Application 2019 & 2032
- Table 23: Global Oil and Gas EPC Market Revenue Million Forecast, by Country 2019 & 2032
- Table 24: Saudi Arabia Oil and Gas EPC Market Revenue (Million) Forecast, by Application 2019 & 2032
- Table 25: United Arab Emirates Oil and Gas EPC Market Revenue (Million) Forecast, by Application 2019 & 2032
- Table 26: South Africa Oil and Gas EPC Market Revenue (Million) Forecast, by Application 2019 & 2032
- Table 27: Rest of Middle East and Africa Oil and Gas EPC Market Revenue (Million) Forecast, by Application 2019 & 2032
- Table 28: Global Oil and Gas EPC Market Revenue Million Forecast, by Sector 2019 & 2032
- Table 29: Global Oil and Gas EPC Market Revenue Million Forecast, by Country 2019 & 2032
- Table 30: United States Oil and Gas EPC Market Revenue (Million) Forecast, by Application 2019 & 2032
- Table 31: Canada Oil and Gas EPC Market Revenue (Million) Forecast, by Application 2019 & 2032
- Table 32: Rest of North America Oil and Gas EPC Market Revenue (Million) Forecast, by Application 2019 & 2032
- Table 33: Global Oil and Gas EPC Market Revenue Million Forecast, by Sector 2019 & 2032
- Table 34: Global Oil and Gas EPC Market Revenue Million Forecast, by Country 2019 & 2032
- Table 35: Germany Oil and Gas EPC Market Revenue (Million) Forecast, by Application 2019 & 2032
- Table 36: France Oil and Gas EPC Market Revenue (Million) Forecast, by Application 2019 & 2032
- Table 37: United Kingdom Oil and Gas EPC Market Revenue (Million) Forecast, by Application 2019 & 2032
- Table 38: Rest of Europe Oil and Gas EPC Market Revenue (Million) Forecast, by Application 2019 & 2032
- Table 39: Global Oil and Gas EPC Market Revenue Million Forecast, by Sector 2019 & 2032
- Table 40: Global Oil and Gas EPC Market Revenue Million Forecast, by Country 2019 & 2032
- Table 41: China Oil and Gas EPC Market Revenue (Million) Forecast, by Application 2019 & 2032
- Table 42: India Oil and Gas EPC Market Revenue (Million) Forecast, by Application 2019 & 2032
- Table 43: Japan Oil and Gas EPC Market Revenue (Million) Forecast, by Application 2019 & 2032
- Table 44: South Korea Oil and Gas EPC Market Revenue (Million) Forecast, by Application 2019 & 2032
- Table 45: Rest of Asia Pacific Oil and Gas EPC Market Revenue (Million) Forecast, by Application 2019 & 2032
- Table 46: Global Oil and Gas EPC Market Revenue Million Forecast, by Sector 2019 & 2032
- Table 47: Global Oil and Gas EPC Market Revenue Million Forecast, by Country 2019 & 2032
- Table 48: Brazil Oil and Gas EPC Market Revenue (Million) Forecast, by Application 2019 & 2032
- Table 49: Argentina Oil and Gas EPC Market Revenue (Million) Forecast, by Application 2019 & 2032
- Table 50: Rest of South America Oil and Gas EPC Market Revenue (Million) Forecast, by Application 2019 & 2032
- Table 51: Global Oil and Gas EPC Market Revenue Million Forecast, by Sector 2019 & 2032
- Table 52: Global Oil and Gas EPC Market Revenue Million Forecast, by Country 2019 & 2032
- Table 53: Saudi Arabia Oil and Gas EPC Market Revenue (Million) Forecast, by Application 2019 & 2032
- Table 54: United Arab Emirates Oil and Gas EPC Market Revenue (Million) Forecast, by Application 2019 & 2032
- Table 55: South Africa Oil and Gas EPC Market Revenue (Million) Forecast, by Application 2019 & 2032
- Table 56: Rest of Middle East and Africa Oil and Gas EPC Market Revenue (Million) Forecast, by Application 2019 & 2032
Frequently Asked Questions
1. What is the projected Compound Annual Growth Rate (CAGR) of the Oil and Gas EPC Market?
The projected CAGR is approximately 4.76%.
2. Which companies are prominent players in the Oil and Gas EPC Market?
Key companies in the market include Sinopec Engineering (Group) Co Ltd, Bechtel Corporation, Samsung Engineering Co Ltd, Técnicas Reunidas SA, Daewoo Engineering & Construction Co Ltd, National Petroleum Construction Company, KBR Inc, Petrofac Limited, Hyundai Engineering & Construction Co Ltd, Saipem SpA, Korea Shipbuilding & Offshore Engineering Co Ltd, Fluor Corporation, John Wood Group PLC, TechnipFMC PLC, McDermott International Ltd.
3. What are the main segments of the Oil and Gas EPC Market?
The market segments include Sector.
4. Can you provide details about the market size?
The market size is estimated to be USD 456.91 Million as of 2022.
5. What are some drivers contributing to market growth?
4.; Growing Demand to Develop the Natural Gas Infrastructure4.; Increase in Offshore Oil and Gas Exploration and Production (E&P) Activities.
6. What are the notable trends driving market growth?
Upstream Segment Expected to Dominate the Market.
7. Are there any restraints impacting market growth?
4.; High Volatility of Oil and Gas Prices.
8. Can you provide examples of recent developments in the market?
May 2023, QatarEnergy announced the award of the engineering, procurement, and construction (EPC) contract for the North Field South (NFS) project, which comprises two LNG mega trains with a combined capacity of 16 million tons per annum (MTPA). NFS, jointly with the North Field East (NFE) project, will expand Qatar’s LNG production capacity from the current 77 MTPA to 126 MTPA. QatarEnergy maintains a 75% interest in the NFS project and has already signed partnership agreements with TotalEnergies, Shell, and ConocoPhillips for the remaining 25%.
9. What pricing options are available for accessing the report?
Pricing options include single-user, multi-user, and enterprise licenses priced at USD 4750, USD 5250, and USD 8750 respectively.
10. Is the market size provided in terms of value or volume?
The market size is provided in terms of value, measured in Million.
11. Are there any specific market keywords associated with the report?
Yes, the market keyword associated with the report is "Oil and Gas EPC Market," which aids in identifying and referencing the specific market segment covered.
12. How do I determine which pricing option suits my needs best?
The pricing options vary based on user requirements and access needs. Individual users may opt for single-user licenses, while businesses requiring broader access may choose multi-user or enterprise licenses for cost-effective access to the report.
13. Are there any additional resources or data provided in the Oil and Gas EPC Market report?
While the report offers comprehensive insights, it's advisable to review the specific contents or supplementary materials provided to ascertain if additional resources or data are available.
14. How can I stay updated on further developments or reports in the Oil and Gas EPC Market?
To stay informed about further developments, trends, and reports in the Oil and Gas EPC Market, consider subscribing to industry newsletters, following relevant companies and organizations, or regularly checking reputable industry news sources and publications.
Methodology
Step 1 - Identification of Relevant Samples Size from Population Database


Step 2 - Approaches for Defining Global Market Size (Value, Volume* & Price*)

Note*: In applicable scenarios
Step 3 - Data Sources
Primary Research
- Web Analytics
- Survey Reports
- Research Institute
- Latest Research Reports
- Opinion Leaders
Secondary Research
- Annual Reports
- White Paper
- Latest Press Release
- Industry Association
- Paid Database
- Investor Presentations

Step 4 - Data Triangulation
Involves using different sources of information in order to increase the validity of a study
These sources are likely to be stakeholders in a program - participants, other researchers, program staff, other community members, and so on.
Then we put all data in single framework & apply various statistical tools to find out the dynamic on the market.
During the analysis stage, feedback from the stakeholder groups would be compared to determine areas of agreement as well as areas of divergence


