
Key Insights
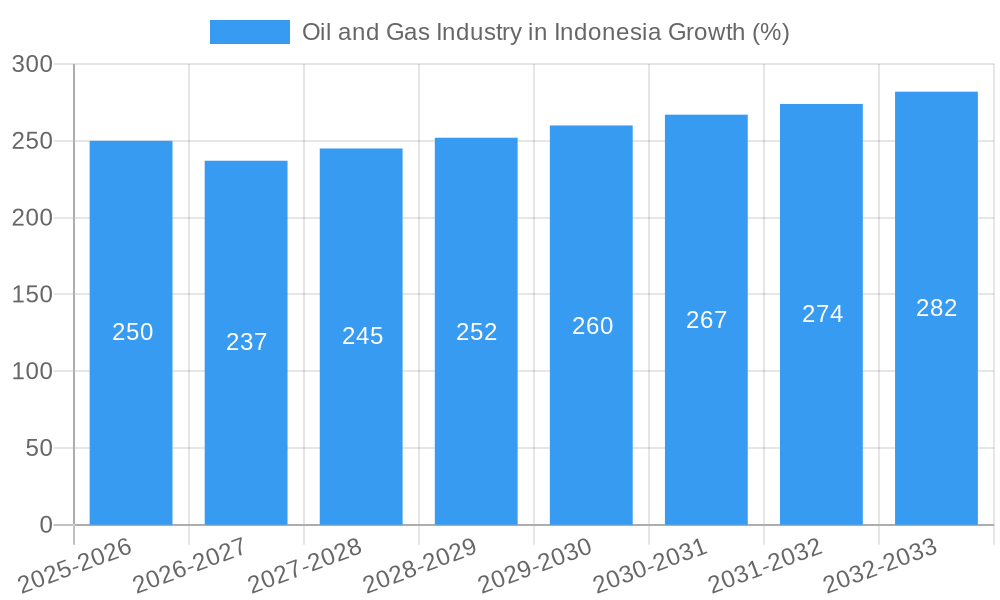
The Indonesian oil and gas market, valued at $17,500 million in 2025, presents a compelling investment landscape despite a relatively modest Compound Annual Growth Rate (CAGR) of 1.60%. This growth, while moderate, is underpinned by consistent demand across key sectors. Power generation remains a significant driver, fueled by Indonesia's increasing energy needs and industrialization. The transportation sector, particularly road transport, contributes substantially to oil consumption. Industrial usage, encompassing manufacturing and other processes, further adds to the demand. While residential consumption is a smaller segment, it represents a growing market with implications for liquefied petroleum gas (LPG) sales. Sumatra, Java, and Kalimantan are the dominant regions in terms of production and consumption, reflecting their established infrastructure and industrial bases. Challenges include fluctuating global oil prices, increasing environmental regulations pushing for renewable energy transition, and potential supply chain disruptions. However, significant domestic reserves, coupled with strategic investments in exploration and infrastructure development, are expected to sustain the market's growth trajectory throughout the forecast period (2025-2033). Major players such as Pertamina, Perusahaan Gas Negara, Shell, and ExxonMobil are key to the market’s future, leveraging their experience and resources to navigate the complex interplay of domestic needs and global energy dynamics.
The forecast period (2025-2033) suggests a steady growth pattern, albeit one influenced by various factors. Government policies aimed at balancing energy security with environmental sustainability will play a critical role. Investments in renewable energy sources will likely influence the pace of growth in the oil and gas sector, prompting the industry to adapt through diversification, efficiency improvements, and exploration of new technologies. The competitive landscape is characterized by a mix of international energy giants and domestic players, each vying for market share. The market’s growth will hinge on effective collaboration between these stakeholders, fostering sustainable practices while ensuring energy security for Indonesia's economic development. This will involve strategic alliances and technological innovation to meet the country’s energy requirements efficiently and responsibly.

Indonesia's Oil and Gas Industry: A Comprehensive Market Report (2019-2033)
This comprehensive report provides an in-depth analysis of Indonesia's oil and gas industry, offering invaluable insights for industry professionals, investors, and policymakers. Covering the period from 2019 to 2033, with a focus on 2025, this report examines market structure, dynamics, key players, and future opportunities within this crucial sector. We project a market valued at xx Million USD by 2025.
Oil and Gas Industry in Indonesia Market Structure & Innovation Trends
This section analyzes the competitive landscape, innovation drivers, and regulatory aspects of Indonesia's oil and gas sector. The market exhibits moderate concentration, with key players such as Shell PLC, ConocoPhillips Company, PT Pertamina, PT Perusahaan Gas Negara Tbk, and BP PLC holding significant market share. Other notable players include Chevron Corporation, Petroliam Nasional Berhad, PT Connusa Energindo, ExxonMobil Corporation, and China National Offshore Oil Corporation. However, the market also includes numerous smaller, independent operators.
- Market Concentration: PT Pertamina holds the largest market share, estimated at xx%, followed by Shell PLC at xx% and other major players.
- Innovation Drivers: Government policies promoting energy security and diversification, alongside increasing investment in renewable energy sources, are significant drivers of innovation. Technological advancements in exploration, production, and refining are also key.
- Regulatory Framework: Indonesia's regulatory framework is constantly evolving, with a focus on promoting both domestic production and attracting foreign investment while also incorporating environmental concerns.
- Product Substitutes: The increasing adoption of renewable energy sources and electric vehicles presents a growing challenge and a driver for innovation toward cleaner energy solutions.
- End-User Demographics: The demand for oil and gas is largely driven by power generation, transportation, and industrial sectors. Residential use contributes a smaller but still significant portion.
- M&A Activities: The past five years have witnessed several significant M&A activities, with deal values totaling xx Million USD. These deals primarily involve consolidation within the sector and expansion into new geographical areas.
Oil and Gas Industry in Indonesia Market Dynamics & Trends
Indonesia's oil and gas market is experiencing dynamic shifts driven by several factors. Growth is fueled by robust domestic demand, particularly from power generation and industrial sectors. However, fluctuating global prices, geopolitical uncertainties, and the increasing push for energy transition pose challenges. The market’s Compound Annual Growth Rate (CAGR) during the forecast period (2025-2033) is projected to be xx%, driven by a continuous increase in energy consumption. Market penetration of natural gas, as a cleaner fuel source compared to crude oil, shows steady growth, increasing from xx% in 2025 to xx% by 2033. Technological disruptions, such as the adoption of enhanced oil recovery techniques and digitalization efforts, are streamlining operations and boosting efficiency. The sector’s response to consumer preferences for sustainable energy sources is increasingly noticeable through investments in renewable and cleaner technologies. Finally, the competitive landscape is evolving with both domestic and international companies vying for market share.
Dominant Regions & Segments in Oil and Gas Industry in Indonesia
Indonesia's oil and gas resources are geographically dispersed across various regions.
Dominant Regions: Kalimantan and Sumatra currently hold the largest reserves and production volume, contributing significantly to the overall market share. Java, due to high population density and industrial concentration, also experiences high demand and consumption.
Dominant Product Segments: Natural gas currently represents the largest market segment due to rising demand for power generation and industrial applications. Crude oil production remains substantial but is facing pressure from the energy transition. Refined products follow with significant contribution, mostly catering to the transportation sector.
Dominant Application Segments: Power generation is the largest application segment, followed by the industrial sector, transport, and residential use. Key drivers for growth in different regions vary, but include government policies, economic development, and infrastructure investment. For instance, the expansion of power plants in Java is driving the growth of the natural gas segment.
Regional Growth Drivers:
- Sumatra: Extensive oil and gas reserves and improving infrastructure.
- Java: High population density and industrial activity driving robust demand.
- Kalimantan: Significant reserves and proximity to key markets.
- Papua: Exploration and production are ongoing, with considerable growth potential.
- East Indonesia: Growth is driven by increasing infrastructure investment and energy demands from emerging industries.
Oil and Gas Industry in Indonesia Product Innovations
The Indonesian oil and gas industry is actively engaging in product innovation. Emphasis is placed on improving extraction techniques to increase efficiency and lower environmental impact. Enhanced oil recovery (EOR) techniques and digitalization are key focuses. The development of cleaner fuels, including liquefied natural gas (LNG), is driven by both environmental concerns and growing demand for cleaner energy. These innovations aim to improve market competitiveness and enhance sustainability, aligning with global environmental regulations and consumer preferences.
Report Scope & Segmentation Analysis
This report segments the Indonesian oil and gas market across three dimensions: product, application, and region.
Product Segmentation: Crude oil, natural gas, and refined products (gasoline, diesel, etc.). Each segment's market size, growth projections, and competitive dynamics are analyzed.
Application Segmentation: Power generation, transportation, industrial use, and residential use. Detailed analysis examines each sector's influence on overall market demand and the projected growth in each sector is given.
Regional Segmentation: Sumatra, Java, Kalimantan, Papua, and East Indonesia. The report provides regional production, consumption, and growth outlooks.
Key Drivers of Oil and Gas Industry in Indonesia Growth
Indonesia's oil and gas sector growth is driven by several factors:
- Growing Energy Demand: Rapid economic development fuels increasing energy consumption across all sectors.
- Government Initiatives: Policies incentivize domestic production and attract foreign investment.
- Technological Advancements: Enhanced recovery techniques and digitalization improve efficiency and production.
Challenges in the Oil and Gas Industry in Indonesia Sector
The Indonesian oil and gas sector faces challenges:
- Price Volatility: Global oil and gas prices significantly impact profitability.
- Infrastructure Limitations: Insufficient infrastructure in certain areas hinders production and transportation.
- Environmental Concerns: Sustainable practices and environmental regulations necessitate continuous investments.
Emerging Opportunities in Oil and Gas Industry in Indonesia
Emerging opportunities include:
- LNG Exports: Growing global demand offers significant export potential.
- Deepwater Exploration: Untapped reserves in deepwater areas present substantial growth opportunities.
- Renewable Energy Integration: Integrating renewable energy into oil and gas operations enhances sustainability.
Leading Players in the Oil and Gas Industry in Indonesia Market
- Shell PLC
- ConocoPhillips Company
- PT Pertamina
- PT Perusahaan Gas Negara Tbk
- BP PLC
- Chevron Corporation
- Petroliam Nasional Berhad
- PT Connusa Energindo
- ExxonMobil Corporation
- China National Offshore Oil Corporation
Key Developments in Oil and Gas Industry in Indonesia Industry
- November 2022: Medco Energy Internasional Tbk signed a five-year gas supply agreement with Singapore, ensuring continued gas exports from Indonesia.
- June 2023: Sembcorp Industries signed a USD 1.41 Billion gas sales agreement with Medco Energi International for gas imports from the West Natuna gas field.
Future Outlook for Oil and Gas Industry in Indonesia Market
Indonesia's oil and gas sector holds significant future potential, fueled by continued domestic demand and the possibility of increasing exports. Strategic investments in infrastructure development, technological advancements, and sustainable practices are crucial. Government policies supportive of exploration, production, and diversification will be critical to maximizing the sector's long-term growth and securing Indonesia's energy future.
Oil and Gas Industry in Indonesia Segmentation
- 1. Upstream
- 2. Midstream
- 3. Downstream
Oil and Gas Industry in Indonesia Segmentation By Geography
-
1. North America
- 1.1. United States
- 1.2. Canada
- 1.3. Mexico
-
2. South America
- 2.1. Brazil
- 2.2. Argentina
- 2.3. Rest of South America
-
3. Europe
- 3.1. United Kingdom
- 3.2. Germany
- 3.3. France
- 3.4. Italy
- 3.5. Spain
- 3.6. Russia
- 3.7. Benelux
- 3.8. Nordics
- 3.9. Rest of Europe
-
4. Middle East & Africa
- 4.1. Turkey
- 4.2. Israel
- 4.3. GCC
- 4.4. North Africa
- 4.5. South Africa
- 4.6. Rest of Middle East & Africa
-
5. Asia Pacific
- 5.1. China
- 5.2. India
- 5.3. Japan
- 5.4. South Korea
- 5.5. ASEAN
- 5.6. Oceania
- 5.7. Rest of Asia Pacific

Oil and Gas Industry in Indonesia REPORT HIGHLIGHTS
| Aspects | Details |
|---|---|
| Study Period | 2019-2033 |
| Base Year | 2024 |
| Estimated Year | 2025 |
| Forecast Period | 2025-2033 |
| Historical Period | 2019-2024 |
| Growth Rate | CAGR of 1.60% from 2019-2033 |
| Segmentation |
|
Table of Contents
- 1. Introduction
- 1.1. Research Scope
- 1.2. Market Segmentation
- 1.3. Research Methodology
- 1.4. Definitions and Assumptions
- 2. Executive Summary
- 2.1. Introduction
- 3. Market Dynamics
- 3.1. Introduction
- 3.2. Market Drivers
- 3.2.1. 4.; Increasing Demand for Petroleum Products Due to the Growth of the Local Economy4.; Government Initiatives to Boost the Production of Crude Oil and Natural Gas
- 3.3. Market Restrains
- 3.3.1. 4.; Increasing Adoption of Renewable Energy
- 3.4. Market Trends
- 3.4.1. Upstream Sector Expected to Witness Significant Growth
- 4. Market Factor Analysis
- 4.1. Porters Five Forces
- 4.2. Supply/Value Chain
- 4.3. PESTEL analysis
- 4.4. Market Entropy
- 4.5. Patent/Trademark Analysis
- 5. Global Oil and Gas Industry in Indonesia Analysis, Insights and Forecast, 2019-2031
- 5.1. Market Analysis, Insights and Forecast - by Upstream
- 5.2. Market Analysis, Insights and Forecast - by Midstream
- 5.3. Market Analysis, Insights and Forecast - by Downstream
- 5.4. Market Analysis, Insights and Forecast - by Region
- 5.4.1. North America
- 5.4.2. South America
- 5.4.3. Europe
- 5.4.4. Middle East & Africa
- 5.4.5. Asia Pacific
- 5.1. Market Analysis, Insights and Forecast - by Upstream
- 6. North America Oil and Gas Industry in Indonesia Analysis, Insights and Forecast, 2019-2031
- 6.1. Market Analysis, Insights and Forecast - by Upstream
- 6.2. Market Analysis, Insights and Forecast - by Midstream
- 6.3. Market Analysis, Insights and Forecast - by Downstream
- 6.1. Market Analysis, Insights and Forecast - by Upstream
- 7. South America Oil and Gas Industry in Indonesia Analysis, Insights and Forecast, 2019-2031
- 7.1. Market Analysis, Insights and Forecast - by Upstream
- 7.2. Market Analysis, Insights and Forecast - by Midstream
- 7.3. Market Analysis, Insights and Forecast - by Downstream
- 7.1. Market Analysis, Insights and Forecast - by Upstream
- 8. Europe Oil and Gas Industry in Indonesia Analysis, Insights and Forecast, 2019-2031
- 8.1. Market Analysis, Insights and Forecast - by Upstream
- 8.2. Market Analysis, Insights and Forecast - by Midstream
- 8.3. Market Analysis, Insights and Forecast - by Downstream
- 8.1. Market Analysis, Insights and Forecast - by Upstream
- 9. Middle East & Africa Oil and Gas Industry in Indonesia Analysis, Insights and Forecast, 2019-2031
- 9.1. Market Analysis, Insights and Forecast - by Upstream
- 9.2. Market Analysis, Insights and Forecast - by Midstream
- 9.3. Market Analysis, Insights and Forecast - by Downstream
- 9.1. Market Analysis, Insights and Forecast - by Upstream
- 10. Asia Pacific Oil and Gas Industry in Indonesia Analysis, Insights and Forecast, 2019-2031
- 10.1. Market Analysis, Insights and Forecast - by Upstream
- 10.2. Market Analysis, Insights and Forecast - by Midstream
- 10.3. Market Analysis, Insights and Forecast - by Downstream
- 10.1. Market Analysis, Insights and Forecast - by Upstream
- 11. Competitive Analysis
- 11.1. Global Market Share Analysis 2024
- 11.2. Company Profiles
- 11.2.1 Shell PLC
- 11.2.1.1. Overview
- 11.2.1.2. Products
- 11.2.1.3. SWOT Analysis
- 11.2.1.4. Recent Developments
- 11.2.1.5. Financials (Based on Availability)
- 11.2.2 ConcoPhillips Company
- 11.2.2.1. Overview
- 11.2.2.2. Products
- 11.2.2.3. SWOT Analysis
- 11.2.2.4. Recent Developments
- 11.2.2.5. Financials (Based on Availability)
- 11.2.3 PT Pertamina
- 11.2.3.1. Overview
- 11.2.3.2. Products
- 11.2.3.3. SWOT Analysis
- 11.2.3.4. Recent Developments
- 11.2.3.5. Financials (Based on Availability)
- 11.2.4 PT Perusahaan Gas Negara Tbk
- 11.2.4.1. Overview
- 11.2.4.2. Products
- 11.2.4.3. SWOT Analysis
- 11.2.4.4. Recent Developments
- 11.2.4.5. Financials (Based on Availability)
- 11.2.5 BP PLC*List Not Exhaustive
- 11.2.5.1. Overview
- 11.2.5.2. Products
- 11.2.5.3. SWOT Analysis
- 11.2.5.4. Recent Developments
- 11.2.5.5. Financials (Based on Availability)
- 11.2.6 Chevron Corporation
- 11.2.6.1. Overview
- 11.2.6.2. Products
- 11.2.6.3. SWOT Analysis
- 11.2.6.4. Recent Developments
- 11.2.6.5. Financials (Based on Availability)
- 11.2.7 Petroliam Nasional Berhad
- 11.2.7.1. Overview
- 11.2.7.2. Products
- 11.2.7.3. SWOT Analysis
- 11.2.7.4. Recent Developments
- 11.2.7.5. Financials (Based on Availability)
- 11.2.8 PT Connusa Energindo
- 11.2.8.1. Overview
- 11.2.8.2. Products
- 11.2.8.3. SWOT Analysis
- 11.2.8.4. Recent Developments
- 11.2.8.5. Financials (Based on Availability)
- 11.2.9 ExxonMobil Corporatoin
- 11.2.9.1. Overview
- 11.2.9.2. Products
- 11.2.9.3. SWOT Analysis
- 11.2.9.4. Recent Developments
- 11.2.9.5. Financials (Based on Availability)
- 11.2.10 China National Offshore Oil Corporation
- 11.2.10.1. Overview
- 11.2.10.2. Products
- 11.2.10.3. SWOT Analysis
- 11.2.10.4. Recent Developments
- 11.2.10.5. Financials (Based on Availability)
- 11.2.1 Shell PLC
List of Figures
- Figure 1: Global Oil and Gas Industry in Indonesia Revenue Breakdown (Million, %) by Region 2024 & 2032
- Figure 2: Global Oil and Gas Industry in Indonesia Volume Breakdown (Thousand, %) by Region 2024 & 2032
- Figure 3: Indonesia Oil and Gas Industry in Indonesia Revenue (Million), by Country 2024 & 2032
- Figure 4: Indonesia Oil and Gas Industry in Indonesia Volume (Thousand), by Country 2024 & 2032
- Figure 5: Indonesia Oil and Gas Industry in Indonesia Revenue Share (%), by Country 2024 & 2032
- Figure 6: Indonesia Oil and Gas Industry in Indonesia Volume Share (%), by Country 2024 & 2032
- Figure 7: North America Oil and Gas Industry in Indonesia Revenue (Million), by Upstream 2024 & 2032
- Figure 8: North America Oil and Gas Industry in Indonesia Volume (Thousand), by Upstream 2024 & 2032
- Figure 9: North America Oil and Gas Industry in Indonesia Revenue Share (%), by Upstream 2024 & 2032
- Figure 10: North America Oil and Gas Industry in Indonesia Volume Share (%), by Upstream 2024 & 2032
- Figure 11: North America Oil and Gas Industry in Indonesia Revenue (Million), by Midstream 2024 & 2032
- Figure 12: North America Oil and Gas Industry in Indonesia Volume (Thousand), by Midstream 2024 & 2032
- Figure 13: North America Oil and Gas Industry in Indonesia Revenue Share (%), by Midstream 2024 & 2032
- Figure 14: North America Oil and Gas Industry in Indonesia Volume Share (%), by Midstream 2024 & 2032
- Figure 15: North America Oil and Gas Industry in Indonesia Revenue (Million), by Downstream 2024 & 2032
- Figure 16: North America Oil and Gas Industry in Indonesia Volume (Thousand), by Downstream 2024 & 2032
- Figure 17: North America Oil and Gas Industry in Indonesia Revenue Share (%), by Downstream 2024 & 2032
- Figure 18: North America Oil and Gas Industry in Indonesia Volume Share (%), by Downstream 2024 & 2032
- Figure 19: North America Oil and Gas Industry in Indonesia Revenue (Million), by Country 2024 & 2032
- Figure 20: North America Oil and Gas Industry in Indonesia Volume (Thousand), by Country 2024 & 2032
- Figure 21: North America Oil and Gas Industry in Indonesia Revenue Share (%), by Country 2024 & 2032
- Figure 22: North America Oil and Gas Industry in Indonesia Volume Share (%), by Country 2024 & 2032
- Figure 23: South America Oil and Gas Industry in Indonesia Revenue (Million), by Upstream 2024 & 2032
- Figure 24: South America Oil and Gas Industry in Indonesia Volume (Thousand), by Upstream 2024 & 2032
- Figure 25: South America Oil and Gas Industry in Indonesia Revenue Share (%), by Upstream 2024 & 2032
- Figure 26: South America Oil and Gas Industry in Indonesia Volume Share (%), by Upstream 2024 & 2032
- Figure 27: South America Oil and Gas Industry in Indonesia Revenue (Million), by Midstream 2024 & 2032
- Figure 28: South America Oil and Gas Industry in Indonesia Volume (Thousand), by Midstream 2024 & 2032
- Figure 29: South America Oil and Gas Industry in Indonesia Revenue Share (%), by Midstream 2024 & 2032
- Figure 30: South America Oil and Gas Industry in Indonesia Volume Share (%), by Midstream 2024 & 2032
- Figure 31: South America Oil and Gas Industry in Indonesia Revenue (Million), by Downstream 2024 & 2032
- Figure 32: South America Oil and Gas Industry in Indonesia Volume (Thousand), by Downstream 2024 & 2032
- Figure 33: South America Oil and Gas Industry in Indonesia Revenue Share (%), by Downstream 2024 & 2032
- Figure 34: South America Oil and Gas Industry in Indonesia Volume Share (%), by Downstream 2024 & 2032
- Figure 35: South America Oil and Gas Industry in Indonesia Revenue (Million), by Country 2024 & 2032
- Figure 36: South America Oil and Gas Industry in Indonesia Volume (Thousand), by Country 2024 & 2032
- Figure 37: South America Oil and Gas Industry in Indonesia Revenue Share (%), by Country 2024 & 2032
- Figure 38: South America Oil and Gas Industry in Indonesia Volume Share (%), by Country 2024 & 2032
- Figure 39: Europe Oil and Gas Industry in Indonesia Revenue (Million), by Upstream 2024 & 2032
- Figure 40: Europe Oil and Gas Industry in Indonesia Volume (Thousand), by Upstream 2024 & 2032
- Figure 41: Europe Oil and Gas Industry in Indonesia Revenue Share (%), by Upstream 2024 & 2032
- Figure 42: Europe Oil and Gas Industry in Indonesia Volume Share (%), by Upstream 2024 & 2032
- Figure 43: Europe Oil and Gas Industry in Indonesia Revenue (Million), by Midstream 2024 & 2032
- Figure 44: Europe Oil and Gas Industry in Indonesia Volume (Thousand), by Midstream 2024 & 2032
- Figure 45: Europe Oil and Gas Industry in Indonesia Revenue Share (%), by Midstream 2024 & 2032
- Figure 46: Europe Oil and Gas Industry in Indonesia Volume Share (%), by Midstream 2024 & 2032
- Figure 47: Europe Oil and Gas Industry in Indonesia Revenue (Million), by Downstream 2024 & 2032
- Figure 48: Europe Oil and Gas Industry in Indonesia Volume (Thousand), by Downstream 2024 & 2032
- Figure 49: Europe Oil and Gas Industry in Indonesia Revenue Share (%), by Downstream 2024 & 2032
- Figure 50: Europe Oil and Gas Industry in Indonesia Volume Share (%), by Downstream 2024 & 2032
- Figure 51: Europe Oil and Gas Industry in Indonesia Revenue (Million), by Country 2024 & 2032
- Figure 52: Europe Oil and Gas Industry in Indonesia Volume (Thousand), by Country 2024 & 2032
- Figure 53: Europe Oil and Gas Industry in Indonesia Revenue Share (%), by Country 2024 & 2032
- Figure 54: Europe Oil and Gas Industry in Indonesia Volume Share (%), by Country 2024 & 2032
- Figure 55: Middle East & Africa Oil and Gas Industry in Indonesia Revenue (Million), by Upstream 2024 & 2032
- Figure 56: Middle East & Africa Oil and Gas Industry in Indonesia Volume (Thousand), by Upstream 2024 & 2032
- Figure 57: Middle East & Africa Oil and Gas Industry in Indonesia Revenue Share (%), by Upstream 2024 & 2032
- Figure 58: Middle East & Africa Oil and Gas Industry in Indonesia Volume Share (%), by Upstream 2024 & 2032
- Figure 59: Middle East & Africa Oil and Gas Industry in Indonesia Revenue (Million), by Midstream 2024 & 2032
- Figure 60: Middle East & Africa Oil and Gas Industry in Indonesia Volume (Thousand), by Midstream 2024 & 2032
- Figure 61: Middle East & Africa Oil and Gas Industry in Indonesia Revenue Share (%), by Midstream 2024 & 2032
- Figure 62: Middle East & Africa Oil and Gas Industry in Indonesia Volume Share (%), by Midstream 2024 & 2032
- Figure 63: Middle East & Africa Oil and Gas Industry in Indonesia Revenue (Million), by Downstream 2024 & 2032
- Figure 64: Middle East & Africa Oil and Gas Industry in Indonesia Volume (Thousand), by Downstream 2024 & 2032
- Figure 65: Middle East & Africa Oil and Gas Industry in Indonesia Revenue Share (%), by Downstream 2024 & 2032
- Figure 66: Middle East & Africa Oil and Gas Industry in Indonesia Volume Share (%), by Downstream 2024 & 2032
- Figure 67: Middle East & Africa Oil and Gas Industry in Indonesia Revenue (Million), by Country 2024 & 2032
- Figure 68: Middle East & Africa Oil and Gas Industry in Indonesia Volume (Thousand), by Country 2024 & 2032
- Figure 69: Middle East & Africa Oil and Gas Industry in Indonesia Revenue Share (%), by Country 2024 & 2032
- Figure 70: Middle East & Africa Oil and Gas Industry in Indonesia Volume Share (%), by Country 2024 & 2032
- Figure 71: Asia Pacific Oil and Gas Industry in Indonesia Revenue (Million), by Upstream 2024 & 2032
- Figure 72: Asia Pacific Oil and Gas Industry in Indonesia Volume (Thousand), by Upstream 2024 & 2032
- Figure 73: Asia Pacific Oil and Gas Industry in Indonesia Revenue Share (%), by Upstream 2024 & 2032
- Figure 74: Asia Pacific Oil and Gas Industry in Indonesia Volume Share (%), by Upstream 2024 & 2032
- Figure 75: Asia Pacific Oil and Gas Industry in Indonesia Revenue (Million), by Midstream 2024 & 2032
- Figure 76: Asia Pacific Oil and Gas Industry in Indonesia Volume (Thousand), by Midstream 2024 & 2032
- Figure 77: Asia Pacific Oil and Gas Industry in Indonesia Revenue Share (%), by Midstream 2024 & 2032
- Figure 78: Asia Pacific Oil and Gas Industry in Indonesia Volume Share (%), by Midstream 2024 & 2032
- Figure 79: Asia Pacific Oil and Gas Industry in Indonesia Revenue (Million), by Downstream 2024 & 2032
- Figure 80: Asia Pacific Oil and Gas Industry in Indonesia Volume (Thousand), by Downstream 2024 & 2032
- Figure 81: Asia Pacific Oil and Gas Industry in Indonesia Revenue Share (%), by Downstream 2024 & 2032
- Figure 82: Asia Pacific Oil and Gas Industry in Indonesia Volume Share (%), by Downstream 2024 & 2032
- Figure 83: Asia Pacific Oil and Gas Industry in Indonesia Revenue (Million), by Country 2024 & 2032
- Figure 84: Asia Pacific Oil and Gas Industry in Indonesia Volume (Thousand), by Country 2024 & 2032
- Figure 85: Asia Pacific Oil and Gas Industry in Indonesia Revenue Share (%), by Country 2024 & 2032
- Figure 86: Asia Pacific Oil and Gas Industry in Indonesia Volume Share (%), by Country 2024 & 2032
List of Tables
- Table 1: Global Oil and Gas Industry in Indonesia Revenue Million Forecast, by Region 2019 & 2032
- Table 2: Global Oil and Gas Industry in Indonesia Volume Thousand Forecast, by Region 2019 & 2032
- Table 3: Global Oil and Gas Industry in Indonesia Revenue Million Forecast, by Upstream 2019 & 2032
- Table 4: Global Oil and Gas Industry in Indonesia Volume Thousand Forecast, by Upstream 2019 & 2032
- Table 5: Global Oil and Gas Industry in Indonesia Revenue Million Forecast, by Midstream 2019 & 2032
- Table 6: Global Oil and Gas Industry in Indonesia Volume Thousand Forecast, by Midstream 2019 & 2032
- Table 7: Global Oil and Gas Industry in Indonesia Revenue Million Forecast, by Downstream 2019 & 2032
- Table 8: Global Oil and Gas Industry in Indonesia Volume Thousand Forecast, by Downstream 2019 & 2032
- Table 9: Global Oil and Gas Industry in Indonesia Revenue Million Forecast, by Region 2019 & 2032
- Table 10: Global Oil and Gas Industry in Indonesia Volume Thousand Forecast, by Region 2019 & 2032
- Table 11: Global Oil and Gas Industry in Indonesia Revenue Million Forecast, by Country 2019 & 2032
- Table 12: Global Oil and Gas Industry in Indonesia Volume Thousand Forecast, by Country 2019 & 2032
- Table 13: Global Oil and Gas Industry in Indonesia Revenue Million Forecast, by Upstream 2019 & 2032
- Table 14: Global Oil and Gas Industry in Indonesia Volume Thousand Forecast, by Upstream 2019 & 2032
- Table 15: Global Oil and Gas Industry in Indonesia Revenue Million Forecast, by Midstream 2019 & 2032
- Table 16: Global Oil and Gas Industry in Indonesia Volume Thousand Forecast, by Midstream 2019 & 2032
- Table 17: Global Oil and Gas Industry in Indonesia Revenue Million Forecast, by Downstream 2019 & 2032
- Table 18: Global Oil and Gas Industry in Indonesia Volume Thousand Forecast, by Downstream 2019 & 2032
- Table 19: Global Oil and Gas Industry in Indonesia Revenue Million Forecast, by Country 2019 & 2032
- Table 20: Global Oil and Gas Industry in Indonesia Volume Thousand Forecast, by Country 2019 & 2032
- Table 21: United States Oil and Gas Industry in Indonesia Revenue (Million) Forecast, by Application 2019 & 2032
- Table 22: United States Oil and Gas Industry in Indonesia Volume (Thousand) Forecast, by Application 2019 & 2032
- Table 23: Canada Oil and Gas Industry in Indonesia Revenue (Million) Forecast, by Application 2019 & 2032
- Table 24: Canada Oil and Gas Industry in Indonesia Volume (Thousand) Forecast, by Application 2019 & 2032
- Table 25: Mexico Oil and Gas Industry in Indonesia Revenue (Million) Forecast, by Application 2019 & 2032
- Table 26: Mexico Oil and Gas Industry in Indonesia Volume (Thousand) Forecast, by Application 2019 & 2032
- Table 27: Global Oil and Gas Industry in Indonesia Revenue Million Forecast, by Upstream 2019 & 2032
- Table 28: Global Oil and Gas Industry in Indonesia Volume Thousand Forecast, by Upstream 2019 & 2032
- Table 29: Global Oil and Gas Industry in Indonesia Revenue Million Forecast, by Midstream 2019 & 2032
- Table 30: Global Oil and Gas Industry in Indonesia Volume Thousand Forecast, by Midstream 2019 & 2032
- Table 31: Global Oil and Gas Industry in Indonesia Revenue Million Forecast, by Downstream 2019 & 2032
- Table 32: Global Oil and Gas Industry in Indonesia Volume Thousand Forecast, by Downstream 2019 & 2032
- Table 33: Global Oil and Gas Industry in Indonesia Revenue Million Forecast, by Country 2019 & 2032
- Table 34: Global Oil and Gas Industry in Indonesia Volume Thousand Forecast, by Country 2019 & 2032
- Table 35: Brazil Oil and Gas Industry in Indonesia Revenue (Million) Forecast, by Application 2019 & 2032
- Table 36: Brazil Oil and Gas Industry in Indonesia Volume (Thousand) Forecast, by Application 2019 & 2032
- Table 37: Argentina Oil and Gas Industry in Indonesia Revenue (Million) Forecast, by Application 2019 & 2032
- Table 38: Argentina Oil and Gas Industry in Indonesia Volume (Thousand) Forecast, by Application 2019 & 2032
- Table 39: Rest of South America Oil and Gas Industry in Indonesia Revenue (Million) Forecast, by Application 2019 & 2032
- Table 40: Rest of South America Oil and Gas Industry in Indonesia Volume (Thousand) Forecast, by Application 2019 & 2032
- Table 41: Global Oil and Gas Industry in Indonesia Revenue Million Forecast, by Upstream 2019 & 2032
- Table 42: Global Oil and Gas Industry in Indonesia Volume Thousand Forecast, by Upstream 2019 & 2032
- Table 43: Global Oil and Gas Industry in Indonesia Revenue Million Forecast, by Midstream 2019 & 2032
- Table 44: Global Oil and Gas Industry in Indonesia Volume Thousand Forecast, by Midstream 2019 & 2032
- Table 45: Global Oil and Gas Industry in Indonesia Revenue Million Forecast, by Downstream 2019 & 2032
- Table 46: Global Oil and Gas Industry in Indonesia Volume Thousand Forecast, by Downstream 2019 & 2032
- Table 47: Global Oil and Gas Industry in Indonesia Revenue Million Forecast, by Country 2019 & 2032
- Table 48: Global Oil and Gas Industry in Indonesia Volume Thousand Forecast, by Country 2019 & 2032
- Table 49: United Kingdom Oil and Gas Industry in Indonesia Revenue (Million) Forecast, by Application 2019 & 2032
- Table 50: United Kingdom Oil and Gas Industry in Indonesia Volume (Thousand) Forecast, by Application 2019 & 2032
- Table 51: Germany Oil and Gas Industry in Indonesia Revenue (Million) Forecast, by Application 2019 & 2032
- Table 52: Germany Oil and Gas Industry in Indonesia Volume (Thousand) Forecast, by Application 2019 & 2032
- Table 53: France Oil and Gas Industry in Indonesia Revenue (Million) Forecast, by Application 2019 & 2032
- Table 54: France Oil and Gas Industry in Indonesia Volume (Thousand) Forecast, by Application 2019 & 2032
- Table 55: Italy Oil and Gas Industry in Indonesia Revenue (Million) Forecast, by Application 2019 & 2032
- Table 56: Italy Oil and Gas Industry in Indonesia Volume (Thousand) Forecast, by Application 2019 & 2032
- Table 57: Spain Oil and Gas Industry in Indonesia Revenue (Million) Forecast, by Application 2019 & 2032
- Table 58: Spain Oil and Gas Industry in Indonesia Volume (Thousand) Forecast, by Application 2019 & 2032
- Table 59: Russia Oil and Gas Industry in Indonesia Revenue (Million) Forecast, by Application 2019 & 2032
- Table 60: Russia Oil and Gas Industry in Indonesia Volume (Thousand) Forecast, by Application 2019 & 2032
- Table 61: Benelux Oil and Gas Industry in Indonesia Revenue (Million) Forecast, by Application 2019 & 2032
- Table 62: Benelux Oil and Gas Industry in Indonesia Volume (Thousand) Forecast, by Application 2019 & 2032
- Table 63: Nordics Oil and Gas Industry in Indonesia Revenue (Million) Forecast, by Application 2019 & 2032
- Table 64: Nordics Oil and Gas Industry in Indonesia Volume (Thousand) Forecast, by Application 2019 & 2032
- Table 65: Rest of Europe Oil and Gas Industry in Indonesia Revenue (Million) Forecast, by Application 2019 & 2032
- Table 66: Rest of Europe Oil and Gas Industry in Indonesia Volume (Thousand) Forecast, by Application 2019 & 2032
- Table 67: Global Oil and Gas Industry in Indonesia Revenue Million Forecast, by Upstream 2019 & 2032
- Table 68: Global Oil and Gas Industry in Indonesia Volume Thousand Forecast, by Upstream 2019 & 2032
- Table 69: Global Oil and Gas Industry in Indonesia Revenue Million Forecast, by Midstream 2019 & 2032
- Table 70: Global Oil and Gas Industry in Indonesia Volume Thousand Forecast, by Midstream 2019 & 2032
- Table 71: Global Oil and Gas Industry in Indonesia Revenue Million Forecast, by Downstream 2019 & 2032
- Table 72: Global Oil and Gas Industry in Indonesia Volume Thousand Forecast, by Downstream 2019 & 2032
- Table 73: Global Oil and Gas Industry in Indonesia Revenue Million Forecast, by Country 2019 & 2032
- Table 74: Global Oil and Gas Industry in Indonesia Volume Thousand Forecast, by Country 2019 & 2032
- Table 75: Turkey Oil and Gas Industry in Indonesia Revenue (Million) Forecast, by Application 2019 & 2032
- Table 76: Turkey Oil and Gas Industry in Indonesia Volume (Thousand) Forecast, by Application 2019 & 2032
- Table 77: Israel Oil and Gas Industry in Indonesia Revenue (Million) Forecast, by Application 2019 & 2032
- Table 78: Israel Oil and Gas Industry in Indonesia Volume (Thousand) Forecast, by Application 2019 & 2032
- Table 79: GCC Oil and Gas Industry in Indonesia Revenue (Million) Forecast, by Application 2019 & 2032
- Table 80: GCC Oil and Gas Industry in Indonesia Volume (Thousand) Forecast, by Application 2019 & 2032
- Table 81: North Africa Oil and Gas Industry in Indonesia Revenue (Million) Forecast, by Application 2019 & 2032
- Table 82: North Africa Oil and Gas Industry in Indonesia Volume (Thousand) Forecast, by Application 2019 & 2032
- Table 83: South Africa Oil and Gas Industry in Indonesia Revenue (Million) Forecast, by Application 2019 & 2032
- Table 84: South Africa Oil and Gas Industry in Indonesia Volume (Thousand) Forecast, by Application 2019 & 2032
- Table 85: Rest of Middle East & Africa Oil and Gas Industry in Indonesia Revenue (Million) Forecast, by Application 2019 & 2032
- Table 86: Rest of Middle East & Africa Oil and Gas Industry in Indonesia Volume (Thousand) Forecast, by Application 2019 & 2032
- Table 87: Global Oil and Gas Industry in Indonesia Revenue Million Forecast, by Upstream 2019 & 2032
- Table 88: Global Oil and Gas Industry in Indonesia Volume Thousand Forecast, by Upstream 2019 & 2032
- Table 89: Global Oil and Gas Industry in Indonesia Revenue Million Forecast, by Midstream 2019 & 2032
- Table 90: Global Oil and Gas Industry in Indonesia Volume Thousand Forecast, by Midstream 2019 & 2032
- Table 91: Global Oil and Gas Industry in Indonesia Revenue Million Forecast, by Downstream 2019 & 2032
- Table 92: Global Oil and Gas Industry in Indonesia Volume Thousand Forecast, by Downstream 2019 & 2032
- Table 93: Global Oil and Gas Industry in Indonesia Revenue Million Forecast, by Country 2019 & 2032
- Table 94: Global Oil and Gas Industry in Indonesia Volume Thousand Forecast, by Country 2019 & 2032
- Table 95: China Oil and Gas Industry in Indonesia Revenue (Million) Forecast, by Application 2019 & 2032
- Table 96: China Oil and Gas Industry in Indonesia Volume (Thousand) Forecast, by Application 2019 & 2032
- Table 97: India Oil and Gas Industry in Indonesia Revenue (Million) Forecast, by Application 2019 & 2032
- Table 98: India Oil and Gas Industry in Indonesia Volume (Thousand) Forecast, by Application 2019 & 2032
- Table 99: Japan Oil and Gas Industry in Indonesia Revenue (Million) Forecast, by Application 2019 & 2032
- Table 100: Japan Oil and Gas Industry in Indonesia Volume (Thousand) Forecast, by Application 2019 & 2032
- Table 101: South Korea Oil and Gas Industry in Indonesia Revenue (Million) Forecast, by Application 2019 & 2032
- Table 102: South Korea Oil and Gas Industry in Indonesia Volume (Thousand) Forecast, by Application 2019 & 2032
- Table 103: ASEAN Oil and Gas Industry in Indonesia Revenue (Million) Forecast, by Application 2019 & 2032
- Table 104: ASEAN Oil and Gas Industry in Indonesia Volume (Thousand) Forecast, by Application 2019 & 2032
- Table 105: Oceania Oil and Gas Industry in Indonesia Revenue (Million) Forecast, by Application 2019 & 2032
- Table 106: Oceania Oil and Gas Industry in Indonesia Volume (Thousand) Forecast, by Application 2019 & 2032
- Table 107: Rest of Asia Pacific Oil and Gas Industry in Indonesia Revenue (Million) Forecast, by Application 2019 & 2032
- Table 108: Rest of Asia Pacific Oil and Gas Industry in Indonesia Volume (Thousand) Forecast, by Application 2019 & 2032
Frequently Asked Questions
1. What is the projected Compound Annual Growth Rate (CAGR) of the Oil and Gas Industry in Indonesia?
The projected CAGR is approximately 1.60%.
2. Which companies are prominent players in the Oil and Gas Industry in Indonesia?
Key companies in the market include Shell PLC, ConcoPhillips Company, PT Pertamina, PT Perusahaan Gas Negara Tbk, BP PLC*List Not Exhaustive, Chevron Corporation, Petroliam Nasional Berhad, PT Connusa Energindo, ExxonMobil Corporatoin, China National Offshore Oil Corporation.
3. What are the main segments of the Oil and Gas Industry in Indonesia?
The market segments include Upstream, Midstream, Downstream.
4. Can you provide details about the market size?
The market size is estimated to be USD 17500 Million as of 2022.
5. What are some drivers contributing to market growth?
4.; Increasing Demand for Petroleum Products Due to the Growth of the Local Economy4.; Government Initiatives to Boost the Production of Crude Oil and Natural Gas.
6. What are the notable trends driving market growth?
Upstream Sector Expected to Witness Significant Growth.
7. Are there any restraints impacting market growth?
4.; Increasing Adoption of Renewable Energy.
8. Can you provide examples of recent developments in the market?
June 2023: Sembcorp Industries signed a USD 1.41 billion gas sales agreement with Medco Energi International to import gas from an offshore play in Indonesia to Singapore. Gas will be obtained from the West Natuna gas field and dispatched to Singapore through the West Natuna-Singapore gas pipeline.
9. What pricing options are available for accessing the report?
Pricing options include single-user, multi-user, and enterprise licenses priced at USD 3800, USD 4500, and USD 5800 respectively.
10. Is the market size provided in terms of value or volume?
The market size is provided in terms of value, measured in Million and volume, measured in Thousand.
11. Are there any specific market keywords associated with the report?
Yes, the market keyword associated with the report is "Oil and Gas Industry in Indonesia," which aids in identifying and referencing the specific market segment covered.
12. How do I determine which pricing option suits my needs best?
The pricing options vary based on user requirements and access needs. Individual users may opt for single-user licenses, while businesses requiring broader access may choose multi-user or enterprise licenses for cost-effective access to the report.
13. Are there any additional resources or data provided in the Oil and Gas Industry in Indonesia report?
While the report offers comprehensive insights, it's advisable to review the specific contents or supplementary materials provided to ascertain if additional resources or data are available.
14. How can I stay updated on further developments or reports in the Oil and Gas Industry in Indonesia?
To stay informed about further developments, trends, and reports in the Oil and Gas Industry in Indonesia, consider subscribing to industry newsletters, following relevant companies and organizations, or regularly checking reputable industry news sources and publications.
Methodology
Step 1 - Identification of Relevant Samples Size from Population Database


Step 2 - Approaches for Defining Global Market Size (Value, Volume* & Price*)

Note*: In applicable scenarios
Step 3 - Data Sources
Primary Research
- Web Analytics
- Survey Reports
- Research Institute
- Latest Research Reports
- Opinion Leaders
Secondary Research
- Annual Reports
- White Paper
- Latest Press Release
- Industry Association
- Paid Database
- Investor Presentations

Step 4 - Data Triangulation
Involves using different sources of information in order to increase the validity of a study
These sources are likely to be stakeholders in a program - participants, other researchers, program staff, other community members, and so on.
Then we put all data in single framework & apply various statistical tools to find out the dynamic on the market.
During the analysis stage, feedback from the stakeholder groups would be compared to determine areas of agreement as well as areas of divergence


