
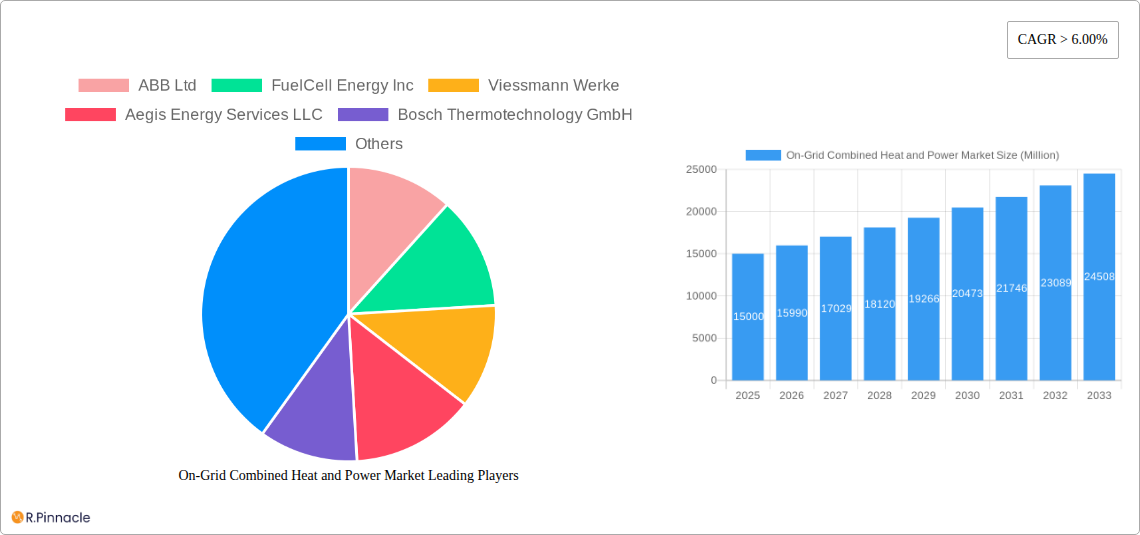
Key Insights
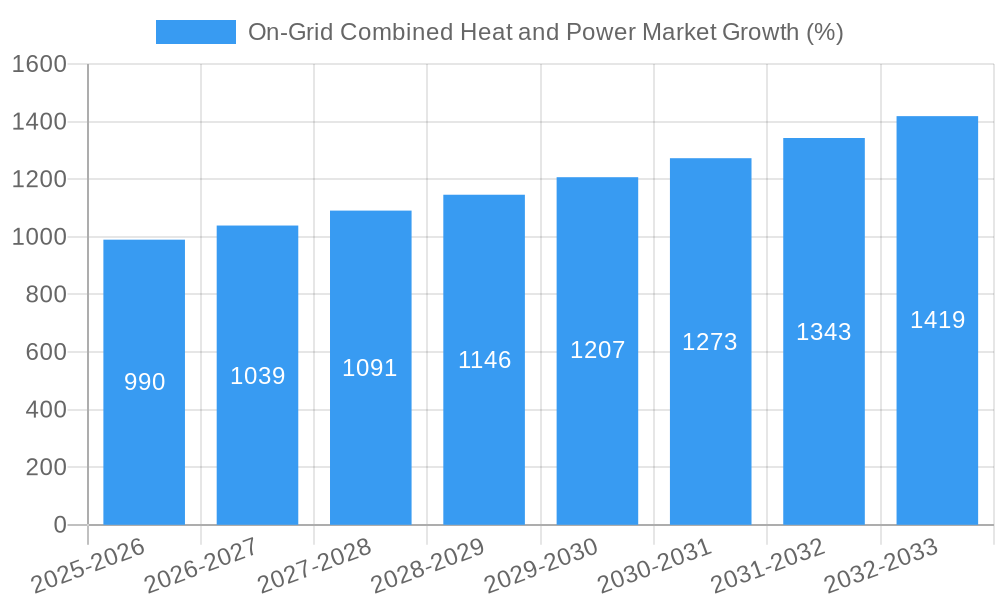
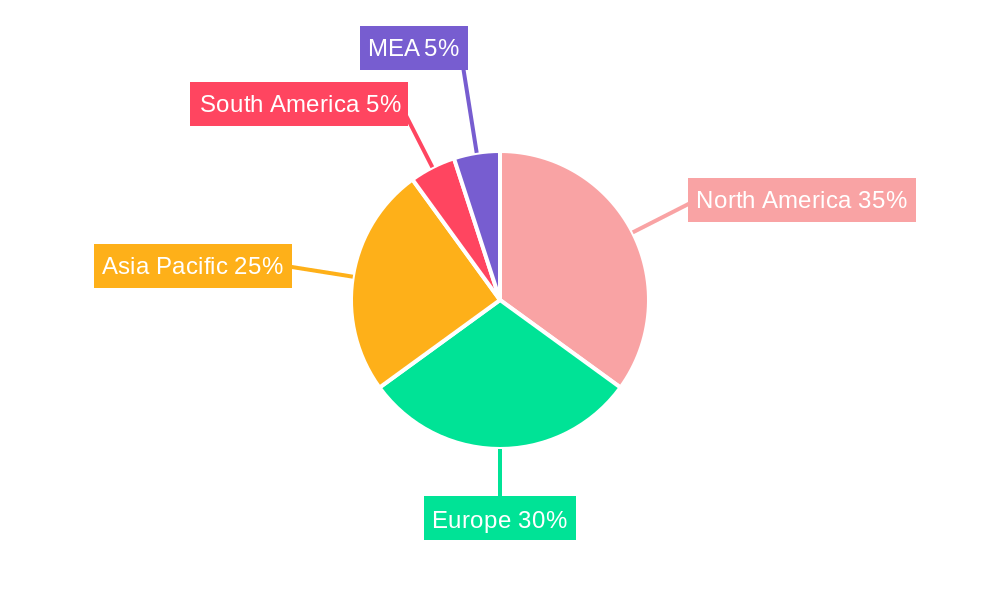
The on-grid combined heat and power (CHP) market is experiencing robust growth, driven by increasing energy demands, stringent environmental regulations promoting energy efficiency, and the rising adoption of decentralized energy solutions. A CAGR exceeding 6% indicates a significant expansion projected through 2033. The market's segmentation reveals strong demand across diverse sectors, including utilities, commercial and industrial facilities, and residential applications. Natural gas currently dominates the fuel type segment, although the growing emphasis on sustainability is fostering increased interest in biomass and other renewable options. Technological advancements in CHP systems are enhancing efficiency and reducing emissions, further propelling market expansion. Geographical analysis points to significant market penetration in North America and Europe, fueled by mature infrastructure and supportive government policies. However, developing regions in Asia Pacific and South America are poised for substantial growth due to increasing industrialization and urbanization, creating opportunities for CHP system deployments. The competitive landscape is characterized by a mix of established players like ABB, Siemens, and General Electric alongside specialized CHP providers like FuelCell Energy and Viessmann. This competitive dynamic encourages innovation and price optimization, benefiting end-users.
The forecast period (2025-2033) presents compelling opportunities for market players. Expansion strategies will likely center on technological innovation, strategic partnerships, and geographical diversification. The increasing integration of CHP systems with smart grids and renewable energy sources represents a significant growth area. Challenges remain, however, including the initial investment costs associated with CHP system installations and the need for consistent regulatory support to incentivize wider adoption. Overcoming these hurdles through targeted financial incentives and enhanced public awareness campaigns will be crucial for unlocking the full potential of the on-grid CHP market and ensuring its sustainable development.
On-Grid Combined Heat and Power Market Report: 2019-2033 Forecast
This comprehensive report provides a detailed analysis of the On-Grid Combined Heat and Power (CHP) market, offering invaluable insights for industry professionals, investors, and strategic decision-makers. Covering the period 2019-2033, with a focus on 2025, this report unveils market dynamics, growth drivers, challenges, and future opportunities. Benefit from in-depth segmentation by application (Utilities, Commercial & Industrial, Residential) and fuel type (Natural Gas, Coal, Oil, Biomass, Other), enabling targeted strategic planning.
On-Grid Combined Heat and Power Market Market Structure & Innovation Trends
This section analyzes the competitive landscape of the On-Grid CHP market, encompassing market concentration, innovation drivers, regulatory frameworks, and M&A activities. The report examines the market share of key players such as ABB Ltd, FuelCell Energy Inc, Viessmann Werke, Aegis Energy Services LLC, Bosch Thermotechnology GmbH, Mitsubishi Electric Corporation, Caterpillar Inc, Siemens AG, Centrica PLC, Wärtsilä Oyj Abp, MAN Diesel & Turbo SE, General Electric Company, and Kawasaki Heavy Industries Ltd. The analysis includes an assessment of the impact of mergers and acquisitions, with estimated deal values exceeding XX Million in the period 2019-2024. Specific metrics detailing market share by company and regional market concentration will be provided. The influence of evolving regulatory frameworks and technological advancements on market structure and innovation will also be explored. The report examines the role of product substitutes and their impact on market dynamics, along with an analysis of end-user demographics and their preferences for different CHP systems.
On-Grid Combined Heat and Power Market Market Dynamics & Trends
This section delves into the key drivers and trends shaping the On-Grid CHP market. The report examines market growth drivers, including increasing energy demand, stringent environmental regulations promoting cleaner energy sources, and the rising adoption of CHP systems in various sectors. A detailed analysis of technological disruptions, such as advancements in fuel cell technology and improved efficiency of CHP systems, will be presented. The impact of consumer preferences, focusing on sustainability and cost-effectiveness, on market growth will also be discussed. The competitive dynamics, including pricing strategies and market penetration rates, will be analyzed, with projected Compound Annual Growth Rates (CAGR) presented for the forecast period (2025-2033). Market penetration will be assessed across different regions and application segments.
Dominant Regions & Segments in On-Grid Combined Heat and Power Market
This section identifies the leading regions and segments within the On-Grid CHP market. The analysis will pinpoint the dominant region(s) and country(ies), along with the most significant application segments (Utilities, Commercial & Industrial, Residential) and fuel types (Natural Gas, Coal, Oil, Biomass, Other Fuel Types). Key drivers influencing the dominance of these regions and segments will be highlighted using bullet points:
- For Dominant Regions: Economic policies supporting renewable energy, existing infrastructure conducive to CHP deployment, government incentives and subsidies.
- For Dominant Segments: High energy consumption in the industrial sector, government regulations mandating energy efficiency improvements, rising demand for decentralized energy generation in residential areas.
Detailed paragraphs will provide in-depth analysis of the factors contributing to the dominance of specific regions and segments. This will include economic factors, infrastructure availability, government regulations, and market size projections.
On-Grid Combined Heat and Power Market Product Innovations
This section summarizes recent product developments and technological advancements in the On-Grid CHP market. It will focus on key innovations, including improved efficiency, reduced emissions, and enhanced system integration, highlighting their competitive advantages and market fit. The analysis will also explore the adoption of smart technologies and digitalization in optimizing CHP system performance and operation.
Report Scope & Segmentation Analysis
This report segments the On-Grid CHP market based on application (Utilities, Commercial and Industrial, Residential) and fuel type (Natural Gas, Coal, Oil, Biomass, Other Fuel Types).
Application: Each application segment's growth projections, market size (in Millions), and competitive dynamics will be analyzed. This includes an assessment of the unique needs and challenges of each sector with regards to CHP implementation.
Fuel Type: A similar analysis, encompassing growth projections, market size (in Millions), and competitive landscape, will be conducted for each fuel type. The report will examine the impact of fuel prices, availability, and environmental regulations on the market share of each fuel type.
Key Drivers of On-Grid Combined Heat and Power Market Growth
Several key factors drive the growth of the On-Grid CHP market. These include increasing energy demand globally, stringent environmental regulations pushing for cleaner energy solutions, and the rising adoption of CHP systems for improved energy efficiency and cost savings. Government incentives and policies supporting renewable energy integration also play a significant role. Technological advancements, leading to higher efficiency and reduced emissions from CHP systems, further stimulate market expansion.
Challenges in the On-Grid Combined Heat and Power Market Sector
The On-Grid CHP market faces several challenges. High initial investment costs for CHP systems can be a barrier to entry for some consumers. Regulatory hurdles and permitting processes can also impede deployment. Fluctuations in fuel prices and supply chain disruptions can impact profitability. Intense competition among established players and new entrants adds further complexity. These challenges, and their quantitative impacts on market growth, will be discussed in detail.
Emerging Opportunities in On-Grid Combined Heat and Power Market
Despite challenges, the On-Grid CHP market presents numerous opportunities. The growth of microgrids and distributed energy resources creates new avenues for CHP deployment. Advancements in fuel cell technology and improved energy storage solutions expand application possibilities. The increasing focus on decarbonization and sustainability in various sectors offers strong potential for market expansion. Emerging markets in developing economies also present significant growth opportunities.
Leading Players in the On-Grid Combined Heat and Power Market Market
- ABB Ltd
- FuelCell Energy Inc
- Viessmann Werke
- Aegis Energy Services LLC
- Bosch Thermotechnology GmbH
- Mitsubishi Electric Corporation
- Caterpillar Inc
- Siemens AG
- Centrica PLC
- Wärtsilä Oyj Abp
- MAN Diesel & Turbo SE
- General Electric Company
- Kawasaki Heavy Industries Ltd
Key Developments in On-Grid Combined Heat and Power Market Industry
- 2023-06: ABB Ltd launches a new high-efficiency CHP system, boosting market competition.
- 2022-11: Siemens AG and FuelCell Energy Inc announce a strategic partnership to develop next-generation CHP technologies.
- 2021-09: New regulations in the EU incentivize CHP adoption, stimulating market growth. (Further key developments with dates and impact assessments will be included in the full report.)
Future Outlook for On-Grid Combined Heat and Power Market Market
The On-Grid CHP market is poised for substantial growth in the coming years, driven by increasing energy demands, stricter environmental regulations, and ongoing technological advancements. The market will witness increased adoption of CHP systems across various sectors. The focus on sustainability and energy efficiency will continue to drive market expansion. Strategic partnerships and collaborations among key players will further accelerate innovation and market penetration. The forecast for 2025-2033 indicates significant market expansion, presenting lucrative opportunities for both established players and new entrants.
On-Grid Combined Heat and Power Market Segmentation
-
1. Application
- 1.1. Utilities
- 1.2. Commercial and Industrial
- 1.3. Residential
-
2. Fuel Type
- 2.1. Natural Gas
- 2.2. Coal
- 2.3. Oil
- 2.4. Biomass
- 2.5. Other Fuel Types
On-Grid Combined Heat and Power Market Segmentation By Geography
- 1. North America
- 2. Europe
- 3. Asia Pacific
- 4. South America
- 5. Middle East
On-Grid Combined Heat and Power Market REPORT HIGHLIGHTS
| Aspects | Details |
|---|---|
| Study Period | 2019-2033 |
| Base Year | 2024 |
| Estimated Year | 2025 |
| Forecast Period | 2025-2033 |
| Historical Period | 2019-2024 |
| Growth Rate | CAGR of > 6.00% from 2019-2033 |
| Segmentation |
|
Table of Contents
- 1. Introduction
- 1.1. Research Scope
- 1.2. Market Segmentation
- 1.3. Research Methodology
- 1.4. Definitions and Assumptions
- 2. Executive Summary
- 2.1. Introduction
- 3. Market Dynamics
- 3.1. Introduction
- 3.2. Market Drivers
- 3.2.1. Supportive Government Policies and Incentives4.; Environmental Concerns
- 3.3. Market Restrains
- 3.3.1. Fossil Fuel Subsidies
- 3.4. Market Trends
- 3.4.1. Biomass Based Combined Heat and Power to Witness a Significant Growth
- 4. Market Factor Analysis
- 4.1. Porters Five Forces
- 4.2. Supply/Value Chain
- 4.3. PESTEL analysis
- 4.4. Market Entropy
- 4.5. Patent/Trademark Analysis
- 5. Global On-Grid Combined Heat and Power Market Analysis, Insights and Forecast, 2019-2031
- 5.1. Market Analysis, Insights and Forecast - by Application
- 5.1.1. Utilities
- 5.1.2. Commercial and Industrial
- 5.1.3. Residential
- 5.2. Market Analysis, Insights and Forecast - by Fuel Type
- 5.2.1. Natural Gas
- 5.2.2. Coal
- 5.2.3. Oil
- 5.2.4. Biomass
- 5.2.5. Other Fuel Types
- 5.3. Market Analysis, Insights and Forecast - by Region
- 5.3.1. North America
- 5.3.2. Europe
- 5.3.3. Asia Pacific
- 5.3.4. South America
- 5.3.5. Middle East
- 5.1. Market Analysis, Insights and Forecast - by Application
- 6. North America On-Grid Combined Heat and Power Market Analysis, Insights and Forecast, 2019-2031
- 6.1. Market Analysis, Insights and Forecast - by Application
- 6.1.1. Utilities
- 6.1.2. Commercial and Industrial
- 6.1.3. Residential
- 6.2. Market Analysis, Insights and Forecast - by Fuel Type
- 6.2.1. Natural Gas
- 6.2.2. Coal
- 6.2.3. Oil
- 6.2.4. Biomass
- 6.2.5. Other Fuel Types
- 6.1. Market Analysis, Insights and Forecast - by Application
- 7. Europe On-Grid Combined Heat and Power Market Analysis, Insights and Forecast, 2019-2031
- 7.1. Market Analysis, Insights and Forecast - by Application
- 7.1.1. Utilities
- 7.1.2. Commercial and Industrial
- 7.1.3. Residential
- 7.2. Market Analysis, Insights and Forecast - by Fuel Type
- 7.2.1. Natural Gas
- 7.2.2. Coal
- 7.2.3. Oil
- 7.2.4. Biomass
- 7.2.5. Other Fuel Types
- 7.1. Market Analysis, Insights and Forecast - by Application
- 8. Asia Pacific On-Grid Combined Heat and Power Market Analysis, Insights and Forecast, 2019-2031
- 8.1. Market Analysis, Insights and Forecast - by Application
- 8.1.1. Utilities
- 8.1.2. Commercial and Industrial
- 8.1.3. Residential
- 8.2. Market Analysis, Insights and Forecast - by Fuel Type
- 8.2.1. Natural Gas
- 8.2.2. Coal
- 8.2.3. Oil
- 8.2.4. Biomass
- 8.2.5. Other Fuel Types
- 8.1. Market Analysis, Insights and Forecast - by Application
- 9. South America On-Grid Combined Heat and Power Market Analysis, Insights and Forecast, 2019-2031
- 9.1. Market Analysis, Insights and Forecast - by Application
- 9.1.1. Utilities
- 9.1.2. Commercial and Industrial
- 9.1.3. Residential
- 9.2. Market Analysis, Insights and Forecast - by Fuel Type
- 9.2.1. Natural Gas
- 9.2.2. Coal
- 9.2.3. Oil
- 9.2.4. Biomass
- 9.2.5. Other Fuel Types
- 9.1. Market Analysis, Insights and Forecast - by Application
- 10. Middle East On-Grid Combined Heat and Power Market Analysis, Insights and Forecast, 2019-2031
- 10.1. Market Analysis, Insights and Forecast - by Application
- 10.1.1. Utilities
- 10.1.2. Commercial and Industrial
- 10.1.3. Residential
- 10.2. Market Analysis, Insights and Forecast - by Fuel Type
- 10.2.1. Natural Gas
- 10.2.2. Coal
- 10.2.3. Oil
- 10.2.4. Biomass
- 10.2.5. Other Fuel Types
- 10.1. Market Analysis, Insights and Forecast - by Application
- 11. North America On-Grid Combined Heat and Power Market Analysis, Insights and Forecast, 2019-2031
- 11.1. Market Analysis, Insights and Forecast - By Country/Sub-region
- 11.1.1 United States
- 11.1.2 Canada
- 11.1.3 Mexico
- 12. Europe On-Grid Combined Heat and Power Market Analysis, Insights and Forecast, 2019-2031
- 12.1. Market Analysis, Insights and Forecast - By Country/Sub-region
- 12.1.1 Germany
- 12.1.2 United Kingdom
- 12.1.3 France
- 12.1.4 Spain
- 12.1.5 Italy
- 12.1.6 Spain
- 12.1.7 Belgium
- 12.1.8 Netherland
- 12.1.9 Nordics
- 12.1.10 Rest of Europe
- 13. Asia Pacific On-Grid Combined Heat and Power Market Analysis, Insights and Forecast, 2019-2031
- 13.1. Market Analysis, Insights and Forecast - By Country/Sub-region
- 13.1.1 China
- 13.1.2 Japan
- 13.1.3 India
- 13.1.4 South Korea
- 13.1.5 Southeast Asia
- 13.1.6 Australia
- 13.1.7 Indonesia
- 13.1.8 Phillipes
- 13.1.9 Singapore
- 13.1.10 Thailandc
- 13.1.11 Rest of Asia Pacific
- 14. South America On-Grid Combined Heat and Power Market Analysis, Insights and Forecast, 2019-2031
- 14.1. Market Analysis, Insights and Forecast - By Country/Sub-region
- 14.1.1 Brazil
- 14.1.2 Argentina
- 14.1.3 Peru
- 14.1.4 Chile
- 14.1.5 Colombia
- 14.1.6 Ecuador
- 14.1.7 Venezuela
- 14.1.8 Rest of South America
- 15. MEA On-Grid Combined Heat and Power Market Analysis, Insights and Forecast, 2019-2031
- 15.1. Market Analysis, Insights and Forecast - By Country/Sub-region
- 15.1.1 United Arab Emirates
- 15.1.2 Saudi Arabia
- 15.1.3 South Africa
- 15.1.4 Rest of Middle East and Africa
- 16. Competitive Analysis
- 16.1. Global Market Share Analysis 2024
- 16.2. Company Profiles
- 16.2.1 ABB Ltd
- 16.2.1.1. Overview
- 16.2.1.2. Products
- 16.2.1.3. SWOT Analysis
- 16.2.1.4. Recent Developments
- 16.2.1.5. Financials (Based on Availability)
- 16.2.2 FuelCell Energy Inc
- 16.2.2.1. Overview
- 16.2.2.2. Products
- 16.2.2.3. SWOT Analysis
- 16.2.2.4. Recent Developments
- 16.2.2.5. Financials (Based on Availability)
- 16.2.3 Viessmann Werke
- 16.2.3.1. Overview
- 16.2.3.2. Products
- 16.2.3.3. SWOT Analysis
- 16.2.3.4. Recent Developments
- 16.2.3.5. Financials (Based on Availability)
- 16.2.4 Aegis Energy Services LLC
- 16.2.4.1. Overview
- 16.2.4.2. Products
- 16.2.4.3. SWOT Analysis
- 16.2.4.4. Recent Developments
- 16.2.4.5. Financials (Based on Availability)
- 16.2.5 Bosch Thermotechnology GmbH
- 16.2.5.1. Overview
- 16.2.5.2. Products
- 16.2.5.3. SWOT Analysis
- 16.2.5.4. Recent Developments
- 16.2.5.5. Financials (Based on Availability)
- 16.2.6 Mitsubishi Electric Corporation
- 16.2.6.1. Overview
- 16.2.6.2. Products
- 16.2.6.3. SWOT Analysis
- 16.2.6.4. Recent Developments
- 16.2.6.5. Financials (Based on Availability)
- 16.2.7 Caterpillar Inc
- 16.2.7.1. Overview
- 16.2.7.2. Products
- 16.2.7.3. SWOT Analysis
- 16.2.7.4. Recent Developments
- 16.2.7.5. Financials (Based on Availability)
- 16.2.8 Seimens AG
- 16.2.8.1. Overview
- 16.2.8.2. Products
- 16.2.8.3. SWOT Analysis
- 16.2.8.4. Recent Developments
- 16.2.8.5. Financials (Based on Availability)
- 16.2.9 Centrica PLC
- 16.2.9.1. Overview
- 16.2.9.2. Products
- 16.2.9.3. SWOT Analysis
- 16.2.9.4. Recent Developments
- 16.2.9.5. Financials (Based on Availability)
- 16.2.10 Wartsila Oyj Abp
- 16.2.10.1. Overview
- 16.2.10.2. Products
- 16.2.10.3. SWOT Analysis
- 16.2.10.4. Recent Developments
- 16.2.10.5. Financials (Based on Availability)
- 16.2.11 MAN Diesel & Turbo SE
- 16.2.11.1. Overview
- 16.2.11.2. Products
- 16.2.11.3. SWOT Analysis
- 16.2.11.4. Recent Developments
- 16.2.11.5. Financials (Based on Availability)
- 16.2.12 General Electric Company
- 16.2.12.1. Overview
- 16.2.12.2. Products
- 16.2.12.3. SWOT Analysis
- 16.2.12.4. Recent Developments
- 16.2.12.5. Financials (Based on Availability)
- 16.2.13 Kawasaki Heavy Industries Ltd
- 16.2.13.1. Overview
- 16.2.13.2. Products
- 16.2.13.3. SWOT Analysis
- 16.2.13.4. Recent Developments
- 16.2.13.5. Financials (Based on Availability)
- 16.2.1 ABB Ltd
List of Figures
- Figure 1: Global On-Grid Combined Heat and Power Market Revenue Breakdown (Million, %) by Region 2024 & 2032
- Figure 2: Global On-Grid Combined Heat and Power Market Volume Breakdown (Gigawatt, %) by Region 2024 & 2032
- Figure 3: North America On-Grid Combined Heat and Power Market Revenue (Million), by Country 2024 & 2032
- Figure 4: North America On-Grid Combined Heat and Power Market Volume (Gigawatt), by Country 2024 & 2032
- Figure 5: North America On-Grid Combined Heat and Power Market Revenue Share (%), by Country 2024 & 2032
- Figure 6: North America On-Grid Combined Heat and Power Market Volume Share (%), by Country 2024 & 2032
- Figure 7: Europe On-Grid Combined Heat and Power Market Revenue (Million), by Country 2024 & 2032
- Figure 8: Europe On-Grid Combined Heat and Power Market Volume (Gigawatt), by Country 2024 & 2032
- Figure 9: Europe On-Grid Combined Heat and Power Market Revenue Share (%), by Country 2024 & 2032
- Figure 10: Europe On-Grid Combined Heat and Power Market Volume Share (%), by Country 2024 & 2032
- Figure 11: Asia Pacific On-Grid Combined Heat and Power Market Revenue (Million), by Country 2024 & 2032
- Figure 12: Asia Pacific On-Grid Combined Heat and Power Market Volume (Gigawatt), by Country 2024 & 2032
- Figure 13: Asia Pacific On-Grid Combined Heat and Power Market Revenue Share (%), by Country 2024 & 2032
- Figure 14: Asia Pacific On-Grid Combined Heat and Power Market Volume Share (%), by Country 2024 & 2032
- Figure 15: South America On-Grid Combined Heat and Power Market Revenue (Million), by Country 2024 & 2032
- Figure 16: South America On-Grid Combined Heat and Power Market Volume (Gigawatt), by Country 2024 & 2032
- Figure 17: South America On-Grid Combined Heat and Power Market Revenue Share (%), by Country 2024 & 2032
- Figure 18: South America On-Grid Combined Heat and Power Market Volume Share (%), by Country 2024 & 2032
- Figure 19: MEA On-Grid Combined Heat and Power Market Revenue (Million), by Country 2024 & 2032
- Figure 20: MEA On-Grid Combined Heat and Power Market Volume (Gigawatt), by Country 2024 & 2032
- Figure 21: MEA On-Grid Combined Heat and Power Market Revenue Share (%), by Country 2024 & 2032
- Figure 22: MEA On-Grid Combined Heat and Power Market Volume Share (%), by Country 2024 & 2032
- Figure 23: North America On-Grid Combined Heat and Power Market Revenue (Million), by Application 2024 & 2032
- Figure 24: North America On-Grid Combined Heat and Power Market Volume (Gigawatt), by Application 2024 & 2032
- Figure 25: North America On-Grid Combined Heat and Power Market Revenue Share (%), by Application 2024 & 2032
- Figure 26: North America On-Grid Combined Heat and Power Market Volume Share (%), by Application 2024 & 2032
- Figure 27: North America On-Grid Combined Heat and Power Market Revenue (Million), by Fuel Type 2024 & 2032
- Figure 28: North America On-Grid Combined Heat and Power Market Volume (Gigawatt), by Fuel Type 2024 & 2032
- Figure 29: North America On-Grid Combined Heat and Power Market Revenue Share (%), by Fuel Type 2024 & 2032
- Figure 30: North America On-Grid Combined Heat and Power Market Volume Share (%), by Fuel Type 2024 & 2032
- Figure 31: North America On-Grid Combined Heat and Power Market Revenue (Million), by Country 2024 & 2032
- Figure 32: North America On-Grid Combined Heat and Power Market Volume (Gigawatt), by Country 2024 & 2032
- Figure 33: North America On-Grid Combined Heat and Power Market Revenue Share (%), by Country 2024 & 2032
- Figure 34: North America On-Grid Combined Heat and Power Market Volume Share (%), by Country 2024 & 2032
- Figure 35: Europe On-Grid Combined Heat and Power Market Revenue (Million), by Application 2024 & 2032
- Figure 36: Europe On-Grid Combined Heat and Power Market Volume (Gigawatt), by Application 2024 & 2032
- Figure 37: Europe On-Grid Combined Heat and Power Market Revenue Share (%), by Application 2024 & 2032
- Figure 38: Europe On-Grid Combined Heat and Power Market Volume Share (%), by Application 2024 & 2032
- Figure 39: Europe On-Grid Combined Heat and Power Market Revenue (Million), by Fuel Type 2024 & 2032
- Figure 40: Europe On-Grid Combined Heat and Power Market Volume (Gigawatt), by Fuel Type 2024 & 2032
- Figure 41: Europe On-Grid Combined Heat and Power Market Revenue Share (%), by Fuel Type 2024 & 2032
- Figure 42: Europe On-Grid Combined Heat and Power Market Volume Share (%), by Fuel Type 2024 & 2032
- Figure 43: Europe On-Grid Combined Heat and Power Market Revenue (Million), by Country 2024 & 2032
- Figure 44: Europe On-Grid Combined Heat and Power Market Volume (Gigawatt), by Country 2024 & 2032
- Figure 45: Europe On-Grid Combined Heat and Power Market Revenue Share (%), by Country 2024 & 2032
- Figure 46: Europe On-Grid Combined Heat and Power Market Volume Share (%), by Country 2024 & 2032
- Figure 47: Asia Pacific On-Grid Combined Heat and Power Market Revenue (Million), by Application 2024 & 2032
- Figure 48: Asia Pacific On-Grid Combined Heat and Power Market Volume (Gigawatt), by Application 2024 & 2032
- Figure 49: Asia Pacific On-Grid Combined Heat and Power Market Revenue Share (%), by Application 2024 & 2032
- Figure 50: Asia Pacific On-Grid Combined Heat and Power Market Volume Share (%), by Application 2024 & 2032
- Figure 51: Asia Pacific On-Grid Combined Heat and Power Market Revenue (Million), by Fuel Type 2024 & 2032
- Figure 52: Asia Pacific On-Grid Combined Heat and Power Market Volume (Gigawatt), by Fuel Type 2024 & 2032
- Figure 53: Asia Pacific On-Grid Combined Heat and Power Market Revenue Share (%), by Fuel Type 2024 & 2032
- Figure 54: Asia Pacific On-Grid Combined Heat and Power Market Volume Share (%), by Fuel Type 2024 & 2032
- Figure 55: Asia Pacific On-Grid Combined Heat and Power Market Revenue (Million), by Country 2024 & 2032
- Figure 56: Asia Pacific On-Grid Combined Heat and Power Market Volume (Gigawatt), by Country 2024 & 2032
- Figure 57: Asia Pacific On-Grid Combined Heat and Power Market Revenue Share (%), by Country 2024 & 2032
- Figure 58: Asia Pacific On-Grid Combined Heat and Power Market Volume Share (%), by Country 2024 & 2032
- Figure 59: South America On-Grid Combined Heat and Power Market Revenue (Million), by Application 2024 & 2032
- Figure 60: South America On-Grid Combined Heat and Power Market Volume (Gigawatt), by Application 2024 & 2032
- Figure 61: South America On-Grid Combined Heat and Power Market Revenue Share (%), by Application 2024 & 2032
- Figure 62: South America On-Grid Combined Heat and Power Market Volume Share (%), by Application 2024 & 2032
- Figure 63: South America On-Grid Combined Heat and Power Market Revenue (Million), by Fuel Type 2024 & 2032
- Figure 64: South America On-Grid Combined Heat and Power Market Volume (Gigawatt), by Fuel Type 2024 & 2032
- Figure 65: South America On-Grid Combined Heat and Power Market Revenue Share (%), by Fuel Type 2024 & 2032
- Figure 66: South America On-Grid Combined Heat and Power Market Volume Share (%), by Fuel Type 2024 & 2032
- Figure 67: South America On-Grid Combined Heat and Power Market Revenue (Million), by Country 2024 & 2032
- Figure 68: South America On-Grid Combined Heat and Power Market Volume (Gigawatt), by Country 2024 & 2032
- Figure 69: South America On-Grid Combined Heat and Power Market Revenue Share (%), by Country 2024 & 2032
- Figure 70: South America On-Grid Combined Heat and Power Market Volume Share (%), by Country 2024 & 2032
- Figure 71: Middle East On-Grid Combined Heat and Power Market Revenue (Million), by Application 2024 & 2032
- Figure 72: Middle East On-Grid Combined Heat and Power Market Volume (Gigawatt), by Application 2024 & 2032
- Figure 73: Middle East On-Grid Combined Heat and Power Market Revenue Share (%), by Application 2024 & 2032
- Figure 74: Middle East On-Grid Combined Heat and Power Market Volume Share (%), by Application 2024 & 2032
- Figure 75: Middle East On-Grid Combined Heat and Power Market Revenue (Million), by Fuel Type 2024 & 2032
- Figure 76: Middle East On-Grid Combined Heat and Power Market Volume (Gigawatt), by Fuel Type 2024 & 2032
- Figure 77: Middle East On-Grid Combined Heat and Power Market Revenue Share (%), by Fuel Type 2024 & 2032
- Figure 78: Middle East On-Grid Combined Heat and Power Market Volume Share (%), by Fuel Type 2024 & 2032
- Figure 79: Middle East On-Grid Combined Heat and Power Market Revenue (Million), by Country 2024 & 2032
- Figure 80: Middle East On-Grid Combined Heat and Power Market Volume (Gigawatt), by Country 2024 & 2032
- Figure 81: Middle East On-Grid Combined Heat and Power Market Revenue Share (%), by Country 2024 & 2032
- Figure 82: Middle East On-Grid Combined Heat and Power Market Volume Share (%), by Country 2024 & 2032
List of Tables
- Table 1: Global On-Grid Combined Heat and Power Market Revenue Million Forecast, by Region 2019 & 2032
- Table 2: Global On-Grid Combined Heat and Power Market Volume Gigawatt Forecast, by Region 2019 & 2032
- Table 3: Global On-Grid Combined Heat and Power Market Revenue Million Forecast, by Application 2019 & 2032
- Table 4: Global On-Grid Combined Heat and Power Market Volume Gigawatt Forecast, by Application 2019 & 2032
- Table 5: Global On-Grid Combined Heat and Power Market Revenue Million Forecast, by Fuel Type 2019 & 2032
- Table 6: Global On-Grid Combined Heat and Power Market Volume Gigawatt Forecast, by Fuel Type 2019 & 2032
- Table 7: Global On-Grid Combined Heat and Power Market Revenue Million Forecast, by Region 2019 & 2032
- Table 8: Global On-Grid Combined Heat and Power Market Volume Gigawatt Forecast, by Region 2019 & 2032
- Table 9: Global On-Grid Combined Heat and Power Market Revenue Million Forecast, by Country 2019 & 2032
- Table 10: Global On-Grid Combined Heat and Power Market Volume Gigawatt Forecast, by Country 2019 & 2032
- Table 11: United States On-Grid Combined Heat and Power Market Revenue (Million) Forecast, by Application 2019 & 2032
- Table 12: United States On-Grid Combined Heat and Power Market Volume (Gigawatt) Forecast, by Application 2019 & 2032
- Table 13: Canada On-Grid Combined Heat and Power Market Revenue (Million) Forecast, by Application 2019 & 2032
- Table 14: Canada On-Grid Combined Heat and Power Market Volume (Gigawatt) Forecast, by Application 2019 & 2032
- Table 15: Mexico On-Grid Combined Heat and Power Market Revenue (Million) Forecast, by Application 2019 & 2032
- Table 16: Mexico On-Grid Combined Heat and Power Market Volume (Gigawatt) Forecast, by Application 2019 & 2032
- Table 17: Global On-Grid Combined Heat and Power Market Revenue Million Forecast, by Country 2019 & 2032
- Table 18: Global On-Grid Combined Heat and Power Market Volume Gigawatt Forecast, by Country 2019 & 2032
- Table 19: Germany On-Grid Combined Heat and Power Market Revenue (Million) Forecast, by Application 2019 & 2032
- Table 20: Germany On-Grid Combined Heat and Power Market Volume (Gigawatt) Forecast, by Application 2019 & 2032
- Table 21: United Kingdom On-Grid Combined Heat and Power Market Revenue (Million) Forecast, by Application 2019 & 2032
- Table 22: United Kingdom On-Grid Combined Heat and Power Market Volume (Gigawatt) Forecast, by Application 2019 & 2032
- Table 23: France On-Grid Combined Heat and Power Market Revenue (Million) Forecast, by Application 2019 & 2032
- Table 24: France On-Grid Combined Heat and Power Market Volume (Gigawatt) Forecast, by Application 2019 & 2032
- Table 25: Spain On-Grid Combined Heat and Power Market Revenue (Million) Forecast, by Application 2019 & 2032
- Table 26: Spain On-Grid Combined Heat and Power Market Volume (Gigawatt) Forecast, by Application 2019 & 2032
- Table 27: Italy On-Grid Combined Heat and Power Market Revenue (Million) Forecast, by Application 2019 & 2032
- Table 28: Italy On-Grid Combined Heat and Power Market Volume (Gigawatt) Forecast, by Application 2019 & 2032
- Table 29: Spain On-Grid Combined Heat and Power Market Revenue (Million) Forecast, by Application 2019 & 2032
- Table 30: Spain On-Grid Combined Heat and Power Market Volume (Gigawatt) Forecast, by Application 2019 & 2032
- Table 31: Belgium On-Grid Combined Heat and Power Market Revenue (Million) Forecast, by Application 2019 & 2032
- Table 32: Belgium On-Grid Combined Heat and Power Market Volume (Gigawatt) Forecast, by Application 2019 & 2032
- Table 33: Netherland On-Grid Combined Heat and Power Market Revenue (Million) Forecast, by Application 2019 & 2032
- Table 34: Netherland On-Grid Combined Heat and Power Market Volume (Gigawatt) Forecast, by Application 2019 & 2032
- Table 35: Nordics On-Grid Combined Heat and Power Market Revenue (Million) Forecast, by Application 2019 & 2032
- Table 36: Nordics On-Grid Combined Heat and Power Market Volume (Gigawatt) Forecast, by Application 2019 & 2032
- Table 37: Rest of Europe On-Grid Combined Heat and Power Market Revenue (Million) Forecast, by Application 2019 & 2032
- Table 38: Rest of Europe On-Grid Combined Heat and Power Market Volume (Gigawatt) Forecast, by Application 2019 & 2032
- Table 39: Global On-Grid Combined Heat and Power Market Revenue Million Forecast, by Country 2019 & 2032
- Table 40: Global On-Grid Combined Heat and Power Market Volume Gigawatt Forecast, by Country 2019 & 2032
- Table 41: China On-Grid Combined Heat and Power Market Revenue (Million) Forecast, by Application 2019 & 2032
- Table 42: China On-Grid Combined Heat and Power Market Volume (Gigawatt) Forecast, by Application 2019 & 2032
- Table 43: Japan On-Grid Combined Heat and Power Market Revenue (Million) Forecast, by Application 2019 & 2032
- Table 44: Japan On-Grid Combined Heat and Power Market Volume (Gigawatt) Forecast, by Application 2019 & 2032
- Table 45: India On-Grid Combined Heat and Power Market Revenue (Million) Forecast, by Application 2019 & 2032
- Table 46: India On-Grid Combined Heat and Power Market Volume (Gigawatt) Forecast, by Application 2019 & 2032
- Table 47: South Korea On-Grid Combined Heat and Power Market Revenue (Million) Forecast, by Application 2019 & 2032
- Table 48: South Korea On-Grid Combined Heat and Power Market Volume (Gigawatt) Forecast, by Application 2019 & 2032
- Table 49: Southeast Asia On-Grid Combined Heat and Power Market Revenue (Million) Forecast, by Application 2019 & 2032
- Table 50: Southeast Asia On-Grid Combined Heat and Power Market Volume (Gigawatt) Forecast, by Application 2019 & 2032
- Table 51: Australia On-Grid Combined Heat and Power Market Revenue (Million) Forecast, by Application 2019 & 2032
- Table 52: Australia On-Grid Combined Heat and Power Market Volume (Gigawatt) Forecast, by Application 2019 & 2032
- Table 53: Indonesia On-Grid Combined Heat and Power Market Revenue (Million) Forecast, by Application 2019 & 2032
- Table 54: Indonesia On-Grid Combined Heat and Power Market Volume (Gigawatt) Forecast, by Application 2019 & 2032
- Table 55: Phillipes On-Grid Combined Heat and Power Market Revenue (Million) Forecast, by Application 2019 & 2032
- Table 56: Phillipes On-Grid Combined Heat and Power Market Volume (Gigawatt) Forecast, by Application 2019 & 2032
- Table 57: Singapore On-Grid Combined Heat and Power Market Revenue (Million) Forecast, by Application 2019 & 2032
- Table 58: Singapore On-Grid Combined Heat and Power Market Volume (Gigawatt) Forecast, by Application 2019 & 2032
- Table 59: Thailandc On-Grid Combined Heat and Power Market Revenue (Million) Forecast, by Application 2019 & 2032
- Table 60: Thailandc On-Grid Combined Heat and Power Market Volume (Gigawatt) Forecast, by Application 2019 & 2032
- Table 61: Rest of Asia Pacific On-Grid Combined Heat and Power Market Revenue (Million) Forecast, by Application 2019 & 2032
- Table 62: Rest of Asia Pacific On-Grid Combined Heat and Power Market Volume (Gigawatt) Forecast, by Application 2019 & 2032
- Table 63: Global On-Grid Combined Heat and Power Market Revenue Million Forecast, by Country 2019 & 2032
- Table 64: Global On-Grid Combined Heat and Power Market Volume Gigawatt Forecast, by Country 2019 & 2032
- Table 65: Brazil On-Grid Combined Heat and Power Market Revenue (Million) Forecast, by Application 2019 & 2032
- Table 66: Brazil On-Grid Combined Heat and Power Market Volume (Gigawatt) Forecast, by Application 2019 & 2032
- Table 67: Argentina On-Grid Combined Heat and Power Market Revenue (Million) Forecast, by Application 2019 & 2032
- Table 68: Argentina On-Grid Combined Heat and Power Market Volume (Gigawatt) Forecast, by Application 2019 & 2032
- Table 69: Peru On-Grid Combined Heat and Power Market Revenue (Million) Forecast, by Application 2019 & 2032
- Table 70: Peru On-Grid Combined Heat and Power Market Volume (Gigawatt) Forecast, by Application 2019 & 2032
- Table 71: Chile On-Grid Combined Heat and Power Market Revenue (Million) Forecast, by Application 2019 & 2032
- Table 72: Chile On-Grid Combined Heat and Power Market Volume (Gigawatt) Forecast, by Application 2019 & 2032
- Table 73: Colombia On-Grid Combined Heat and Power Market Revenue (Million) Forecast, by Application 2019 & 2032
- Table 74: Colombia On-Grid Combined Heat and Power Market Volume (Gigawatt) Forecast, by Application 2019 & 2032
- Table 75: Ecuador On-Grid Combined Heat and Power Market Revenue (Million) Forecast, by Application 2019 & 2032
- Table 76: Ecuador On-Grid Combined Heat and Power Market Volume (Gigawatt) Forecast, by Application 2019 & 2032
- Table 77: Venezuela On-Grid Combined Heat and Power Market Revenue (Million) Forecast, by Application 2019 & 2032
- Table 78: Venezuela On-Grid Combined Heat and Power Market Volume (Gigawatt) Forecast, by Application 2019 & 2032
- Table 79: Rest of South America On-Grid Combined Heat and Power Market Revenue (Million) Forecast, by Application 2019 & 2032
- Table 80: Rest of South America On-Grid Combined Heat and Power Market Volume (Gigawatt) Forecast, by Application 2019 & 2032
- Table 81: Global On-Grid Combined Heat and Power Market Revenue Million Forecast, by Country 2019 & 2032
- Table 82: Global On-Grid Combined Heat and Power Market Volume Gigawatt Forecast, by Country 2019 & 2032
- Table 83: United Arab Emirates On-Grid Combined Heat and Power Market Revenue (Million) Forecast, by Application 2019 & 2032
- Table 84: United Arab Emirates On-Grid Combined Heat and Power Market Volume (Gigawatt) Forecast, by Application 2019 & 2032
- Table 85: Saudi Arabia On-Grid Combined Heat and Power Market Revenue (Million) Forecast, by Application 2019 & 2032
- Table 86: Saudi Arabia On-Grid Combined Heat and Power Market Volume (Gigawatt) Forecast, by Application 2019 & 2032
- Table 87: South Africa On-Grid Combined Heat and Power Market Revenue (Million) Forecast, by Application 2019 & 2032
- Table 88: South Africa On-Grid Combined Heat and Power Market Volume (Gigawatt) Forecast, by Application 2019 & 2032
- Table 89: Rest of Middle East and Africa On-Grid Combined Heat and Power Market Revenue (Million) Forecast, by Application 2019 & 2032
- Table 90: Rest of Middle East and Africa On-Grid Combined Heat and Power Market Volume (Gigawatt) Forecast, by Application 2019 & 2032
- Table 91: Global On-Grid Combined Heat and Power Market Revenue Million Forecast, by Application 2019 & 2032
- Table 92: Global On-Grid Combined Heat and Power Market Volume Gigawatt Forecast, by Application 2019 & 2032
- Table 93: Global On-Grid Combined Heat and Power Market Revenue Million Forecast, by Fuel Type 2019 & 2032
- Table 94: Global On-Grid Combined Heat and Power Market Volume Gigawatt Forecast, by Fuel Type 2019 & 2032
- Table 95: Global On-Grid Combined Heat and Power Market Revenue Million Forecast, by Country 2019 & 2032
- Table 96: Global On-Grid Combined Heat and Power Market Volume Gigawatt Forecast, by Country 2019 & 2032
- Table 97: Global On-Grid Combined Heat and Power Market Revenue Million Forecast, by Application 2019 & 2032
- Table 98: Global On-Grid Combined Heat and Power Market Volume Gigawatt Forecast, by Application 2019 & 2032
- Table 99: Global On-Grid Combined Heat and Power Market Revenue Million Forecast, by Fuel Type 2019 & 2032
- Table 100: Global On-Grid Combined Heat and Power Market Volume Gigawatt Forecast, by Fuel Type 2019 & 2032
- Table 101: Global On-Grid Combined Heat and Power Market Revenue Million Forecast, by Country 2019 & 2032
- Table 102: Global On-Grid Combined Heat and Power Market Volume Gigawatt Forecast, by Country 2019 & 2032
- Table 103: Global On-Grid Combined Heat and Power Market Revenue Million Forecast, by Application 2019 & 2032
- Table 104: Global On-Grid Combined Heat and Power Market Volume Gigawatt Forecast, by Application 2019 & 2032
- Table 105: Global On-Grid Combined Heat and Power Market Revenue Million Forecast, by Fuel Type 2019 & 2032
- Table 106: Global On-Grid Combined Heat and Power Market Volume Gigawatt Forecast, by Fuel Type 2019 & 2032
- Table 107: Global On-Grid Combined Heat and Power Market Revenue Million Forecast, by Country 2019 & 2032
- Table 108: Global On-Grid Combined Heat and Power Market Volume Gigawatt Forecast, by Country 2019 & 2032
- Table 109: Global On-Grid Combined Heat and Power Market Revenue Million Forecast, by Application 2019 & 2032
- Table 110: Global On-Grid Combined Heat and Power Market Volume Gigawatt Forecast, by Application 2019 & 2032
- Table 111: Global On-Grid Combined Heat and Power Market Revenue Million Forecast, by Fuel Type 2019 & 2032
- Table 112: Global On-Grid Combined Heat and Power Market Volume Gigawatt Forecast, by Fuel Type 2019 & 2032
- Table 113: Global On-Grid Combined Heat and Power Market Revenue Million Forecast, by Country 2019 & 2032
- Table 114: Global On-Grid Combined Heat and Power Market Volume Gigawatt Forecast, by Country 2019 & 2032
- Table 115: Global On-Grid Combined Heat and Power Market Revenue Million Forecast, by Application 2019 & 2032
- Table 116: Global On-Grid Combined Heat and Power Market Volume Gigawatt Forecast, by Application 2019 & 2032
- Table 117: Global On-Grid Combined Heat and Power Market Revenue Million Forecast, by Fuel Type 2019 & 2032
- Table 118: Global On-Grid Combined Heat and Power Market Volume Gigawatt Forecast, by Fuel Type 2019 & 2032
- Table 119: Global On-Grid Combined Heat and Power Market Revenue Million Forecast, by Country 2019 & 2032
- Table 120: Global On-Grid Combined Heat and Power Market Volume Gigawatt Forecast, by Country 2019 & 2032
Frequently Asked Questions
1. What is the projected Compound Annual Growth Rate (CAGR) of the On-Grid Combined Heat and Power Market?
The projected CAGR is approximately > 6.00%.
2. Which companies are prominent players in the On-Grid Combined Heat and Power Market?
Key companies in the market include ABB Ltd, FuelCell Energy Inc, Viessmann Werke, Aegis Energy Services LLC, Bosch Thermotechnology GmbH, Mitsubishi Electric Corporation, Caterpillar Inc, Seimens AG, Centrica PLC, Wartsila Oyj Abp, MAN Diesel & Turbo SE, General Electric Company, Kawasaki Heavy Industries Ltd.
3. What are the main segments of the On-Grid Combined Heat and Power Market?
The market segments include Application, Fuel Type.
4. Can you provide details about the market size?
The market size is estimated to be USD XX Million as of 2022.
5. What are some drivers contributing to market growth?
Supportive Government Policies and Incentives4.; Environmental Concerns.
6. What are the notable trends driving market growth?
Biomass Based Combined Heat and Power to Witness a Significant Growth.
7. Are there any restraints impacting market growth?
Fossil Fuel Subsidies.
8. Can you provide examples of recent developments in the market?
N/A
9. What pricing options are available for accessing the report?
Pricing options include single-user, multi-user, and enterprise licenses priced at USD 4750, USD 5250, and USD 8750 respectively.
10. Is the market size provided in terms of value or volume?
The market size is provided in terms of value, measured in Million and volume, measured in Gigawatt.
11. Are there any specific market keywords associated with the report?
Yes, the market keyword associated with the report is "On-Grid Combined Heat and Power Market," which aids in identifying and referencing the specific market segment covered.
12. How do I determine which pricing option suits my needs best?
The pricing options vary based on user requirements and access needs. Individual users may opt for single-user licenses, while businesses requiring broader access may choose multi-user or enterprise licenses for cost-effective access to the report.
13. Are there any additional resources or data provided in the On-Grid Combined Heat and Power Market report?
While the report offers comprehensive insights, it's advisable to review the specific contents or supplementary materials provided to ascertain if additional resources or data are available.
14. How can I stay updated on further developments or reports in the On-Grid Combined Heat and Power Market?
To stay informed about further developments, trends, and reports in the On-Grid Combined Heat and Power Market, consider subscribing to industry newsletters, following relevant companies and organizations, or regularly checking reputable industry news sources and publications.
Methodology
Step 1 - Identification of Relevant Samples Size from Population Database


Step 2 - Approaches for Defining Global Market Size (Value, Volume* & Price*)

Note*: In applicable scenarios
Step 3 - Data Sources
Primary Research
- Web Analytics
- Survey Reports
- Research Institute
- Latest Research Reports
- Opinion Leaders
Secondary Research
- Annual Reports
- White Paper
- Latest Press Release
- Industry Association
- Paid Database
- Investor Presentations

Step 4 - Data Triangulation
Involves using different sources of information in order to increase the validity of a study
These sources are likely to be stakeholders in a program - participants, other researchers, program staff, other community members, and so on.
Then we put all data in single framework & apply various statistical tools to find out the dynamic on the market.
During the analysis stage, feedback from the stakeholder groups would be compared to determine areas of agreement as well as areas of divergence


