
Key Insights
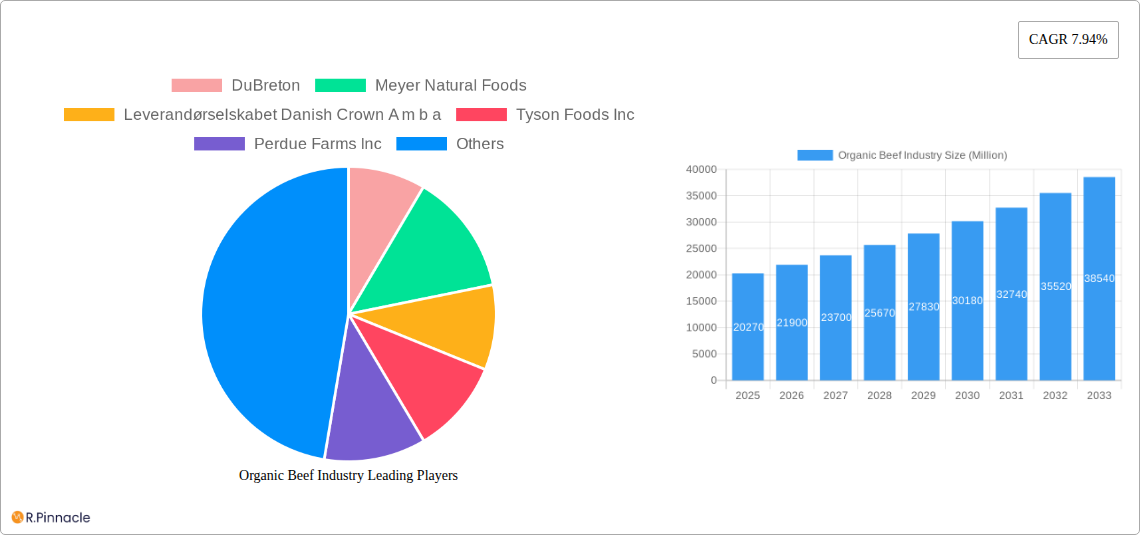
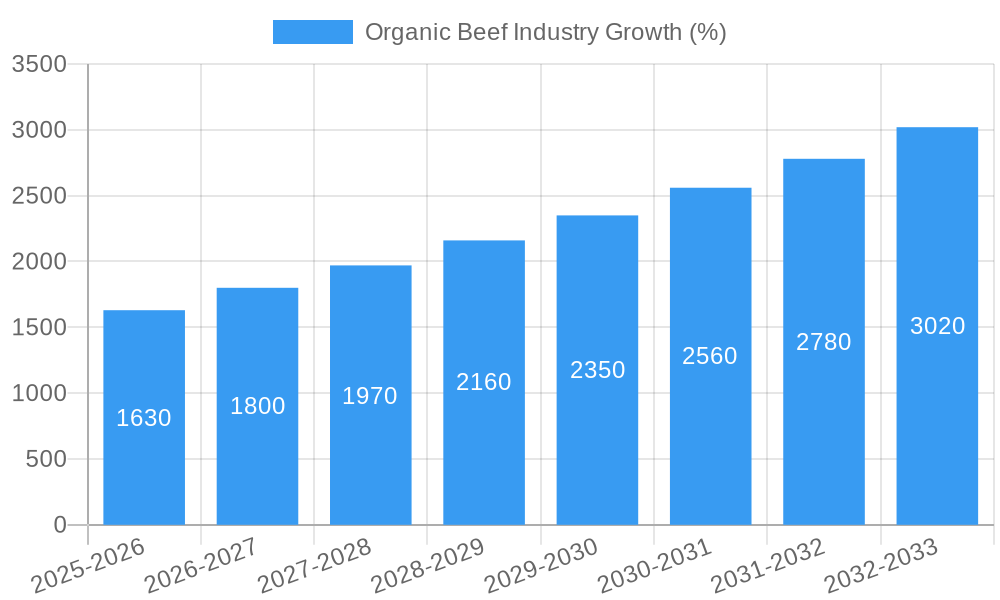
The organic beef market, valued at $20.27 billion in 2025, is experiencing robust growth, projected to expand at a Compound Annual Growth Rate (CAGR) of 7.94% from 2025 to 2033. This surge is fueled by several key drivers. Increasing consumer awareness of the health benefits associated with organic beef, including reduced exposure to antibiotics and hormones, is a primary factor. Growing concerns about the environmental impact of conventional farming practices further propel demand for sustainably raised organic beef. The rise in disposable incomes, particularly in developing economies, allows more consumers to afford premium organic products. Furthermore, the increasing availability of organic beef through diverse distribution channels, such as hypermarkets, specialty stores, and online retailers, is enhancing market accessibility and fueling growth. However, challenges remain. The higher production costs associated with organic beef farming lead to higher retail prices, potentially limiting accessibility for price-sensitive consumers. Fluctuations in feed prices and stringent regulatory requirements for organic certification also pose restraints to market expansion. Market segmentation reveals a diverse landscape, with poultry, beef, pork, and other organic meats contributing significantly. Distribution channels are also varied, with hypermarkets and supermarkets maintaining a dominant position, complemented by specialty stores and the increasingly important online retail segment. Leading players like DuBreton, Meyer Natural Foods, and Tyson Foods are shaping the competitive dynamics, with innovation and brand building playing crucial roles in market penetration. Regional analysis shows strong demand in North America and Europe, while Asia-Pacific and South America present significant growth opportunities as consumer preferences evolve.
The forecast period (2025-2033) suggests a continued upward trajectory for the organic beef market, driven by sustained consumer demand and expanding distribution networks. Strategic investments in sustainable farming practices, coupled with innovative marketing campaigns highlighting the health and environmental benefits of organic beef, will be critical for industry players. Addressing the cost barrier through efficiency improvements and exploring new distribution models could further accelerate market growth. Furthermore, fostering greater transparency and traceability within the supply chain will build consumer trust and solidify the market’s long-term success. This will necessitate collaboration across the value chain, involving producers, distributors, and retailers in creating a robust and sustainable organic beef industry.
This in-depth report provides a comprehensive analysis of the global organic beef industry, offering invaluable insights for industry professionals, investors, and stakeholders. The study period covers 2019-2033, with 2025 serving as the base and estimated year. The report leverages extensive market research and data analysis to deliver actionable strategies for navigating the dynamic landscape of the organic beef market. The global market is projected to reach xx Million by 2033, exhibiting a robust CAGR of xx% during the forecast period (2025-2033).
Organic Beef Industry Market Structure & Innovation Trends
This section analyzes the competitive landscape, innovation drivers, and regulatory influences shaping the organic beef industry. Market concentration is assessed, revealing a moderately consolidated market with key players like DuBreton, Meyer Natural Foods, Leverandørselskabet Danish Crown A m b a, Tyson Foods Inc, Perdue Farms Inc, Foster Farms, Eversfield Organic, Verde Farms, Swellington Organic Farm, and JBS SA holding significant market share. The report quantifies market share for each major player and details the impact of mergers and acquisitions (M&A) activities, including deal values (e.g., a xx Million acquisition of Company X by Company Y in 2022 significantly altered market dynamics). Innovation drivers, such as consumer demand for sustainably sourced products and technological advancements in farming practices, are explored. Regulatory frameworks, including organic certification standards and labeling regulations, are examined for their impact on market growth. The analysis also considers product substitutes (e.g., conventionally raised beef) and end-user demographics (e.g., increasing health consciousness among millennials).
Organic Beef Industry Market Dynamics & Trends
This section delves into the key factors driving market growth and shaping industry trends. The report highlights significant growth drivers, including the increasing consumer preference for organic and sustainably produced food, rising disposable incomes in emerging economies, and the growing awareness of the health benefits of organic beef. Technological advancements in organic farming techniques, such as precision agriculture and improved feed management, are explored for their potential to enhance efficiency and reduce production costs. The analysis also examines the competitive dynamics within the industry, including pricing strategies, product differentiation, and brand building initiatives employed by leading players. Market penetration rates for organic beef in various regions are presented, illustrating varying levels of adoption. Specific CAGR figures for different segments and regions are provided, offering a detailed picture of market performance and growth trajectories.
Dominant Regions & Segments in Organic Beef Industry
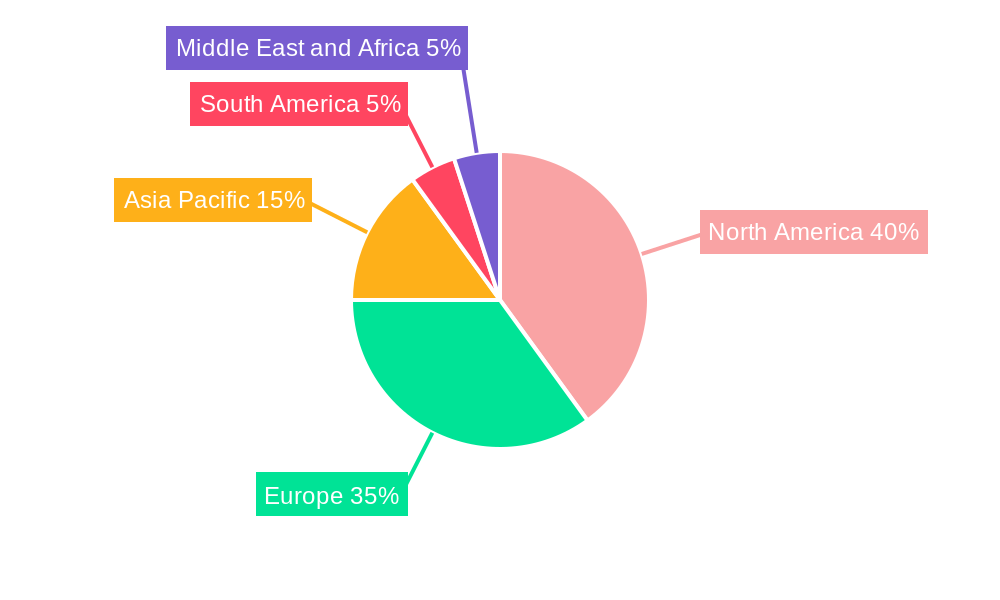
This section identifies the dominant regions and segments within the organic beef industry. Analysis focuses on key geographical markets (e.g., North America, Europe, Asia-Pacific) and major product types (Beef, Poultry, Pork, Other Organic Meats) and distribution channels (Hypermarkets and Supermarkets, Speciality Stores, Online Retailing, Retail and Departmental Stores).
Key Drivers of Regional Dominance:
- North America: Strong consumer demand for organic products, established organic farming infrastructure, and favorable regulatory environment.
- Europe: High consumer awareness of organic food, stringent organic standards, and robust supply chains.
- Asia-Pacific: Growing middle class, rising disposable incomes, and increasing preference for healthier food options.
Key Drivers of Segment Dominance:
- Beef: Highest consumer demand due to established culinary preferences and versatility.
- Hypermarkets and Supermarkets: Largest distribution channel due to extensive reach and consumer accessibility.
The report provides a detailed analysis of market size and growth projections for each leading region and segment, highlighting the factors contributing to their dominance.
Organic Beef Industry Product Innovations
Recent product innovations have focused on enhancing the quality, taste, and convenience of organic beef. This includes the introduction of grass-fed and finished beef, sustainably sourced products, and value-added processed meat items like organic beef jerky and sausages. Technological advancements are enhancing production efficiency and sustainability, leading to more environmentally friendly practices. These innovations are driving market growth by catering to specific consumer preferences and providing competitive advantages.
Report Scope & Segmentation Analysis
This report segments the organic beef market based on product type (Beef, Poultry, Pork, Other Organic Meats) and distribution channel (Hypermarkets and Supermarkets, Speciality Stores, Online Retailing, Retail and Departmental Stores). Each segment's market size, growth projections, and competitive dynamics are analyzed. For example, the beef segment is expected to exhibit the highest growth rate, driven by strong consumer demand, while online retailing is projected to witness significant expansion due to the increasing adoption of e-commerce. Competitive dynamics within each segment are explored, including market share analysis and competitive strategies of key players.
Key Drivers of Organic Beef Industry Growth
Several factors drive the growth of the organic beef industry. Increasing consumer awareness of health and environmental concerns is a major factor, leading to a greater demand for organically produced food. Government policies supporting organic farming practices and favorable regulatory frameworks further encourage industry growth. Technological advancements in organic farming techniques, leading to increased efficiency and reduced production costs, also play a crucial role.
Challenges in the Organic Beef Industry Sector
The organic beef industry faces several challenges, including higher production costs compared to conventional beef, limited availability of organic feed, and stringent certification standards. Supply chain complexities and the potential for fraud in organic certification pose significant hurdles. Competition from conventionally raised beef and the price sensitivity of some consumers remain key challenges. These factors can impact market growth and profitability.
Emerging Opportunities in Organic Beef Industry
Emerging opportunities include the expansion into new markets in developing economies, leveraging technological advancements in precision agriculture and traceability technologies, and catering to niche consumer segments with specialized products. Growing consumer interest in plant-based meat alternatives presents both a challenge and an opportunity for innovation and diversification.
Leading Players in the Organic Beef Industry Market
- DuBreton
- Meyer Natural Foods
- Leverandørselskabet Danish Crown A m b a
- Tyson Foods Inc
- Perdue Farms Inc
- Foster Farms
- Eversfield Organic
- Verde Farms
- Swellington Organic Farm
- JBS SA
Key Developments in Organic Beef Industry Industry
- January 2023: Company X launches a new line of organic grass-fed beef products.
- March 2022: Company Y acquires Company Z, expanding its market presence in the organic beef sector.
- June 2021: New organic certification standards are implemented, impacting industry practices. (More examples to be added)
Future Outlook for Organic Beef Industry Market
The organic beef industry is poised for continued growth, driven by sustained consumer demand for healthy and sustainable food options. Technological advancements will further enhance efficiency and reduce environmental impact. Strategic partnerships and collaborations will shape the future competitive landscape. The industry will need to address challenges related to production costs and supply chain sustainability to ensure continued growth and market penetration.
Organic Beef Industry Segmentation
-
1. Type
- 1.1. Poultry
- 1.2. Beef
- 1.3. Pork
- 1.4. Other Organic Meats
-
2. Distribution Channel
- 2.1. Hypermarkets and Supermarkets
- 2.2. Speciality Stores
- 2.3. Online Retailing
- 2.4. Retail and Departmental Stores
Organic Beef Industry Segmentation By Geography
-
1. North America
- 1.1. United States
- 1.2. Canada
- 1.3. Mexico
- 1.4. Rest of North America
-
2. Europe
- 2.1. Germany
- 2.2. United Kingdom
- 2.3. France
- 2.4. Russia
- 2.5. Spain
- 2.6. Rest of Europe
-
3. Asia Pacific
- 3.1. China
- 3.2. Japan
- 3.3. India
- 3.4. South Korea
- 3.5. Rest of Asia Pacific
-
4. South America
- 4.1. Brazil
- 4.2. Argentina
- 4.3. Rest of South America
-
5. Middle East and Africa
- 5.1. UAE
- 5.2. Saudi Arabia
- 5.3. South Africa
- 5.4. Egypt
- 5.5. Rest of Middle East and Africa
Organic Beef Industry REPORT HIGHLIGHTS
| Aspects | Details |
|---|---|
| Study Period | 2019-2033 |
| Base Year | 2024 |
| Estimated Year | 2025 |
| Forecast Period | 2025-2033 |
| Historical Period | 2019-2024 |
| Growth Rate | CAGR of 7.94% from 2019-2033 |
| Segmentation |
|
Table of Contents
- 1. Introduction
- 1.1. Research Scope
- 1.2. Market Segmentation
- 1.3. Research Methodology
- 1.4. Definitions and Assumptions
- 2. Executive Summary
- 2.1. Introduction
- 3. Market Dynamics
- 3.1. Introduction
- 3.2. Market Drivers
- 3.2.1. Increased Health Awareness; Increased availability of organic beef
- 3.3. Market Restrains
- 3.3.1. Organic beef is often more expensive than conventionally produced beef
- 3.4. Market Trends
- 3.4.1. Growing trend towards offering a variety of organic beef products
- 4. Market Factor Analysis
- 4.1. Porters Five Forces
- 4.2. Supply/Value Chain
- 4.3. PESTEL analysis
- 4.4. Market Entropy
- 4.5. Patent/Trademark Analysis
- 5. Global Organic Beef Industry Analysis, Insights and Forecast, 2019-2031
- 5.1. Market Analysis, Insights and Forecast - by Type
- 5.1.1. Poultry
- 5.1.2. Beef
- 5.1.3. Pork
- 5.1.4. Other Organic Meats
- 5.2. Market Analysis, Insights and Forecast - by Distribution Channel
- 5.2.1. Hypermarkets and Supermarkets
- 5.2.2. Speciality Stores
- 5.2.3. Online Retailing
- 5.2.4. Retail and Departmental Stores
- 5.3. Market Analysis, Insights and Forecast - by Region
- 5.3.1. North America
- 5.3.2. Europe
- 5.3.3. Asia Pacific
- 5.3.4. South America
- 5.3.5. Middle East and Africa
- 5.1. Market Analysis, Insights and Forecast - by Type
- 6. North America Organic Beef Industry Analysis, Insights and Forecast, 2019-2031
- 6.1. Market Analysis, Insights and Forecast - by Type
- 6.1.1. Poultry
- 6.1.2. Beef
- 6.1.3. Pork
- 6.1.4. Other Organic Meats
- 6.2. Market Analysis, Insights and Forecast - by Distribution Channel
- 6.2.1. Hypermarkets and Supermarkets
- 6.2.2. Speciality Stores
- 6.2.3. Online Retailing
- 6.2.4. Retail and Departmental Stores
- 6.1. Market Analysis, Insights and Forecast - by Type
- 7. Europe Organic Beef Industry Analysis, Insights and Forecast, 2019-2031
- 7.1. Market Analysis, Insights and Forecast - by Type
- 7.1.1. Poultry
- 7.1.2. Beef
- 7.1.3. Pork
- 7.1.4. Other Organic Meats
- 7.2. Market Analysis, Insights and Forecast - by Distribution Channel
- 7.2.1. Hypermarkets and Supermarkets
- 7.2.2. Speciality Stores
- 7.2.3. Online Retailing
- 7.2.4. Retail and Departmental Stores
- 7.1. Market Analysis, Insights and Forecast - by Type
- 8. Asia Pacific Organic Beef Industry Analysis, Insights and Forecast, 2019-2031
- 8.1. Market Analysis, Insights and Forecast - by Type
- 8.1.1. Poultry
- 8.1.2. Beef
- 8.1.3. Pork
- 8.1.4. Other Organic Meats
- 8.2. Market Analysis, Insights and Forecast - by Distribution Channel
- 8.2.1. Hypermarkets and Supermarkets
- 8.2.2. Speciality Stores
- 8.2.3. Online Retailing
- 8.2.4. Retail and Departmental Stores
- 8.1. Market Analysis, Insights and Forecast - by Type
- 9. South America Organic Beef Industry Analysis, Insights and Forecast, 2019-2031
- 9.1. Market Analysis, Insights and Forecast - by Type
- 9.1.1. Poultry
- 9.1.2. Beef
- 9.1.3. Pork
- 9.1.4. Other Organic Meats
- 9.2. Market Analysis, Insights and Forecast - by Distribution Channel
- 9.2.1. Hypermarkets and Supermarkets
- 9.2.2. Speciality Stores
- 9.2.3. Online Retailing
- 9.2.4. Retail and Departmental Stores
- 9.1. Market Analysis, Insights and Forecast - by Type
- 10. Middle East and Africa Organic Beef Industry Analysis, Insights and Forecast, 2019-2031
- 10.1. Market Analysis, Insights and Forecast - by Type
- 10.1.1. Poultry
- 10.1.2. Beef
- 10.1.3. Pork
- 10.1.4. Other Organic Meats
- 10.2. Market Analysis, Insights and Forecast - by Distribution Channel
- 10.2.1. Hypermarkets and Supermarkets
- 10.2.2. Speciality Stores
- 10.2.3. Online Retailing
- 10.2.4. Retail and Departmental Stores
- 10.1. Market Analysis, Insights and Forecast - by Type
- 11. North America Organic Beef Industry Analysis, Insights and Forecast, 2019-2031
- 11.1. Market Analysis, Insights and Forecast - By Country/Sub-region
- 11.1.1 United States
- 11.1.2 Canada
- 11.1.3 Mexico
- 11.1.4 Rest of North America
- 12. Europe Organic Beef Industry Analysis, Insights and Forecast, 2019-2031
- 12.1. Market Analysis, Insights and Forecast - By Country/Sub-region
- 12.1.1 Germany
- 12.1.2 United Kingdom
- 12.1.3 France
- 12.1.4 Russia
- 12.1.5 Spain
- 12.1.6 Rest of Europe
- 13. Asia Pacific Organic Beef Industry Analysis, Insights and Forecast, 2019-2031
- 13.1. Market Analysis, Insights and Forecast - By Country/Sub-region
- 13.1.1 China
- 13.1.2 Japan
- 13.1.3 India
- 13.1.4 South Korea
- 13.1.5 Rest of Asia Pacific
- 14. South America Organic Beef Industry Analysis, Insights and Forecast, 2019-2031
- 14.1. Market Analysis, Insights and Forecast - By Country/Sub-region
- 14.1.1 Brazil
- 14.1.2 Argentina
- 14.1.3 Rest of South America
- 15. Middle East and Africa Organic Beef Industry Analysis, Insights and Forecast, 2019-2031
- 15.1. Market Analysis, Insights and Forecast - By Country/Sub-region
- 15.1.1 UAE
- 15.1.2 Saudi Arabia
- 15.1.3 South Africa
- 15.1.4 Egypt
- 15.1.5 Rest of Middle East and Africa
- 16. Competitive Analysis
- 16.1. Global Market Share Analysis 2024
- 16.2. Company Profiles
- 16.2.1 DuBreton
- 16.2.1.1. Overview
- 16.2.1.2. Products
- 16.2.1.3. SWOT Analysis
- 16.2.1.4. Recent Developments
- 16.2.1.5. Financials (Based on Availability)
- 16.2.2 Meyer Natural Foods
- 16.2.2.1. Overview
- 16.2.2.2. Products
- 16.2.2.3. SWOT Analysis
- 16.2.2.4. Recent Developments
- 16.2.2.5. Financials (Based on Availability)
- 16.2.3 Leverandørselskabet Danish Crown A m b a
- 16.2.3.1. Overview
- 16.2.3.2. Products
- 16.2.3.3. SWOT Analysis
- 16.2.3.4. Recent Developments
- 16.2.3.5. Financials (Based on Availability)
- 16.2.4 Tyson Foods Inc
- 16.2.4.1. Overview
- 16.2.4.2. Products
- 16.2.4.3. SWOT Analysis
- 16.2.4.4. Recent Developments
- 16.2.4.5. Financials (Based on Availability)
- 16.2.5 Perdue Farms Inc
- 16.2.5.1. Overview
- 16.2.5.2. Products
- 16.2.5.3. SWOT Analysis
- 16.2.5.4. Recent Developments
- 16.2.5.5. Financials (Based on Availability)
- 16.2.6 Foster Farms
- 16.2.6.1. Overview
- 16.2.6.2. Products
- 16.2.6.3. SWOT Analysis
- 16.2.6.4. Recent Developments
- 16.2.6.5. Financials (Based on Availability)
- 16.2.7 Eversfield Organic
- 16.2.7.1. Overview
- 16.2.7.2. Products
- 16.2.7.3. SWOT Analysis
- 16.2.7.4. Recent Developments
- 16.2.7.5. Financials (Based on Availability)
- 16.2.8 Verde Farms
- 16.2.8.1. Overview
- 16.2.8.2. Products
- 16.2.8.3. SWOT Analysis
- 16.2.8.4. Recent Developments
- 16.2.8.5. Financials (Based on Availability)
- 16.2.9 Swellington Organic Farm
- 16.2.9.1. Overview
- 16.2.9.2. Products
- 16.2.9.3. SWOT Analysis
- 16.2.9.4. Recent Developments
- 16.2.9.5. Financials (Based on Availability)
- 16.2.10 JBS SA
- 16.2.10.1. Overview
- 16.2.10.2. Products
- 16.2.10.3. SWOT Analysis
- 16.2.10.4. Recent Developments
- 16.2.10.5. Financials (Based on Availability)
- 16.2.1 DuBreton
List of Figures
- Figure 1: Global Organic Beef Industry Revenue Breakdown (Million, %) by Region 2024 & 2032
- Figure 2: Global Organic Beef Industry Volume Breakdown (K Tons, %) by Region 2024 & 2032
- Figure 3: North America Organic Beef Industry Revenue (Million), by Country 2024 & 2032
- Figure 4: North America Organic Beef Industry Volume (K Tons), by Country 2024 & 2032
- Figure 5: North America Organic Beef Industry Revenue Share (%), by Country 2024 & 2032
- Figure 6: North America Organic Beef Industry Volume Share (%), by Country 2024 & 2032
- Figure 7: Europe Organic Beef Industry Revenue (Million), by Country 2024 & 2032
- Figure 8: Europe Organic Beef Industry Volume (K Tons), by Country 2024 & 2032
- Figure 9: Europe Organic Beef Industry Revenue Share (%), by Country 2024 & 2032
- Figure 10: Europe Organic Beef Industry Volume Share (%), by Country 2024 & 2032
- Figure 11: Asia Pacific Organic Beef Industry Revenue (Million), by Country 2024 & 2032
- Figure 12: Asia Pacific Organic Beef Industry Volume (K Tons), by Country 2024 & 2032
- Figure 13: Asia Pacific Organic Beef Industry Revenue Share (%), by Country 2024 & 2032
- Figure 14: Asia Pacific Organic Beef Industry Volume Share (%), by Country 2024 & 2032
- Figure 15: South America Organic Beef Industry Revenue (Million), by Country 2024 & 2032
- Figure 16: South America Organic Beef Industry Volume (K Tons), by Country 2024 & 2032
- Figure 17: South America Organic Beef Industry Revenue Share (%), by Country 2024 & 2032
- Figure 18: South America Organic Beef Industry Volume Share (%), by Country 2024 & 2032
- Figure 19: Middle East and Africa Organic Beef Industry Revenue (Million), by Country 2024 & 2032
- Figure 20: Middle East and Africa Organic Beef Industry Volume (K Tons), by Country 2024 & 2032
- Figure 21: Middle East and Africa Organic Beef Industry Revenue Share (%), by Country 2024 & 2032
- Figure 22: Middle East and Africa Organic Beef Industry Volume Share (%), by Country 2024 & 2032
- Figure 23: North America Organic Beef Industry Revenue (Million), by Type 2024 & 2032
- Figure 24: North America Organic Beef Industry Volume (K Tons), by Type 2024 & 2032
- Figure 25: North America Organic Beef Industry Revenue Share (%), by Type 2024 & 2032
- Figure 26: North America Organic Beef Industry Volume Share (%), by Type 2024 & 2032
- Figure 27: North America Organic Beef Industry Revenue (Million), by Distribution Channel 2024 & 2032
- Figure 28: North America Organic Beef Industry Volume (K Tons), by Distribution Channel 2024 & 2032
- Figure 29: North America Organic Beef Industry Revenue Share (%), by Distribution Channel 2024 & 2032
- Figure 30: North America Organic Beef Industry Volume Share (%), by Distribution Channel 2024 & 2032
- Figure 31: North America Organic Beef Industry Revenue (Million), by Country 2024 & 2032
- Figure 32: North America Organic Beef Industry Volume (K Tons), by Country 2024 & 2032
- Figure 33: North America Organic Beef Industry Revenue Share (%), by Country 2024 & 2032
- Figure 34: North America Organic Beef Industry Volume Share (%), by Country 2024 & 2032
- Figure 35: Europe Organic Beef Industry Revenue (Million), by Type 2024 & 2032
- Figure 36: Europe Organic Beef Industry Volume (K Tons), by Type 2024 & 2032
- Figure 37: Europe Organic Beef Industry Revenue Share (%), by Type 2024 & 2032
- Figure 38: Europe Organic Beef Industry Volume Share (%), by Type 2024 & 2032
- Figure 39: Europe Organic Beef Industry Revenue (Million), by Distribution Channel 2024 & 2032
- Figure 40: Europe Organic Beef Industry Volume (K Tons), by Distribution Channel 2024 & 2032
- Figure 41: Europe Organic Beef Industry Revenue Share (%), by Distribution Channel 2024 & 2032
- Figure 42: Europe Organic Beef Industry Volume Share (%), by Distribution Channel 2024 & 2032
- Figure 43: Europe Organic Beef Industry Revenue (Million), by Country 2024 & 2032
- Figure 44: Europe Organic Beef Industry Volume (K Tons), by Country 2024 & 2032
- Figure 45: Europe Organic Beef Industry Revenue Share (%), by Country 2024 & 2032
- Figure 46: Europe Organic Beef Industry Volume Share (%), by Country 2024 & 2032
- Figure 47: Asia Pacific Organic Beef Industry Revenue (Million), by Type 2024 & 2032
- Figure 48: Asia Pacific Organic Beef Industry Volume (K Tons), by Type 2024 & 2032
- Figure 49: Asia Pacific Organic Beef Industry Revenue Share (%), by Type 2024 & 2032
- Figure 50: Asia Pacific Organic Beef Industry Volume Share (%), by Type 2024 & 2032
- Figure 51: Asia Pacific Organic Beef Industry Revenue (Million), by Distribution Channel 2024 & 2032
- Figure 52: Asia Pacific Organic Beef Industry Volume (K Tons), by Distribution Channel 2024 & 2032
- Figure 53: Asia Pacific Organic Beef Industry Revenue Share (%), by Distribution Channel 2024 & 2032
- Figure 54: Asia Pacific Organic Beef Industry Volume Share (%), by Distribution Channel 2024 & 2032
- Figure 55: Asia Pacific Organic Beef Industry Revenue (Million), by Country 2024 & 2032
- Figure 56: Asia Pacific Organic Beef Industry Volume (K Tons), by Country 2024 & 2032
- Figure 57: Asia Pacific Organic Beef Industry Revenue Share (%), by Country 2024 & 2032
- Figure 58: Asia Pacific Organic Beef Industry Volume Share (%), by Country 2024 & 2032
- Figure 59: South America Organic Beef Industry Revenue (Million), by Type 2024 & 2032
- Figure 60: South America Organic Beef Industry Volume (K Tons), by Type 2024 & 2032
- Figure 61: South America Organic Beef Industry Revenue Share (%), by Type 2024 & 2032
- Figure 62: South America Organic Beef Industry Volume Share (%), by Type 2024 & 2032
- Figure 63: South America Organic Beef Industry Revenue (Million), by Distribution Channel 2024 & 2032
- Figure 64: South America Organic Beef Industry Volume (K Tons), by Distribution Channel 2024 & 2032
- Figure 65: South America Organic Beef Industry Revenue Share (%), by Distribution Channel 2024 & 2032
- Figure 66: South America Organic Beef Industry Volume Share (%), by Distribution Channel 2024 & 2032
- Figure 67: South America Organic Beef Industry Revenue (Million), by Country 2024 & 2032
- Figure 68: South America Organic Beef Industry Volume (K Tons), by Country 2024 & 2032
- Figure 69: South America Organic Beef Industry Revenue Share (%), by Country 2024 & 2032
- Figure 70: South America Organic Beef Industry Volume Share (%), by Country 2024 & 2032
- Figure 71: Middle East and Africa Organic Beef Industry Revenue (Million), by Type 2024 & 2032
- Figure 72: Middle East and Africa Organic Beef Industry Volume (K Tons), by Type 2024 & 2032
- Figure 73: Middle East and Africa Organic Beef Industry Revenue Share (%), by Type 2024 & 2032
- Figure 74: Middle East and Africa Organic Beef Industry Volume Share (%), by Type 2024 & 2032
- Figure 75: Middle East and Africa Organic Beef Industry Revenue (Million), by Distribution Channel 2024 & 2032
- Figure 76: Middle East and Africa Organic Beef Industry Volume (K Tons), by Distribution Channel 2024 & 2032
- Figure 77: Middle East and Africa Organic Beef Industry Revenue Share (%), by Distribution Channel 2024 & 2032
- Figure 78: Middle East and Africa Organic Beef Industry Volume Share (%), by Distribution Channel 2024 & 2032
- Figure 79: Middle East and Africa Organic Beef Industry Revenue (Million), by Country 2024 & 2032
- Figure 80: Middle East and Africa Organic Beef Industry Volume (K Tons), by Country 2024 & 2032
- Figure 81: Middle East and Africa Organic Beef Industry Revenue Share (%), by Country 2024 & 2032
- Figure 82: Middle East and Africa Organic Beef Industry Volume Share (%), by Country 2024 & 2032
List of Tables
- Table 1: Global Organic Beef Industry Revenue Million Forecast, by Region 2019 & 2032
- Table 2: Global Organic Beef Industry Volume K Tons Forecast, by Region 2019 & 2032
- Table 3: Global Organic Beef Industry Revenue Million Forecast, by Type 2019 & 2032
- Table 4: Global Organic Beef Industry Volume K Tons Forecast, by Type 2019 & 2032
- Table 5: Global Organic Beef Industry Revenue Million Forecast, by Distribution Channel 2019 & 2032
- Table 6: Global Organic Beef Industry Volume K Tons Forecast, by Distribution Channel 2019 & 2032
- Table 7: Global Organic Beef Industry Revenue Million Forecast, by Region 2019 & 2032
- Table 8: Global Organic Beef Industry Volume K Tons Forecast, by Region 2019 & 2032
- Table 9: Global Organic Beef Industry Revenue Million Forecast, by Country 2019 & 2032
- Table 10: Global Organic Beef Industry Volume K Tons Forecast, by Country 2019 & 2032
- Table 11: United States Organic Beef Industry Revenue (Million) Forecast, by Application 2019 & 2032
- Table 12: United States Organic Beef Industry Volume (K Tons) Forecast, by Application 2019 & 2032
- Table 13: Canada Organic Beef Industry Revenue (Million) Forecast, by Application 2019 & 2032
- Table 14: Canada Organic Beef Industry Volume (K Tons) Forecast, by Application 2019 & 2032
- Table 15: Mexico Organic Beef Industry Revenue (Million) Forecast, by Application 2019 & 2032
- Table 16: Mexico Organic Beef Industry Volume (K Tons) Forecast, by Application 2019 & 2032
- Table 17: Rest of North America Organic Beef Industry Revenue (Million) Forecast, by Application 2019 & 2032
- Table 18: Rest of North America Organic Beef Industry Volume (K Tons) Forecast, by Application 2019 & 2032
- Table 19: Global Organic Beef Industry Revenue Million Forecast, by Country 2019 & 2032
- Table 20: Global Organic Beef Industry Volume K Tons Forecast, by Country 2019 & 2032
- Table 21: Germany Organic Beef Industry Revenue (Million) Forecast, by Application 2019 & 2032
- Table 22: Germany Organic Beef Industry Volume (K Tons) Forecast, by Application 2019 & 2032
- Table 23: United Kingdom Organic Beef Industry Revenue (Million) Forecast, by Application 2019 & 2032
- Table 24: United Kingdom Organic Beef Industry Volume (K Tons) Forecast, by Application 2019 & 2032
- Table 25: France Organic Beef Industry Revenue (Million) Forecast, by Application 2019 & 2032
- Table 26: France Organic Beef Industry Volume (K Tons) Forecast, by Application 2019 & 2032
- Table 27: Russia Organic Beef Industry Revenue (Million) Forecast, by Application 2019 & 2032
- Table 28: Russia Organic Beef Industry Volume (K Tons) Forecast, by Application 2019 & 2032
- Table 29: Spain Organic Beef Industry Revenue (Million) Forecast, by Application 2019 & 2032
- Table 30: Spain Organic Beef Industry Volume (K Tons) Forecast, by Application 2019 & 2032
- Table 31: Rest of Europe Organic Beef Industry Revenue (Million) Forecast, by Application 2019 & 2032
- Table 32: Rest of Europe Organic Beef Industry Volume (K Tons) Forecast, by Application 2019 & 2032
- Table 33: Global Organic Beef Industry Revenue Million Forecast, by Country 2019 & 2032
- Table 34: Global Organic Beef Industry Volume K Tons Forecast, by Country 2019 & 2032
- Table 35: China Organic Beef Industry Revenue (Million) Forecast, by Application 2019 & 2032
- Table 36: China Organic Beef Industry Volume (K Tons) Forecast, by Application 2019 & 2032
- Table 37: Japan Organic Beef Industry Revenue (Million) Forecast, by Application 2019 & 2032
- Table 38: Japan Organic Beef Industry Volume (K Tons) Forecast, by Application 2019 & 2032
- Table 39: India Organic Beef Industry Revenue (Million) Forecast, by Application 2019 & 2032
- Table 40: India Organic Beef Industry Volume (K Tons) Forecast, by Application 2019 & 2032
- Table 41: South Korea Organic Beef Industry Revenue (Million) Forecast, by Application 2019 & 2032
- Table 42: South Korea Organic Beef Industry Volume (K Tons) Forecast, by Application 2019 & 2032
- Table 43: Rest of Asia Pacific Organic Beef Industry Revenue (Million) Forecast, by Application 2019 & 2032
- Table 44: Rest of Asia Pacific Organic Beef Industry Volume (K Tons) Forecast, by Application 2019 & 2032
- Table 45: Global Organic Beef Industry Revenue Million Forecast, by Country 2019 & 2032
- Table 46: Global Organic Beef Industry Volume K Tons Forecast, by Country 2019 & 2032
- Table 47: Brazil Organic Beef Industry Revenue (Million) Forecast, by Application 2019 & 2032
- Table 48: Brazil Organic Beef Industry Volume (K Tons) Forecast, by Application 2019 & 2032
- Table 49: Argentina Organic Beef Industry Revenue (Million) Forecast, by Application 2019 & 2032
- Table 50: Argentina Organic Beef Industry Volume (K Tons) Forecast, by Application 2019 & 2032
- Table 51: Rest of South America Organic Beef Industry Revenue (Million) Forecast, by Application 2019 & 2032
- Table 52: Rest of South America Organic Beef Industry Volume (K Tons) Forecast, by Application 2019 & 2032
- Table 53: Global Organic Beef Industry Revenue Million Forecast, by Country 2019 & 2032
- Table 54: Global Organic Beef Industry Volume K Tons Forecast, by Country 2019 & 2032
- Table 55: UAE Organic Beef Industry Revenue (Million) Forecast, by Application 2019 & 2032
- Table 56: UAE Organic Beef Industry Volume (K Tons) Forecast, by Application 2019 & 2032
- Table 57: Saudi Arabia Organic Beef Industry Revenue (Million) Forecast, by Application 2019 & 2032
- Table 58: Saudi Arabia Organic Beef Industry Volume (K Tons) Forecast, by Application 2019 & 2032
- Table 59: South Africa Organic Beef Industry Revenue (Million) Forecast, by Application 2019 & 2032
- Table 60: South Africa Organic Beef Industry Volume (K Tons) Forecast, by Application 2019 & 2032
- Table 61: Egypt Organic Beef Industry Revenue (Million) Forecast, by Application 2019 & 2032
- Table 62: Egypt Organic Beef Industry Volume (K Tons) Forecast, by Application 2019 & 2032
- Table 63: Rest of Middle East and Africa Organic Beef Industry Revenue (Million) Forecast, by Application 2019 & 2032
- Table 64: Rest of Middle East and Africa Organic Beef Industry Volume (K Tons) Forecast, by Application 2019 & 2032
- Table 65: Global Organic Beef Industry Revenue Million Forecast, by Type 2019 & 2032
- Table 66: Global Organic Beef Industry Volume K Tons Forecast, by Type 2019 & 2032
- Table 67: Global Organic Beef Industry Revenue Million Forecast, by Distribution Channel 2019 & 2032
- Table 68: Global Organic Beef Industry Volume K Tons Forecast, by Distribution Channel 2019 & 2032
- Table 69: Global Organic Beef Industry Revenue Million Forecast, by Country 2019 & 2032
- Table 70: Global Organic Beef Industry Volume K Tons Forecast, by Country 2019 & 2032
- Table 71: United States Organic Beef Industry Revenue (Million) Forecast, by Application 2019 & 2032
- Table 72: United States Organic Beef Industry Volume (K Tons) Forecast, by Application 2019 & 2032
- Table 73: Canada Organic Beef Industry Revenue (Million) Forecast, by Application 2019 & 2032
- Table 74: Canada Organic Beef Industry Volume (K Tons) Forecast, by Application 2019 & 2032
- Table 75: Mexico Organic Beef Industry Revenue (Million) Forecast, by Application 2019 & 2032
- Table 76: Mexico Organic Beef Industry Volume (K Tons) Forecast, by Application 2019 & 2032
- Table 77: Rest of North America Organic Beef Industry Revenue (Million) Forecast, by Application 2019 & 2032
- Table 78: Rest of North America Organic Beef Industry Volume (K Tons) Forecast, by Application 2019 & 2032
- Table 79: Global Organic Beef Industry Revenue Million Forecast, by Type 2019 & 2032
- Table 80: Global Organic Beef Industry Volume K Tons Forecast, by Type 2019 & 2032
- Table 81: Global Organic Beef Industry Revenue Million Forecast, by Distribution Channel 2019 & 2032
- Table 82: Global Organic Beef Industry Volume K Tons Forecast, by Distribution Channel 2019 & 2032
- Table 83: Global Organic Beef Industry Revenue Million Forecast, by Country 2019 & 2032
- Table 84: Global Organic Beef Industry Volume K Tons Forecast, by Country 2019 & 2032
- Table 85: Germany Organic Beef Industry Revenue (Million) Forecast, by Application 2019 & 2032
- Table 86: Germany Organic Beef Industry Volume (K Tons) Forecast, by Application 2019 & 2032
- Table 87: United Kingdom Organic Beef Industry Revenue (Million) Forecast, by Application 2019 & 2032
- Table 88: United Kingdom Organic Beef Industry Volume (K Tons) Forecast, by Application 2019 & 2032
- Table 89: France Organic Beef Industry Revenue (Million) Forecast, by Application 2019 & 2032
- Table 90: France Organic Beef Industry Volume (K Tons) Forecast, by Application 2019 & 2032
- Table 91: Russia Organic Beef Industry Revenue (Million) Forecast, by Application 2019 & 2032
- Table 92: Russia Organic Beef Industry Volume (K Tons) Forecast, by Application 2019 & 2032
- Table 93: Spain Organic Beef Industry Revenue (Million) Forecast, by Application 2019 & 2032
- Table 94: Spain Organic Beef Industry Volume (K Tons) Forecast, by Application 2019 & 2032
- Table 95: Rest of Europe Organic Beef Industry Revenue (Million) Forecast, by Application 2019 & 2032
- Table 96: Rest of Europe Organic Beef Industry Volume (K Tons) Forecast, by Application 2019 & 2032
- Table 97: Global Organic Beef Industry Revenue Million Forecast, by Type 2019 & 2032
- Table 98: Global Organic Beef Industry Volume K Tons Forecast, by Type 2019 & 2032
- Table 99: Global Organic Beef Industry Revenue Million Forecast, by Distribution Channel 2019 & 2032
- Table 100: Global Organic Beef Industry Volume K Tons Forecast, by Distribution Channel 2019 & 2032
- Table 101: Global Organic Beef Industry Revenue Million Forecast, by Country 2019 & 2032
- Table 102: Global Organic Beef Industry Volume K Tons Forecast, by Country 2019 & 2032
- Table 103: China Organic Beef Industry Revenue (Million) Forecast, by Application 2019 & 2032
- Table 104: China Organic Beef Industry Volume (K Tons) Forecast, by Application 2019 & 2032
- Table 105: Japan Organic Beef Industry Revenue (Million) Forecast, by Application 2019 & 2032
- Table 106: Japan Organic Beef Industry Volume (K Tons) Forecast, by Application 2019 & 2032
- Table 107: India Organic Beef Industry Revenue (Million) Forecast, by Application 2019 & 2032
- Table 108: India Organic Beef Industry Volume (K Tons) Forecast, by Application 2019 & 2032
- Table 109: South Korea Organic Beef Industry Revenue (Million) Forecast, by Application 2019 & 2032
- Table 110: South Korea Organic Beef Industry Volume (K Tons) Forecast, by Application 2019 & 2032
- Table 111: Rest of Asia Pacific Organic Beef Industry Revenue (Million) Forecast, by Application 2019 & 2032
- Table 112: Rest of Asia Pacific Organic Beef Industry Volume (K Tons) Forecast, by Application 2019 & 2032
- Table 113: Global Organic Beef Industry Revenue Million Forecast, by Type 2019 & 2032
- Table 114: Global Organic Beef Industry Volume K Tons Forecast, by Type 2019 & 2032
- Table 115: Global Organic Beef Industry Revenue Million Forecast, by Distribution Channel 2019 & 2032
- Table 116: Global Organic Beef Industry Volume K Tons Forecast, by Distribution Channel 2019 & 2032
- Table 117: Global Organic Beef Industry Revenue Million Forecast, by Country 2019 & 2032
- Table 118: Global Organic Beef Industry Volume K Tons Forecast, by Country 2019 & 2032
- Table 119: Brazil Organic Beef Industry Revenue (Million) Forecast, by Application 2019 & 2032
- Table 120: Brazil Organic Beef Industry Volume (K Tons) Forecast, by Application 2019 & 2032
- Table 121: Argentina Organic Beef Industry Revenue (Million) Forecast, by Application 2019 & 2032
- Table 122: Argentina Organic Beef Industry Volume (K Tons) Forecast, by Application 2019 & 2032
- Table 123: Rest of South America Organic Beef Industry Revenue (Million) Forecast, by Application 2019 & 2032
- Table 124: Rest of South America Organic Beef Industry Volume (K Tons) Forecast, by Application 2019 & 2032
- Table 125: Global Organic Beef Industry Revenue Million Forecast, by Type 2019 & 2032
- Table 126: Global Organic Beef Industry Volume K Tons Forecast, by Type 2019 & 2032
- Table 127: Global Organic Beef Industry Revenue Million Forecast, by Distribution Channel 2019 & 2032
- Table 128: Global Organic Beef Industry Volume K Tons Forecast, by Distribution Channel 2019 & 2032
- Table 129: Global Organic Beef Industry Revenue Million Forecast, by Country 2019 & 2032
- Table 130: Global Organic Beef Industry Volume K Tons Forecast, by Country 2019 & 2032
- Table 131: UAE Organic Beef Industry Revenue (Million) Forecast, by Application 2019 & 2032
- Table 132: UAE Organic Beef Industry Volume (K Tons) Forecast, by Application 2019 & 2032
- Table 133: Saudi Arabia Organic Beef Industry Revenue (Million) Forecast, by Application 2019 & 2032
- Table 134: Saudi Arabia Organic Beef Industry Volume (K Tons) Forecast, by Application 2019 & 2032
- Table 135: South Africa Organic Beef Industry Revenue (Million) Forecast, by Application 2019 & 2032
- Table 136: South Africa Organic Beef Industry Volume (K Tons) Forecast, by Application 2019 & 2032
- Table 137: Egypt Organic Beef Industry Revenue (Million) Forecast, by Application 2019 & 2032
- Table 138: Egypt Organic Beef Industry Volume (K Tons) Forecast, by Application 2019 & 2032
- Table 139: Rest of Middle East and Africa Organic Beef Industry Revenue (Million) Forecast, by Application 2019 & 2032
- Table 140: Rest of Middle East and Africa Organic Beef Industry Volume (K Tons) Forecast, by Application 2019 & 2032
Frequently Asked Questions
1. What is the projected Compound Annual Growth Rate (CAGR) of the Organic Beef Industry?
The projected CAGR is approximately 7.94%.
2. Which companies are prominent players in the Organic Beef Industry?
Key companies in the market include DuBreton, Meyer Natural Foods, Leverandørselskabet Danish Crown A m b a, Tyson Foods Inc, Perdue Farms Inc, Foster Farms, Eversfield Organic, Verde Farms, Swellington Organic Farm, JBS SA.
3. What are the main segments of the Organic Beef Industry?
The market segments include Type, Distribution Channel.
4. Can you provide details about the market size?
The market size is estimated to be USD 20.27 Million as of 2022.
5. What are some drivers contributing to market growth?
Increased Health Awareness; Increased availability of organic beef.
6. What are the notable trends driving market growth?
Growing trend towards offering a variety of organic beef products.
7. Are there any restraints impacting market growth?
Organic beef is often more expensive than conventionally produced beef.
8. Can you provide examples of recent developments in the market?
N/A
9. What pricing options are available for accessing the report?
Pricing options include single-user, multi-user, and enterprise licenses priced at USD 4750, USD 5250, and USD 8750 respectively.
10. Is the market size provided in terms of value or volume?
The market size is provided in terms of value, measured in Million and volume, measured in K Tons.
11. Are there any specific market keywords associated with the report?
Yes, the market keyword associated with the report is "Organic Beef Industry," which aids in identifying and referencing the specific market segment covered.
12. How do I determine which pricing option suits my needs best?
The pricing options vary based on user requirements and access needs. Individual users may opt for single-user licenses, while businesses requiring broader access may choose multi-user or enterprise licenses for cost-effective access to the report.
13. Are there any additional resources or data provided in the Organic Beef Industry report?
While the report offers comprehensive insights, it's advisable to review the specific contents or supplementary materials provided to ascertain if additional resources or data are available.
14. How can I stay updated on further developments or reports in the Organic Beef Industry?
To stay informed about further developments, trends, and reports in the Organic Beef Industry, consider subscribing to industry newsletters, following relevant companies and organizations, or regularly checking reputable industry news sources and publications.
Methodology
Step 1 - Identification of Relevant Samples Size from Population Database


Step 2 - Approaches for Defining Global Market Size (Value, Volume* & Price*)

Note*: In applicable scenarios
Step 3 - Data Sources
Primary Research
- Web Analytics
- Survey Reports
- Research Institute
- Latest Research Reports
- Opinion Leaders
Secondary Research
- Annual Reports
- White Paper
- Latest Press Release
- Industry Association
- Paid Database
- Investor Presentations

Step 4 - Data Triangulation
Involves using different sources of information in order to increase the validity of a study
These sources are likely to be stakeholders in a program - participants, other researchers, program staff, other community members, and so on.
Then we put all data in single framework & apply various statistical tools to find out the dynamic on the market.
During the analysis stage, feedback from the stakeholder groups would be compared to determine areas of agreement as well as areas of divergence


