
Key Insights
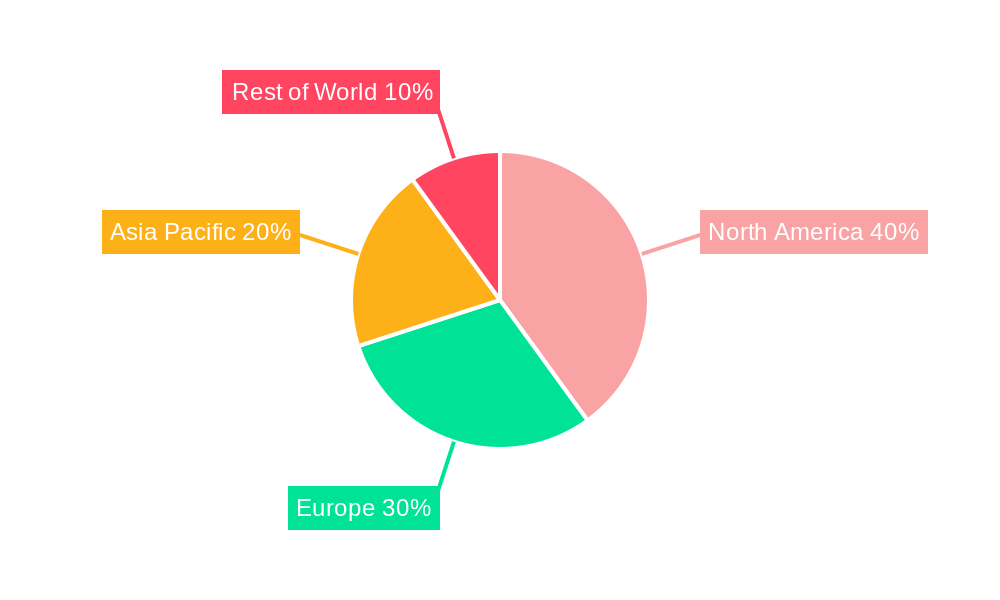
The global pathology devices market, valued at $6.18 billion in 2025, is projected to experience robust growth, driven by several key factors. The increasing prevalence of chronic diseases like cancer and diabetes necessitates advanced diagnostic tools, fueling demand for sophisticated pathology devices. Technological advancements, such as the integration of AI and automation in clinical chemistry analyzers and molecular diagnostic platforms, are significantly improving diagnostic accuracy and efficiency, contributing to market expansion. Furthermore, the rising geriatric population globally increases the demand for pathology testing, further bolstering market growth. The market is segmented by application (drug discovery, disease diagnostics, forensic diagnostics, others), end-user (pharmaceutical companies, hospitals & labs, others), and technology (clinical chemistry, immunoassays, microbiology, molecular diagnostics, others). North America currently holds a significant market share due to advanced healthcare infrastructure and high adoption rates of innovative technologies. However, Asia-Pacific is anticipated to witness the fastest growth rate due to increasing healthcare expenditure and rising awareness of preventive healthcare. While regulatory hurdles and high costs associated with advanced technologies pose challenges, the overall market outlook remains positive, projecting a Compound Annual Growth Rate (CAGR) of 6.12% from 2025 to 2033.
Despite the positive outlook, the market faces some restraints. High initial investment costs for sophisticated equipment, particularly in molecular diagnostics and advanced imaging systems, can restrict adoption, especially in resource-constrained settings. Furthermore, the complexities associated with regulatory approvals and reimbursements for new diagnostic technologies can impact market penetration. However, the ongoing research and development activities aimed at developing more affordable and user-friendly pathology devices, coupled with increasing government initiatives to improve healthcare infrastructure, are expected to mitigate these challenges. The competitive landscape is characterized by the presence of established players like Abbott Laboratories, Roche, and Thermo Fisher Scientific, alongside emerging companies focusing on innovative technologies. These companies are actively engaged in strategic collaborations, acquisitions, and product launches to maintain their market position and capitalize on emerging market opportunities. The market's future trajectory is shaped by a dynamic interplay of technological innovation, increasing healthcare expenditure, and the evolving needs of the global healthcare system.

Pathology Devices Industry Report: 2019-2033
This comprehensive report provides an in-depth analysis of the Pathology Devices market, projecting robust growth from 2019 to 2033. With a focus on actionable insights and key market trends, this report is essential for industry professionals, investors, and strategic decision-makers. The report leverages data from the historical period (2019-2024), base year (2025), and estimated year (2025) to forecast market trends through 2033. The total market value is expected to reach xx Million by 2033.
Pathology Devices Industry Market Structure & Innovation Trends
The Pathology Devices market is characterized by a moderately concentrated landscape, with key players like Becton Dickinson and Company, Abbott Laboratories, and Danaher Corporation holding significant market share (xx%). Innovation is driven by advancements in molecular diagnostics, automation, and AI-driven image analysis. Stringent regulatory frameworks, particularly in the US and Europe, influence product development and market access. The market faces competitive pressure from substitute technologies, such as advanced imaging techniques.
- Market Concentration: Highly concentrated with top 10 players holding xx% market share in 2025.
- Innovation Drivers: Molecular diagnostics, automation, AI-powered image analysis.
- Regulatory Landscape: Stringent FDA and CE marking requirements impacting market entry.
- M&A Activity: Significant M&A activity observed in recent years, with deal values exceeding xx Million in 2024. (Examples of M&A activity data needed for completion).
- End-User Demographics: Hospitals and diagnostic laboratories constitute the largest segment, accounting for xx% of the market.

Pathology Devices Industry Market Dynamics & Trends
The Pathology Devices market is experiencing robust growth, fueled by a confluence of factors. The escalating prevalence of chronic diseases globally is driving significant demand for accurate and timely diagnostic solutions. This demand is further amplified by the increasing adoption of advanced diagnostic technologies, offering improved precision and efficiency. A key transformative element is the integration of artificial intelligence (AI) and machine learning (ML) into diagnostic workflows, leading to enhanced accuracy and streamlined processes. Furthermore, evolving consumer preferences are favoring point-of-care diagnostics and personalized medicine approaches, creating lucrative new market opportunities. The competitive landscape is highly dynamic, characterized by intense competition among established players and emerging innovators focused on continuous product innovation, strategic collaborations, and expansion into new geographical markets. The Compound Annual Growth Rate (CAGR) is projected at xx% during the forecast period (2025-2033), with market penetration anticipated to reach xx% by 2033. This growth trajectory reflects a substantial increase in both the volume and value of pathology devices utilized across diverse healthcare settings.
Dominant Regions & Segments in Pathology Devices Industry
North America currently commands the largest market share (xx%), followed by Europe (xx%). This leadership position is primarily attributable to robust healthcare infrastructure, widespread adoption of advanced technologies, and substantial healthcare expenditure in these regions. Analyzing market segments reveals that Disease Diagnostics constitutes the leading application area (xx%), followed by Drug Discovery and Development (xx%). Hospitals and Diagnostic Laboratories represent the largest end-user segment (xx%), reflecting the critical role of these institutions in pathology testing. Within the technology segment, Molecular Diagnostics exhibits the most rapid growth, boasting a CAGR of xx%, driven by its ability to provide highly sensitive and specific diagnostic information.
- Key Regional Drivers:
- North America: High healthcare expenditure, advanced infrastructure, and a strong regulatory framework supporting innovation.
- Europe: Stringent regulatory frameworks promoting high-quality diagnostics, coupled with significant investments in advanced technologies.
- Asia Pacific: Rapidly expanding healthcare infrastructure, coupled with a rising prevalence of chronic diseases, presents substantial growth potential.
- Dominant Market Segments:
- Application: Disease Diagnostics (highest market share and growth), indicating the dominance of clinical diagnostics in the market.
- End-User: Hospitals and Diagnostic Laboratories (largest market share), underscoring the crucial role of these institutions.
- Technology: Molecular Diagnostics (highest growth rate), highlighting the transformative impact of this technology.
Pathology Devices Industry Product Innovations
Recent breakthroughs in pathology devices encompass a range of advancements. Fully automated systems are enhancing throughput and minimizing manual errors, improving efficiency and reducing human-related variability. AI-powered image analysis tools are significantly improving diagnostic accuracy, enabling faster and more reliable interpretations. Point-of-care devices are facilitating faster diagnoses at the patient's bedside, enabling more timely interventions. These innovations collectively address critical needs for improved efficiency, accuracy, and accessibility of diagnostic tests, aligning with the market's demand for faster turnaround times and personalized medicine approaches. A notable trend is the convergence of technologies, such as the integration of molecular diagnostics and digital pathology, creating powerful synergistic effects.
Report Scope & Segmentation Analysis
This comprehensive report meticulously segments the Pathology Devices market across key parameters: Application (Drug Discovery and Development, Disease Diagnostics, Forensic Diagnostics, Other Applications), End-User (Pharmaceutical Companies, Hospitals and Diagnostic Laboratories, Other End-Users), and Technology (Clinical Chemistry, Immunoassays Technology, Microbiology, Molecular Diagnostics, Other Technologies). The report provides in-depth analysis of each segment, offering detailed growth projections, market sizes, and competitive landscapes. This granular analysis allows for a comprehensive understanding of the diverse facets of the market. Growth projections vary across segments, with Molecular Diagnostics consistently demonstrating the strongest growth potential, reflecting ongoing technological advancements and increasing clinical adoption.
Key Drivers of Pathology Devices Industry Growth
The growth of the Pathology Devices market is driven by several key factors: the rising prevalence of chronic diseases globally, increasing demand for accurate and timely diagnostic testing, technological advancements such as automation and AI-driven diagnostics, and supportive regulatory frameworks in many countries promoting innovation and adoption of new diagnostic technologies. These factors collectively contribute to a positive outlook for market growth.
Challenges in the Pathology Devices Industry Sector
The Pathology Devices industry faces several challenges that influence market dynamics and growth. Significant regulatory hurdles for new product approvals necessitate extensive testing and validation, potentially delaying market entry and increasing costs. Fluctuating raw material prices pose a risk to supply chain stability, impacting manufacturing costs and profitability. Intense competition from established players creates price pressures, particularly affecting smaller companies with limited market power. Furthermore, the complexity of many advanced diagnostic technologies necessitates extensive training for healthcare professionals, representing a significant investment for healthcare providers and potentially limiting wider adoption.
Emerging Opportunities in Pathology Devices Industry
Emerging opportunities include the growing adoption of point-of-care diagnostics, personalized medicine, and the use of AI and machine learning in diagnostic workflows. Expansion into emerging markets with high disease burdens also presents significant opportunities for growth. The integration of big data analytics offers further opportunities for improved disease prediction and treatment.
Leading Players in the Pathology Devices Industry Market
- Becton Dickinson and Company
- Beckman Coulter Inc
- Ortho-Clinical Diagnostics
- Abbott Laboratories
- Danaher Corporation
- Hamamatsu Photonics
- F Hoffmann-La Roche AG
- Mikroscan Technologies
- Bio-Rad Laboratories
- Siemens Healthineers
- Thermo Fisher Scientific
- Definiens
Key Developments in Pathology Devices Industry
- May 2022: BD launched the BD COR MX instrument, a fully automated, high-throughput infectious disease molecular diagnostics platform for detecting Chlamydia trachomatis (CT), Neisseria gonorrhoeae (GC), and Trichomonas vaginalis (TV). This launch significantly enhances the detection capabilities for prevalent STIs.
- September 2022: Sysmex Corporation launched the UF-1500 fully automated urine particle analyzer, expanding its product portfolio and providing comprehensive solutions for urine sediment testing.
Future Outlook for Pathology Devices Industry Market
The Pathology Devices market is poised for continued growth, driven by technological advancements, rising healthcare expenditure, and the increasing prevalence of chronic diseases. Strategic partnerships, expansion into emerging markets, and the development of innovative diagnostic tools will play key roles in shaping the future of the industry. The focus on personalized medicine and point-of-care diagnostics will further propel market expansion.
Pathology Devices Industry Segmentation
-
1. Technology
- 1.1. Clinical Chemistry
- 1.2. Immunoassays Technology
- 1.3. Microbiology
- 1.4. Molecular Diagnostics
- 1.5. Other Technologies
-
2. Application
- 2.1. Drug Discovery and Development
- 2.2. Disease Diagnostics
- 2.3. Forensic Diagnostics
- 2.4. Other Applications
-
3. End-User
- 3.1. Pharmaceutical Companies
- 3.2. Hospitals and Diagnostic Laboratories
- 3.3. Other End-Users
Pathology Devices Industry Segmentation By Geography
-
1. North America
- 1.1. United States
- 1.2. Canada
- 1.3. Mexico
-
2. Europe
- 2.1. Germany
- 2.2. United Kingdom
- 2.3. France
- 2.4. Italy
- 2.5. Spain
- 2.6. Rest of Europe
-
3. Asia Pacific
- 3.1. China
- 3.2. Japan
- 3.3. India
- 3.4. Australia
- 3.5. South Korea
- 3.6. Rest of Asia Pacific
-
4. Middle East and Africa
- 4.1. GCC
- 4.2. South Africa
- 4.3. Rest of Middle East and Africa
-
5. South America
- 5.1. Brazil
- 5.2. Argentina
- 5.3. Rest of South America
Pathology Devices Industry REPORT HIGHLIGHTS
| Aspects | Details |
|---|---|
| Study Period | 2019-2033 |
| Base Year | 2024 |
| Estimated Year | 2025 |
| Forecast Period | 2025-2033 |
| Historical Period | 2019-2024 |
| Growth Rate | CAGR of 6.12% from 2019-2033 |
| Segmentation |
|
Table of Contents
- 1. Introduction
- 1.1. Research Scope
- 1.2. Market Segmentation
- 1.3. Research Methodology
- 1.4. Definitions and Assumptions
- 2. Executive Summary
- 2.1. Introduction
- 3. Market Dynamics
- 3.1. Introduction
- 3.2. Market Drivers
- 3.2.1. Increasing Prevalence of Chronic and Infectious Diseases; Technological Advancements in Pathology Devices; Increasing Investment in Healthcare Infrastructure in Developing Countries
- 3.3. Market Restrains
- 3.3.1. High Cost of Devices; Stringent Regulations and Lack of Skilled Professionals
- 3.4. Market Trends
- 3.4.1. Molecular Diagnostics Segment is Expected to Hold Significant Market Share Over the Forecast Period
- 4. Market Factor Analysis
- 4.1. Porters Five Forces
- 4.2. Supply/Value Chain
- 4.3. PESTEL analysis
- 4.4. Market Entropy
- 4.5. Patent/Trademark Analysis
- 5. Global Pathology Devices Industry Analysis, Insights and Forecast, 2019-2031
- 5.1. Market Analysis, Insights and Forecast - by Technology
- 5.1.1. Clinical Chemistry
- 5.1.2. Immunoassays Technology
- 5.1.3. Microbiology
- 5.1.4. Molecular Diagnostics
- 5.1.5. Other Technologies
- 5.2. Market Analysis, Insights and Forecast - by Application
- 5.2.1. Drug Discovery and Development
- 5.2.2. Disease Diagnostics
- 5.2.3. Forensic Diagnostics
- 5.2.4. Other Applications
- 5.3. Market Analysis, Insights and Forecast - by End-User
- 5.3.1. Pharmaceutical Companies
- 5.3.2. Hospitals and Diagnostic Laboratories
- 5.3.3. Other End-Users
- 5.4. Market Analysis, Insights and Forecast - by Region
- 5.4.1. North America
- 5.4.2. Europe
- 5.4.3. Asia Pacific
- 5.4.4. Middle East and Africa
- 5.4.5. South America
- 5.1. Market Analysis, Insights and Forecast - by Technology
- 6. North America Pathology Devices Industry Analysis, Insights and Forecast, 2019-2031
- 6.1. Market Analysis, Insights and Forecast - by Technology
- 6.1.1. Clinical Chemistry
- 6.1.2. Immunoassays Technology
- 6.1.3. Microbiology
- 6.1.4. Molecular Diagnostics
- 6.1.5. Other Technologies
- 6.2. Market Analysis, Insights and Forecast - by Application
- 6.2.1. Drug Discovery and Development
- 6.2.2. Disease Diagnostics
- 6.2.3. Forensic Diagnostics
- 6.2.4. Other Applications
- 6.3. Market Analysis, Insights and Forecast - by End-User
- 6.3.1. Pharmaceutical Companies
- 6.3.2. Hospitals and Diagnostic Laboratories
- 6.3.3. Other End-Users
- 6.1. Market Analysis, Insights and Forecast - by Technology
- 7. Europe Pathology Devices Industry Analysis, Insights and Forecast, 2019-2031
- 7.1. Market Analysis, Insights and Forecast - by Technology
- 7.1.1. Clinical Chemistry
- 7.1.2. Immunoassays Technology
- 7.1.3. Microbiology
- 7.1.4. Molecular Diagnostics
- 7.1.5. Other Technologies
- 7.2. Market Analysis, Insights and Forecast - by Application
- 7.2.1. Drug Discovery and Development
- 7.2.2. Disease Diagnostics
- 7.2.3. Forensic Diagnostics
- 7.2.4. Other Applications
- 7.3. Market Analysis, Insights and Forecast - by End-User
- 7.3.1. Pharmaceutical Companies
- 7.3.2. Hospitals and Diagnostic Laboratories
- 7.3.3. Other End-Users
- 7.1. Market Analysis, Insights and Forecast - by Technology
- 8. Asia Pacific Pathology Devices Industry Analysis, Insights and Forecast, 2019-2031
- 8.1. Market Analysis, Insights and Forecast - by Technology
- 8.1.1. Clinical Chemistry
- 8.1.2. Immunoassays Technology
- 8.1.3. Microbiology
- 8.1.4. Molecular Diagnostics
- 8.1.5. Other Technologies
- 8.2. Market Analysis, Insights and Forecast - by Application
- 8.2.1. Drug Discovery and Development
- 8.2.2. Disease Diagnostics
- 8.2.3. Forensic Diagnostics
- 8.2.4. Other Applications
- 8.3. Market Analysis, Insights and Forecast - by End-User
- 8.3.1. Pharmaceutical Companies
- 8.3.2. Hospitals and Diagnostic Laboratories
- 8.3.3. Other End-Users
- 8.1. Market Analysis, Insights and Forecast - by Technology
- 9. Middle East and Africa Pathology Devices Industry Analysis, Insights and Forecast, 2019-2031
- 9.1. Market Analysis, Insights and Forecast - by Technology
- 9.1.1. Clinical Chemistry
- 9.1.2. Immunoassays Technology
- 9.1.3. Microbiology
- 9.1.4. Molecular Diagnostics
- 9.1.5. Other Technologies
- 9.2. Market Analysis, Insights and Forecast - by Application
- 9.2.1. Drug Discovery and Development
- 9.2.2. Disease Diagnostics
- 9.2.3. Forensic Diagnostics
- 9.2.4. Other Applications
- 9.3. Market Analysis, Insights and Forecast - by End-User
- 9.3.1. Pharmaceutical Companies
- 9.3.2. Hospitals and Diagnostic Laboratories
- 9.3.3. Other End-Users
- 9.1. Market Analysis, Insights and Forecast - by Technology
- 10. South America Pathology Devices Industry Analysis, Insights and Forecast, 2019-2031
- 10.1. Market Analysis, Insights and Forecast - by Technology
- 10.1.1. Clinical Chemistry
- 10.1.2. Immunoassays Technology
- 10.1.3. Microbiology
- 10.1.4. Molecular Diagnostics
- 10.1.5. Other Technologies
- 10.2. Market Analysis, Insights and Forecast - by Application
- 10.2.1. Drug Discovery and Development
- 10.2.2. Disease Diagnostics
- 10.2.3. Forensic Diagnostics
- 10.2.4. Other Applications
- 10.3. Market Analysis, Insights and Forecast - by End-User
- 10.3.1. Pharmaceutical Companies
- 10.3.2. Hospitals and Diagnostic Laboratories
- 10.3.3. Other End-Users
- 10.1. Market Analysis, Insights and Forecast - by Technology
- 11. North America Pathology Devices Industry Analysis, Insights and Forecast, 2019-2031
- 11.1. Market Analysis, Insights and Forecast - By Country/Sub-region
- 11.1.1 United States
- 11.1.2 Canada
- 11.1.3 Mexico
- 12. South America Pathology Devices Industry Analysis, Insights and Forecast, 2019-2031
- 12.1. Market Analysis, Insights and Forecast - By Country/Sub-region
- 12.1.1 Brazil
- 12.1.2 Mexico
- 12.1.3 Rest of South America
- 13. Europe Pathology Devices Industry Analysis, Insights and Forecast, 2019-2031
- 13.1. Market Analysis, Insights and Forecast - By Country/Sub-region
- 13.1.1 United Kingdom
- 13.1.2 Germany
- 13.1.3 France
- 13.1.4 Italy
- 13.1.5 Spain
- 13.1.6 Russia
- 13.1.7 Rest of Europe
- 14. Asia Pacific Pathology Devices Industry Analysis, Insights and Forecast, 2019-2031
- 14.1. Market Analysis, Insights and Forecast - By Country/Sub-region
- 14.1.1 China
- 14.1.2 Japan
- 14.1.3 India
- 14.1.4 South Korea
- 14.1.5 Taiwan
- 14.1.6 Australia
- 14.1.7 Rest of Asia-Pacific
- 15. MEA Pathology Devices Industry Analysis, Insights and Forecast, 2019-2031
- 15.1. Market Analysis, Insights and Forecast - By Country/Sub-region
- 15.1.1 Middle East
- 15.1.2 Africa
- 16. Competitive Analysis
- 16.1. Global Market Share Analysis 2024
- 16.2. Company Profiles
- 16.2.1 Becton Dickinson and Company
- 16.2.1.1. Overview
- 16.2.1.2. Products
- 16.2.1.3. SWOT Analysis
- 16.2.1.4. Recent Developments
- 16.2.1.5. Financials (Based on Availability)
- 16.2.2 Beckman Coulter Inc
- 16.2.2.1. Overview
- 16.2.2.2. Products
- 16.2.2.3. SWOT Analysis
- 16.2.2.4. Recent Developments
- 16.2.2.5. Financials (Based on Availability)
- 16.2.3 Ortho-Clinical Diagnostics
- 16.2.3.1. Overview
- 16.2.3.2. Products
- 16.2.3.3. SWOT Analysis
- 16.2.3.4. Recent Developments
- 16.2.3.5. Financials (Based on Availability)
- 16.2.4 Abbott Laboratories
- 16.2.4.1. Overview
- 16.2.4.2. Products
- 16.2.4.3. SWOT Analysis
- 16.2.4.4. Recent Developments
- 16.2.4.5. Financials (Based on Availability)
- 16.2.5 Danaher Corporation
- 16.2.5.1. Overview
- 16.2.5.2. Products
- 16.2.5.3. SWOT Analysis
- 16.2.5.4. Recent Developments
- 16.2.5.5. Financials (Based on Availability)
- 16.2.6 Hamamatsu Photonics
- 16.2.6.1. Overview
- 16.2.6.2. Products
- 16.2.6.3. SWOT Analysis
- 16.2.6.4. Recent Developments
- 16.2.6.5. Financials (Based on Availability)
- 16.2.7 F Hoffmann-La Roche AG
- 16.2.7.1. Overview
- 16.2.7.2. Products
- 16.2.7.3. SWOT Analysis
- 16.2.7.4. Recent Developments
- 16.2.7.5. Financials (Based on Availability)
- 16.2.8 Mikroscan Technologies
- 16.2.8.1. Overview
- 16.2.8.2. Products
- 16.2.8.3. SWOT Analysis
- 16.2.8.4. Recent Developments
- 16.2.8.5. Financials (Based on Availability)
- 16.2.9 Bio-Rad Laboratories
- 16.2.9.1. Overview
- 16.2.9.2. Products
- 16.2.9.3. SWOT Analysis
- 16.2.9.4. Recent Developments
- 16.2.9.5. Financials (Based on Availability)
- 16.2.10 Siemens Healthineers
- 16.2.10.1. Overview
- 16.2.10.2. Products
- 16.2.10.3. SWOT Analysis
- 16.2.10.4. Recent Developments
- 16.2.10.5. Financials (Based on Availability)
- 16.2.11 Thermo Fisher Scientific
- 16.2.11.1. Overview
- 16.2.11.2. Products
- 16.2.11.3. SWOT Analysis
- 16.2.11.4. Recent Developments
- 16.2.11.5. Financials (Based on Availability)
- 16.2.12 Definiens
- 16.2.12.1. Overview
- 16.2.12.2. Products
- 16.2.12.3. SWOT Analysis
- 16.2.12.4. Recent Developments
- 16.2.12.5. Financials (Based on Availability)
- 16.2.1 Becton Dickinson and Company
List of Figures
- Figure 1: Global Pathology Devices Industry Revenue Breakdown (Million, %) by Region 2024 & 2032
- Figure 2: Global Pathology Devices Industry Volume Breakdown (K Units, %) by Region 2024 & 2032
- Figure 3: North America Pathology Devices Industry Revenue (Million), by Country 2024 & 2032
- Figure 4: North America Pathology Devices Industry Volume (K Units), by Country 2024 & 2032
- Figure 5: North America Pathology Devices Industry Revenue Share (%), by Country 2024 & 2032
- Figure 6: North America Pathology Devices Industry Volume Share (%), by Country 2024 & 2032
- Figure 7: South America Pathology Devices Industry Revenue (Million), by Country 2024 & 2032
- Figure 8: South America Pathology Devices Industry Volume (K Units), by Country 2024 & 2032
- Figure 9: South America Pathology Devices Industry Revenue Share (%), by Country 2024 & 2032
- Figure 10: South America Pathology Devices Industry Volume Share (%), by Country 2024 & 2032
- Figure 11: Europe Pathology Devices Industry Revenue (Million), by Country 2024 & 2032
- Figure 12: Europe Pathology Devices Industry Volume (K Units), by Country 2024 & 2032
- Figure 13: Europe Pathology Devices Industry Revenue Share (%), by Country 2024 & 2032
- Figure 14: Europe Pathology Devices Industry Volume Share (%), by Country 2024 & 2032
- Figure 15: Asia Pacific Pathology Devices Industry Revenue (Million), by Country 2024 & 2032
- Figure 16: Asia Pacific Pathology Devices Industry Volume (K Units), by Country 2024 & 2032
- Figure 17: Asia Pacific Pathology Devices Industry Revenue Share (%), by Country 2024 & 2032
- Figure 18: Asia Pacific Pathology Devices Industry Volume Share (%), by Country 2024 & 2032
- Figure 19: MEA Pathology Devices Industry Revenue (Million), by Country 2024 & 2032
- Figure 20: MEA Pathology Devices Industry Volume (K Units), by Country 2024 & 2032
- Figure 21: MEA Pathology Devices Industry Revenue Share (%), by Country 2024 & 2032
- Figure 22: MEA Pathology Devices Industry Volume Share (%), by Country 2024 & 2032
- Figure 23: North America Pathology Devices Industry Revenue (Million), by Technology 2024 & 2032
- Figure 24: North America Pathology Devices Industry Volume (K Units), by Technology 2024 & 2032
- Figure 25: North America Pathology Devices Industry Revenue Share (%), by Technology 2024 & 2032
- Figure 26: North America Pathology Devices Industry Volume Share (%), by Technology 2024 & 2032
- Figure 27: North America Pathology Devices Industry Revenue (Million), by Application 2024 & 2032
- Figure 28: North America Pathology Devices Industry Volume (K Units), by Application 2024 & 2032
- Figure 29: North America Pathology Devices Industry Revenue Share (%), by Application 2024 & 2032
- Figure 30: North America Pathology Devices Industry Volume Share (%), by Application 2024 & 2032
- Figure 31: North America Pathology Devices Industry Revenue (Million), by End-User 2024 & 2032
- Figure 32: North America Pathology Devices Industry Volume (K Units), by End-User 2024 & 2032
- Figure 33: North America Pathology Devices Industry Revenue Share (%), by End-User 2024 & 2032
- Figure 34: North America Pathology Devices Industry Volume Share (%), by End-User 2024 & 2032
- Figure 35: North America Pathology Devices Industry Revenue (Million), by Country 2024 & 2032
- Figure 36: North America Pathology Devices Industry Volume (K Units), by Country 2024 & 2032
- Figure 37: North America Pathology Devices Industry Revenue Share (%), by Country 2024 & 2032
- Figure 38: North America Pathology Devices Industry Volume Share (%), by Country 2024 & 2032
- Figure 39: Europe Pathology Devices Industry Revenue (Million), by Technology 2024 & 2032
- Figure 40: Europe Pathology Devices Industry Volume (K Units), by Technology 2024 & 2032
- Figure 41: Europe Pathology Devices Industry Revenue Share (%), by Technology 2024 & 2032
- Figure 42: Europe Pathology Devices Industry Volume Share (%), by Technology 2024 & 2032
- Figure 43: Europe Pathology Devices Industry Revenue (Million), by Application 2024 & 2032
- Figure 44: Europe Pathology Devices Industry Volume (K Units), by Application 2024 & 2032
- Figure 45: Europe Pathology Devices Industry Revenue Share (%), by Application 2024 & 2032
- Figure 46: Europe Pathology Devices Industry Volume Share (%), by Application 2024 & 2032
- Figure 47: Europe Pathology Devices Industry Revenue (Million), by End-User 2024 & 2032
- Figure 48: Europe Pathology Devices Industry Volume (K Units), by End-User 2024 & 2032
- Figure 49: Europe Pathology Devices Industry Revenue Share (%), by End-User 2024 & 2032
- Figure 50: Europe Pathology Devices Industry Volume Share (%), by End-User 2024 & 2032
- Figure 51: Europe Pathology Devices Industry Revenue (Million), by Country 2024 & 2032
- Figure 52: Europe Pathology Devices Industry Volume (K Units), by Country 2024 & 2032
- Figure 53: Europe Pathology Devices Industry Revenue Share (%), by Country 2024 & 2032
- Figure 54: Europe Pathology Devices Industry Volume Share (%), by Country 2024 & 2032
- Figure 55: Asia Pacific Pathology Devices Industry Revenue (Million), by Technology 2024 & 2032
- Figure 56: Asia Pacific Pathology Devices Industry Volume (K Units), by Technology 2024 & 2032
- Figure 57: Asia Pacific Pathology Devices Industry Revenue Share (%), by Technology 2024 & 2032
- Figure 58: Asia Pacific Pathology Devices Industry Volume Share (%), by Technology 2024 & 2032
- Figure 59: Asia Pacific Pathology Devices Industry Revenue (Million), by Application 2024 & 2032
- Figure 60: Asia Pacific Pathology Devices Industry Volume (K Units), by Application 2024 & 2032
- Figure 61: Asia Pacific Pathology Devices Industry Revenue Share (%), by Application 2024 & 2032
- Figure 62: Asia Pacific Pathology Devices Industry Volume Share (%), by Application 2024 & 2032
- Figure 63: Asia Pacific Pathology Devices Industry Revenue (Million), by End-User 2024 & 2032
- Figure 64: Asia Pacific Pathology Devices Industry Volume (K Units), by End-User 2024 & 2032
- Figure 65: Asia Pacific Pathology Devices Industry Revenue Share (%), by End-User 2024 & 2032
- Figure 66: Asia Pacific Pathology Devices Industry Volume Share (%), by End-User 2024 & 2032
- Figure 67: Asia Pacific Pathology Devices Industry Revenue (Million), by Country 2024 & 2032
- Figure 68: Asia Pacific Pathology Devices Industry Volume (K Units), by Country 2024 & 2032
- Figure 69: Asia Pacific Pathology Devices Industry Revenue Share (%), by Country 2024 & 2032
- Figure 70: Asia Pacific Pathology Devices Industry Volume Share (%), by Country 2024 & 2032
- Figure 71: Middle East and Africa Pathology Devices Industry Revenue (Million), by Technology 2024 & 2032
- Figure 72: Middle East and Africa Pathology Devices Industry Volume (K Units), by Technology 2024 & 2032
- Figure 73: Middle East and Africa Pathology Devices Industry Revenue Share (%), by Technology 2024 & 2032
- Figure 74: Middle East and Africa Pathology Devices Industry Volume Share (%), by Technology 2024 & 2032
- Figure 75: Middle East and Africa Pathology Devices Industry Revenue (Million), by Application 2024 & 2032
- Figure 76: Middle East and Africa Pathology Devices Industry Volume (K Units), by Application 2024 & 2032
- Figure 77: Middle East and Africa Pathology Devices Industry Revenue Share (%), by Application 2024 & 2032
- Figure 78: Middle East and Africa Pathology Devices Industry Volume Share (%), by Application 2024 & 2032
- Figure 79: Middle East and Africa Pathology Devices Industry Revenue (Million), by End-User 2024 & 2032
- Figure 80: Middle East and Africa Pathology Devices Industry Volume (K Units), by End-User 2024 & 2032
- Figure 81: Middle East and Africa Pathology Devices Industry Revenue Share (%), by End-User 2024 & 2032
- Figure 82: Middle East and Africa Pathology Devices Industry Volume Share (%), by End-User 2024 & 2032
- Figure 83: Middle East and Africa Pathology Devices Industry Revenue (Million), by Country 2024 & 2032
- Figure 84: Middle East and Africa Pathology Devices Industry Volume (K Units), by Country 2024 & 2032
- Figure 85: Middle East and Africa Pathology Devices Industry Revenue Share (%), by Country 2024 & 2032
- Figure 86: Middle East and Africa Pathology Devices Industry Volume Share (%), by Country 2024 & 2032
- Figure 87: South America Pathology Devices Industry Revenue (Million), by Technology 2024 & 2032
- Figure 88: South America Pathology Devices Industry Volume (K Units), by Technology 2024 & 2032
- Figure 89: South America Pathology Devices Industry Revenue Share (%), by Technology 2024 & 2032
- Figure 90: South America Pathology Devices Industry Volume Share (%), by Technology 2024 & 2032
- Figure 91: South America Pathology Devices Industry Revenue (Million), by Application 2024 & 2032
- Figure 92: South America Pathology Devices Industry Volume (K Units), by Application 2024 & 2032
- Figure 93: South America Pathology Devices Industry Revenue Share (%), by Application 2024 & 2032
- Figure 94: South America Pathology Devices Industry Volume Share (%), by Application 2024 & 2032
- Figure 95: South America Pathology Devices Industry Revenue (Million), by End-User 2024 & 2032
- Figure 96: South America Pathology Devices Industry Volume (K Units), by End-User 2024 & 2032
- Figure 97: South America Pathology Devices Industry Revenue Share (%), by End-User 2024 & 2032
- Figure 98: South America Pathology Devices Industry Volume Share (%), by End-User 2024 & 2032
- Figure 99: South America Pathology Devices Industry Revenue (Million), by Country 2024 & 2032
- Figure 100: South America Pathology Devices Industry Volume (K Units), by Country 2024 & 2032
- Figure 101: South America Pathology Devices Industry Revenue Share (%), by Country 2024 & 2032
- Figure 102: South America Pathology Devices Industry Volume Share (%), by Country 2024 & 2032
List of Tables
- Table 1: Global Pathology Devices Industry Revenue Million Forecast, by Region 2019 & 2032
- Table 2: Global Pathology Devices Industry Volume K Units Forecast, by Region 2019 & 2032
- Table 3: Global Pathology Devices Industry Revenue Million Forecast, by Technology 2019 & 2032
- Table 4: Global Pathology Devices Industry Volume K Units Forecast, by Technology 2019 & 2032
- Table 5: Global Pathology Devices Industry Revenue Million Forecast, by Application 2019 & 2032
- Table 6: Global Pathology Devices Industry Volume K Units Forecast, by Application 2019 & 2032
- Table 7: Global Pathology Devices Industry Revenue Million Forecast, by End-User 2019 & 2032
- Table 8: Global Pathology Devices Industry Volume K Units Forecast, by End-User 2019 & 2032
- Table 9: Global Pathology Devices Industry Revenue Million Forecast, by Region 2019 & 2032
- Table 10: Global Pathology Devices Industry Volume K Units Forecast, by Region 2019 & 2032
- Table 11: Global Pathology Devices Industry Revenue Million Forecast, by Country 2019 & 2032
- Table 12: Global Pathology Devices Industry Volume K Units Forecast, by Country 2019 & 2032
- Table 13: United States Pathology Devices Industry Revenue (Million) Forecast, by Application 2019 & 2032
- Table 14: United States Pathology Devices Industry Volume (K Units) Forecast, by Application 2019 & 2032
- Table 15: Canada Pathology Devices Industry Revenue (Million) Forecast, by Application 2019 & 2032
- Table 16: Canada Pathology Devices Industry Volume (K Units) Forecast, by Application 2019 & 2032
- Table 17: Mexico Pathology Devices Industry Revenue (Million) Forecast, by Application 2019 & 2032
- Table 18: Mexico Pathology Devices Industry Volume (K Units) Forecast, by Application 2019 & 2032
- Table 19: Global Pathology Devices Industry Revenue Million Forecast, by Country 2019 & 2032
- Table 20: Global Pathology Devices Industry Volume K Units Forecast, by Country 2019 & 2032
- Table 21: Brazil Pathology Devices Industry Revenue (Million) Forecast, by Application 2019 & 2032
- Table 22: Brazil Pathology Devices Industry Volume (K Units) Forecast, by Application 2019 & 2032
- Table 23: Mexico Pathology Devices Industry Revenue (Million) Forecast, by Application 2019 & 2032
- Table 24: Mexico Pathology Devices Industry Volume (K Units) Forecast, by Application 2019 & 2032
- Table 25: Rest of South America Pathology Devices Industry Revenue (Million) Forecast, by Application 2019 & 2032
- Table 26: Rest of South America Pathology Devices Industry Volume (K Units) Forecast, by Application 2019 & 2032
- Table 27: Global Pathology Devices Industry Revenue Million Forecast, by Country 2019 & 2032
- Table 28: Global Pathology Devices Industry Volume K Units Forecast, by Country 2019 & 2032
- Table 29: United Kingdom Pathology Devices Industry Revenue (Million) Forecast, by Application 2019 & 2032
- Table 30: United Kingdom Pathology Devices Industry Volume (K Units) Forecast, by Application 2019 & 2032
- Table 31: Germany Pathology Devices Industry Revenue (Million) Forecast, by Application 2019 & 2032
- Table 32: Germany Pathology Devices Industry Volume (K Units) Forecast, by Application 2019 & 2032
- Table 33: France Pathology Devices Industry Revenue (Million) Forecast, by Application 2019 & 2032
- Table 34: France Pathology Devices Industry Volume (K Units) Forecast, by Application 2019 & 2032
- Table 35: Italy Pathology Devices Industry Revenue (Million) Forecast, by Application 2019 & 2032
- Table 36: Italy Pathology Devices Industry Volume (K Units) Forecast, by Application 2019 & 2032
- Table 37: Spain Pathology Devices Industry Revenue (Million) Forecast, by Application 2019 & 2032
- Table 38: Spain Pathology Devices Industry Volume (K Units) Forecast, by Application 2019 & 2032
- Table 39: Russia Pathology Devices Industry Revenue (Million) Forecast, by Application 2019 & 2032
- Table 40: Russia Pathology Devices Industry Volume (K Units) Forecast, by Application 2019 & 2032
- Table 41: Rest of Europe Pathology Devices Industry Revenue (Million) Forecast, by Application 2019 & 2032
- Table 42: Rest of Europe Pathology Devices Industry Volume (K Units) Forecast, by Application 2019 & 2032
- Table 43: Global Pathology Devices Industry Revenue Million Forecast, by Country 2019 & 2032
- Table 44: Global Pathology Devices Industry Volume K Units Forecast, by Country 2019 & 2032
- Table 45: China Pathology Devices Industry Revenue (Million) Forecast, by Application 2019 & 2032
- Table 46: China Pathology Devices Industry Volume (K Units) Forecast, by Application 2019 & 2032
- Table 47: Japan Pathology Devices Industry Revenue (Million) Forecast, by Application 2019 & 2032
- Table 48: Japan Pathology Devices Industry Volume (K Units) Forecast, by Application 2019 & 2032
- Table 49: India Pathology Devices Industry Revenue (Million) Forecast, by Application 2019 & 2032
- Table 50: India Pathology Devices Industry Volume (K Units) Forecast, by Application 2019 & 2032
- Table 51: South Korea Pathology Devices Industry Revenue (Million) Forecast, by Application 2019 & 2032
- Table 52: South Korea Pathology Devices Industry Volume (K Units) Forecast, by Application 2019 & 2032
- Table 53: Taiwan Pathology Devices Industry Revenue (Million) Forecast, by Application 2019 & 2032
- Table 54: Taiwan Pathology Devices Industry Volume (K Units) Forecast, by Application 2019 & 2032
- Table 55: Australia Pathology Devices Industry Revenue (Million) Forecast, by Application 2019 & 2032
- Table 56: Australia Pathology Devices Industry Volume (K Units) Forecast, by Application 2019 & 2032
- Table 57: Rest of Asia-Pacific Pathology Devices Industry Revenue (Million) Forecast, by Application 2019 & 2032
- Table 58: Rest of Asia-Pacific Pathology Devices Industry Volume (K Units) Forecast, by Application 2019 & 2032
- Table 59: Global Pathology Devices Industry Revenue Million Forecast, by Country 2019 & 2032
- Table 60: Global Pathology Devices Industry Volume K Units Forecast, by Country 2019 & 2032
- Table 61: Middle East Pathology Devices Industry Revenue (Million) Forecast, by Application 2019 & 2032
- Table 62: Middle East Pathology Devices Industry Volume (K Units) Forecast, by Application 2019 & 2032
- Table 63: Africa Pathology Devices Industry Revenue (Million) Forecast, by Application 2019 & 2032
- Table 64: Africa Pathology Devices Industry Volume (K Units) Forecast, by Application 2019 & 2032
- Table 65: Global Pathology Devices Industry Revenue Million Forecast, by Technology 2019 & 2032
- Table 66: Global Pathology Devices Industry Volume K Units Forecast, by Technology 2019 & 2032
- Table 67: Global Pathology Devices Industry Revenue Million Forecast, by Application 2019 & 2032
- Table 68: Global Pathology Devices Industry Volume K Units Forecast, by Application 2019 & 2032
- Table 69: Global Pathology Devices Industry Revenue Million Forecast, by End-User 2019 & 2032
- Table 70: Global Pathology Devices Industry Volume K Units Forecast, by End-User 2019 & 2032
- Table 71: Global Pathology Devices Industry Revenue Million Forecast, by Country 2019 & 2032
- Table 72: Global Pathology Devices Industry Volume K Units Forecast, by Country 2019 & 2032
- Table 73: United States Pathology Devices Industry Revenue (Million) Forecast, by Application 2019 & 2032
- Table 74: United States Pathology Devices Industry Volume (K Units) Forecast, by Application 2019 & 2032
- Table 75: Canada Pathology Devices Industry Revenue (Million) Forecast, by Application 2019 & 2032
- Table 76: Canada Pathology Devices Industry Volume (K Units) Forecast, by Application 2019 & 2032
- Table 77: Mexico Pathology Devices Industry Revenue (Million) Forecast, by Application 2019 & 2032
- Table 78: Mexico Pathology Devices Industry Volume (K Units) Forecast, by Application 2019 & 2032
- Table 79: Global Pathology Devices Industry Revenue Million Forecast, by Technology 2019 & 2032
- Table 80: Global Pathology Devices Industry Volume K Units Forecast, by Technology 2019 & 2032
- Table 81: Global Pathology Devices Industry Revenue Million Forecast, by Application 2019 & 2032
- Table 82: Global Pathology Devices Industry Volume K Units Forecast, by Application 2019 & 2032
- Table 83: Global Pathology Devices Industry Revenue Million Forecast, by End-User 2019 & 2032
- Table 84: Global Pathology Devices Industry Volume K Units Forecast, by End-User 2019 & 2032
- Table 85: Global Pathology Devices Industry Revenue Million Forecast, by Country 2019 & 2032
- Table 86: Global Pathology Devices Industry Volume K Units Forecast, by Country 2019 & 2032
- Table 87: Germany Pathology Devices Industry Revenue (Million) Forecast, by Application 2019 & 2032
- Table 88: Germany Pathology Devices Industry Volume (K Units) Forecast, by Application 2019 & 2032
- Table 89: United Kingdom Pathology Devices Industry Revenue (Million) Forecast, by Application 2019 & 2032
- Table 90: United Kingdom Pathology Devices Industry Volume (K Units) Forecast, by Application 2019 & 2032
- Table 91: France Pathology Devices Industry Revenue (Million) Forecast, by Application 2019 & 2032
- Table 92: France Pathology Devices Industry Volume (K Units) Forecast, by Application 2019 & 2032
- Table 93: Italy Pathology Devices Industry Revenue (Million) Forecast, by Application 2019 & 2032
- Table 94: Italy Pathology Devices Industry Volume (K Units) Forecast, by Application 2019 & 2032
- Table 95: Spain Pathology Devices Industry Revenue (Million) Forecast, by Application 2019 & 2032
- Table 96: Spain Pathology Devices Industry Volume (K Units) Forecast, by Application 2019 & 2032
- Table 97: Rest of Europe Pathology Devices Industry Revenue (Million) Forecast, by Application 2019 & 2032
- Table 98: Rest of Europe Pathology Devices Industry Volume (K Units) Forecast, by Application 2019 & 2032
- Table 99: Global Pathology Devices Industry Revenue Million Forecast, by Technology 2019 & 2032
- Table 100: Global Pathology Devices Industry Volume K Units Forecast, by Technology 2019 & 2032
- Table 101: Global Pathology Devices Industry Revenue Million Forecast, by Application 2019 & 2032
- Table 102: Global Pathology Devices Industry Volume K Units Forecast, by Application 2019 & 2032
- Table 103: Global Pathology Devices Industry Revenue Million Forecast, by End-User 2019 & 2032
- Table 104: Global Pathology Devices Industry Volume K Units Forecast, by End-User 2019 & 2032
- Table 105: Global Pathology Devices Industry Revenue Million Forecast, by Country 2019 & 2032
- Table 106: Global Pathology Devices Industry Volume K Units Forecast, by Country 2019 & 2032
- Table 107: China Pathology Devices Industry Revenue (Million) Forecast, by Application 2019 & 2032
- Table 108: China Pathology Devices Industry Volume (K Units) Forecast, by Application 2019 & 2032
- Table 109: Japan Pathology Devices Industry Revenue (Million) Forecast, by Application 2019 & 2032
- Table 110: Japan Pathology Devices Industry Volume (K Units) Forecast, by Application 2019 & 2032
- Table 111: India Pathology Devices Industry Revenue (Million) Forecast, by Application 2019 & 2032
- Table 112: India Pathology Devices Industry Volume (K Units) Forecast, by Application 2019 & 2032
- Table 113: Australia Pathology Devices Industry Revenue (Million) Forecast, by Application 2019 & 2032
- Table 114: Australia Pathology Devices Industry Volume (K Units) Forecast, by Application 2019 & 2032
- Table 115: South Korea Pathology Devices Industry Revenue (Million) Forecast, by Application 2019 & 2032
- Table 116: South Korea Pathology Devices Industry Volume (K Units) Forecast, by Application 2019 & 2032
- Table 117: Rest of Asia Pacific Pathology Devices Industry Revenue (Million) Forecast, by Application 2019 & 2032
- Table 118: Rest of Asia Pacific Pathology Devices Industry Volume (K Units) Forecast, by Application 2019 & 2032
- Table 119: Global Pathology Devices Industry Revenue Million Forecast, by Technology 2019 & 2032
- Table 120: Global Pathology Devices Industry Volume K Units Forecast, by Technology 2019 & 2032
- Table 121: Global Pathology Devices Industry Revenue Million Forecast, by Application 2019 & 2032
- Table 122: Global Pathology Devices Industry Volume K Units Forecast, by Application 2019 & 2032
- Table 123: Global Pathology Devices Industry Revenue Million Forecast, by End-User 2019 & 2032
- Table 124: Global Pathology Devices Industry Volume K Units Forecast, by End-User 2019 & 2032
- Table 125: Global Pathology Devices Industry Revenue Million Forecast, by Country 2019 & 2032
- Table 126: Global Pathology Devices Industry Volume K Units Forecast, by Country 2019 & 2032
- Table 127: GCC Pathology Devices Industry Revenue (Million) Forecast, by Application 2019 & 2032
- Table 128: GCC Pathology Devices Industry Volume (K Units) Forecast, by Application 2019 & 2032
- Table 129: South Africa Pathology Devices Industry Revenue (Million) Forecast, by Application 2019 & 2032
- Table 130: South Africa Pathology Devices Industry Volume (K Units) Forecast, by Application 2019 & 2032
- Table 131: Rest of Middle East and Africa Pathology Devices Industry Revenue (Million) Forecast, by Application 2019 & 2032
- Table 132: Rest of Middle East and Africa Pathology Devices Industry Volume (K Units) Forecast, by Application 2019 & 2032
- Table 133: Global Pathology Devices Industry Revenue Million Forecast, by Technology 2019 & 2032
- Table 134: Global Pathology Devices Industry Volume K Units Forecast, by Technology 2019 & 2032
- Table 135: Global Pathology Devices Industry Revenue Million Forecast, by Application 2019 & 2032
- Table 136: Global Pathology Devices Industry Volume K Units Forecast, by Application 2019 & 2032
- Table 137: Global Pathology Devices Industry Revenue Million Forecast, by End-User 2019 & 2032
- Table 138: Global Pathology Devices Industry Volume K Units Forecast, by End-User 2019 & 2032
- Table 139: Global Pathology Devices Industry Revenue Million Forecast, by Country 2019 & 2032
- Table 140: Global Pathology Devices Industry Volume K Units Forecast, by Country 2019 & 2032
- Table 141: Brazil Pathology Devices Industry Revenue (Million) Forecast, by Application 2019 & 2032
- Table 142: Brazil Pathology Devices Industry Volume (K Units) Forecast, by Application 2019 & 2032
- Table 143: Argentina Pathology Devices Industry Revenue (Million) Forecast, by Application 2019 & 2032
- Table 144: Argentina Pathology Devices Industry Volume (K Units) Forecast, by Application 2019 & 2032
- Table 145: Rest of South America Pathology Devices Industry Revenue (Million) Forecast, by Application 2019 & 2032
- Table 146: Rest of South America Pathology Devices Industry Volume (K Units) Forecast, by Application 2019 & 2032
Frequently Asked Questions
1. What is the projected Compound Annual Growth Rate (CAGR) of the Pathology Devices Industry?
The projected CAGR is approximately 6.12%.
2. Which companies are prominent players in the Pathology Devices Industry?
Key companies in the market include Becton Dickinson and Company, Beckman Coulter Inc, Ortho-Clinical Diagnostics, Abbott Laboratories, Danaher Corporation, Hamamatsu Photonics, F Hoffmann-La Roche AG, Mikroscan Technologies, Bio-Rad Laboratories, Siemens Healthineers, Thermo Fisher Scientific, Definiens.
3. What are the main segments of the Pathology Devices Industry?
The market segments include Technology, Application, End-User.
4. Can you provide details about the market size?
The market size is estimated to be USD 6.18 Million as of 2022.
5. What are some drivers contributing to market growth?
Increasing Prevalence of Chronic and Infectious Diseases; Technological Advancements in Pathology Devices; Increasing Investment in Healthcare Infrastructure in Developing Countries.
6. What are the notable trends driving market growth?
Molecular Diagnostics Segment is Expected to Hold Significant Market Share Over the Forecast Period.
7. Are there any restraints impacting market growth?
High Cost of Devices; Stringent Regulations and Lack of Skilled Professionals.
8. Can you provide examples of recent developments in the market?
September 2022: Sysmex Corporation launched UF-1500 fully automated urine particle analyzer (UF-1500), a new product for use in urine sediment testing. This launch assists the company in expanding its product lineup and delivering a wide range of solutions to customers.
9. What pricing options are available for accessing the report?
Pricing options include single-user, multi-user, and enterprise licenses priced at USD 4750, USD 5250, and USD 8750 respectively.
10. Is the market size provided in terms of value or volume?
The market size is provided in terms of value, measured in Million and volume, measured in K Units.
11. Are there any specific market keywords associated with the report?
Yes, the market keyword associated with the report is "Pathology Devices Industry," which aids in identifying and referencing the specific market segment covered.
12. How do I determine which pricing option suits my needs best?
The pricing options vary based on user requirements and access needs. Individual users may opt for single-user licenses, while businesses requiring broader access may choose multi-user or enterprise licenses for cost-effective access to the report.
13. Are there any additional resources or data provided in the Pathology Devices Industry report?
While the report offers comprehensive insights, it's advisable to review the specific contents or supplementary materials provided to ascertain if additional resources or data are available.
14. How can I stay updated on further developments or reports in the Pathology Devices Industry?
To stay informed about further developments, trends, and reports in the Pathology Devices Industry, consider subscribing to industry newsletters, following relevant companies and organizations, or regularly checking reputable industry news sources and publications.
Methodology
Step 1 - Identification of Relevant Samples Size from Population Database


Step 2 - Approaches for Defining Global Market Size (Value, Volume* & Price*)

Note*: In applicable scenarios
Step 3 - Data Sources
Primary Research
- Web Analytics
- Survey Reports
- Research Institute
- Latest Research Reports
- Opinion Leaders
Secondary Research
- Annual Reports
- White Paper
- Latest Press Release
- Industry Association
- Paid Database
- Investor Presentations

Step 4 - Data Triangulation
Involves using different sources of information in order to increase the validity of a study
These sources are likely to be stakeholders in a program - participants, other researchers, program staff, other community members, and so on.
Then we put all data in single framework & apply various statistical tools to find out the dynamic on the market.
During the analysis stage, feedback from the stakeholder groups would be compared to determine areas of agreement as well as areas of divergence


