Peas Industry Dynamics and Forecasts: 2025-2033 Strategic Insights

Peas Industry by Production Analysis, by Consumption Analysis, by Import Market Analysis (Value & Volume), by Export Market Analysis (Value & Volume), by Price Trend Analysis, by North America (United States, Canada), by Europe (Russia, United Kingdom, France, Ukraine), by Asia Pacific (China, Australia, India), by South America (Brazil, Argentina), by Africa (South Africa, Egypt) Forecast 2025-2033

Jun 26 2025
Base Year: 2024

180 Pages
Main Logo

Peas Industry Dynamics and Forecasts: 2025-2033 Strategic Insights


Home
Industries
Agriculture
sponsor image

Tailored for you

  • In-depth Analysis Tailored to Specified Regions or Segments
  • Company Profiles Customized to User Preferences
  • Comprehensive Insights Focused on Specific Segments or Regions
  • Customized Evaluation of Competitive Landscape to Meet Your Needs
  • Tailored Customization to Address Other Specific Requirements
Ask for customization


Key Insights

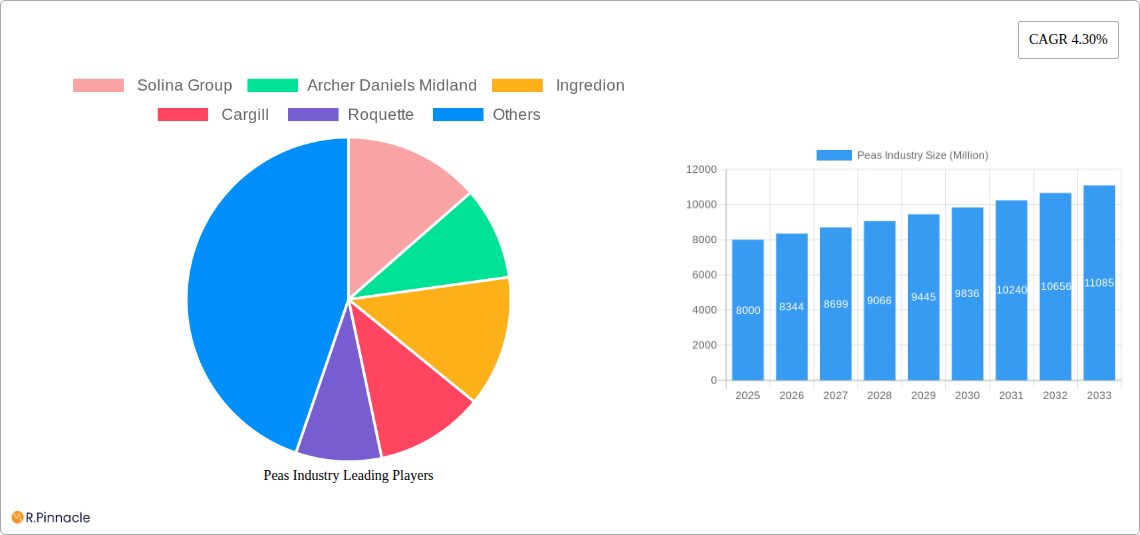
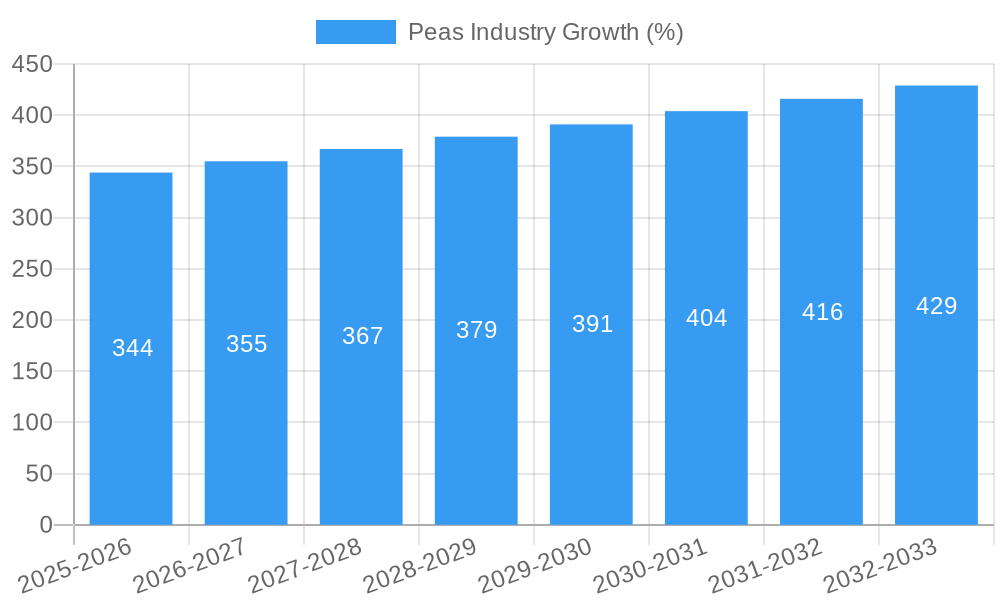
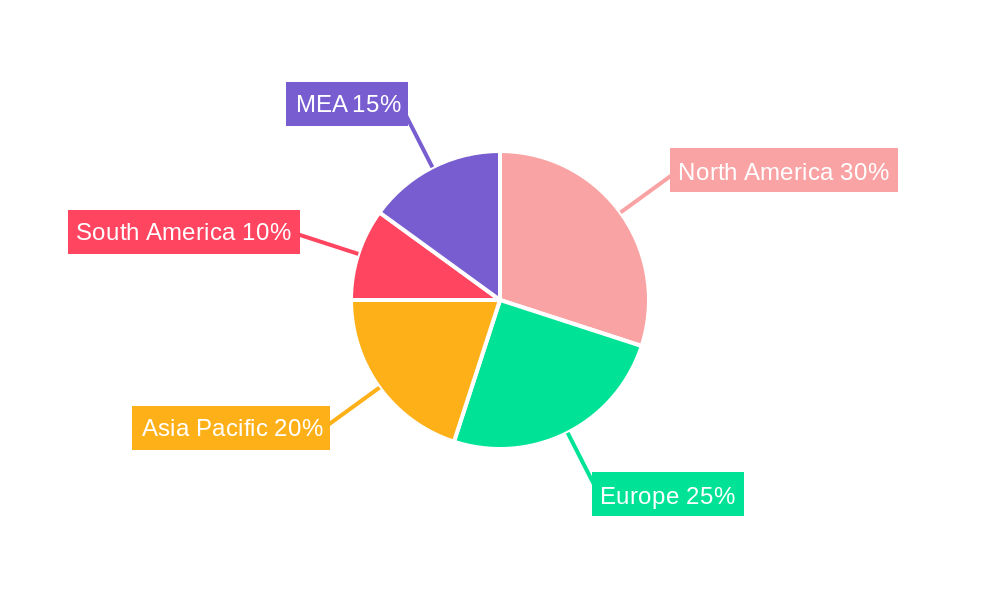
The global peas market, valued at approximately $8 billion in 2025, is projected to experience steady growth, exhibiting a compound annual growth rate (CAGR) of 4.30% from 2025 to 2033. This expansion is driven by several key factors. The rising demand for plant-based proteins is fueling increased consumption of pea protein, a key segment within the market. Growing awareness of the health benefits associated with peas, including their high fiber and protein content, is further contributing to market growth. Additionally, the diversification of pea applications beyond traditional food uses into animal feed and biofuel production is creating new avenues for market expansion. Major players like Solina Group, Archer Daniels Midland, Ingredion, Cargill, and Roquette are actively shaping market dynamics through innovation and strategic investments. Geographical variations exist, with North America and Europe currently holding significant market shares, but the Asia-Pacific region is anticipated to demonstrate robust growth in the coming years, driven by rising populations and changing dietary preferences.

However, market growth faces certain challenges. Fluctuations in agricultural yields due to climate change and pest infestations pose a risk to supply chain stability. Price volatility in raw materials and the increasing competition from other legume crops can also influence market dynamics. Despite these restraints, the overall outlook for the peas market remains positive, with significant opportunities for growth driven by the expanding applications of pea-derived products in diverse sectors, including food processing, animal feed manufacturing, and biofuel industries. The increasing focus on sustainability and the development of innovative pea-based products will likely further accelerate market growth throughout the forecast period.

Peas Industry Research Report - Market Size, Growth & Forecast

Peas Industry Market Report: 2019-2033

This comprehensive report provides a detailed analysis of the global peas industry, projecting a market value exceeding $XX Million by 2033. It covers historical data (2019-2024), the base year (2025), and forecasts (2025-2033), offering actionable insights for industry professionals, investors, and stakeholders. The report leverages key data and trends to help you understand market dynamics, identify opportunities, and make informed strategic decisions.

Peas Industry Market Structure & Innovation Trends

This section analyzes the competitive landscape of the peas industry, examining market concentration, innovation drivers, regulatory aspects, and M&A activities from 2019-2024. Key players such as Solina Group, Archer Daniels Midland, Ingredion, Cargill, and Roquette are examined for their market share and contributions to innovation.

  • Market Concentration: The peas market exhibits a moderately concentrated structure, with the top five players holding an estimated XX% market share in 2024. This is driven by economies of scale and established distribution networks.
  • Innovation Drivers: Growing consumer demand for plant-based protein and sustainable food sources fuels innovation in pea protein extraction and processing technologies. Regulatory changes promoting sustainable agriculture are further accelerating innovation.
  • Regulatory Framework: Varying food safety regulations across different regions impact the market dynamics, driving the need for compliance and standardization.
  • Product Substitutes: Other legumes and protein sources like soy and lentils pose some competitive pressure.
  • End-User Demographics: The increasing awareness of health and dietary benefits drives demand from health-conscious consumers.
  • M&A Activities: The historical period (2019-2024) saw a moderate level of M&A activity, with total deal values estimated at $XX Million. These activities primarily aimed at expanding market reach and gaining access to new technologies.
Peas Industry Growth

Peas Industry Market Dynamics & Trends

This section explores the market's growth drivers, technological disruptions, consumer preferences, and competitive dynamics, providing insights into the overall market trajectory. The report projects a CAGR of XX% from 2025 to 2033, with market penetration in key segments analyzed in detail. The shift towards plant-based diets, growing health consciousness, and technological advancements in pea processing technologies are driving significant growth. The competitive landscape is characterized by both established players and emerging companies, leading to price competition and the development of value-added products.

Peas Industry Growth

Dominant Regions & Segments in Peas Industry

This section identifies the leading regions and segments within the peas industry based on product type (Dry Peas, Green Peas, Pea Protein, Pea Starch) and end-use (Food, Feed, Biofuels). A detailed analysis highlights the factors driving dominance in these areas.

  • Dominant Region: [Insert Dominant Region, e.g., North America] is projected to remain the leading region due to high consumption of pea-based products and favorable government policies.
  • Key Drivers:
    • Strong consumer demand for plant-based foods.
    • Well-established food processing infrastructure.
    • Favorable government regulations promoting sustainable agriculture.
  • Dominant Segment (Product Type): Pea protein is expected to be the fastest-growing segment due to its functional and nutritional properties.
  • Dominant Segment (End-Use): The food sector is the largest end-use segment, driven by increasing demand for plant-based meat alternatives and protein-rich snacks.

Peas Industry Product Innovations

The peas industry witnesses continuous product development driven by technological advancements in extraction, processing, and formulation techniques. New product formats like pea-based protein powders, snacks, and meat alternatives are gaining traction. Innovations focus on enhancing taste, texture, and functionality while ensuring cost-effectiveness. The market is witnessing an increase in organic and sustainably sourced pea products.

Report Scope & Segmentation Analysis

The report segments the peas market by product type (Dry Peas, Green Peas, Pea Protein, Pea Starch) and end-use (Food, Feed, Biofuels). Each segment's growth projections, market size, and competitive dynamics are analyzed in detail. For example, the pea protein segment exhibits high growth potential due to rising demand for plant-based proteins. The food segment is the largest end-use application, while the biofuels segment is an emerging area of focus.

Key Drivers of Peas Industry Growth

The peas industry's growth is fueled by several factors. Increasing consumer preference for plant-based diets, growing awareness of health benefits, technological advancements in processing and extraction, and government initiatives promoting sustainable agriculture are all key contributors. Additionally, the rising demand for pea protein in food and beverage applications is a significant growth driver.

Challenges in the Peas Industry Sector

Despite the positive outlook, challenges persist. Supply chain disruptions, price volatility of raw materials, stringent food safety regulations, and competition from other protein sources are key obstacles. Furthermore, the seasonal nature of pea cultivation can impact production volumes.

Emerging Opportunities in Peas Industry

The market presents significant opportunities. Expanding into new markets with high growth potential, developing innovative products with enhanced functionalities, and leveraging technological advancements in processing and formulation offer avenues for growth. Furthermore, tapping into the growing demand for sustainable and organic pea products presents significant prospects.

Leading Players in the Peas Industry Market

  • Solina Group
  • Archer Daniels Midland
  • Ingredion
  • Cargill
  • Roquette

Key Developments in Peas Industry

  • October 2022: Roquette launched a new line of organic pea ingredients, including starch and protein, in North America and Europe.
  • September 2022: Agriculture Victoria released two new high-yielding pea varieties, PBA Noosa and PBA Taylor, addressing virus resistance needs.
  • March 2022: Birsa Agriculture University developed a new pest and disease-resistant pea variety, Birsa Matar-1, suitable for Jharkhand, India's climate.

Future Outlook for Peas Industry Market

The peas industry anticipates strong growth, driven by sustained consumer demand for plant-based foods and technological advancements. Strategic partnerships, product diversification, and expansion into new markets are expected to further enhance growth prospects. The market is poised for significant expansion in the coming years.

Peas Industry Segmentation

  • 1. Production Analysis
  • 2. Consumption Analysis
  • 3. Import Market Analysis (Value & Volume)
  • 4. Export Market Analysis (Value & Volume)
  • 5. Price Trend Analysis

Peas Industry Segmentation By Geography

  • 1. North America
    • 1.1. United States
    • 1.2. Canada
  • 2. Europe
    • 2.1. Russia
    • 2.2. United Kingdom
    • 2.3. France
    • 2.4. Ukraine
  • 3. Asia Pacific
    • 3.1. China
    • 3.2. Australia
    • 3.3. India
  • 4. South America
    • 4.1. Brazil
    • 4.2. Argentina
  • 5. Africa
    • 5.1. South Africa
    • 5.2. Egypt
Peas Industry Regional Share


Peas Industry REPORT HIGHLIGHTS

AspectsDetails
Study Period 2019-2033
Base Year 2024
Estimated Year 2025
Forecast Period2025-2033
Historical Period2019-2024
Growth RateCAGR of 4.30% from 2019-2033
Segmentation
    • By Production Analysis
    • By Consumption Analysis
    • By Import Market Analysis (Value & Volume)
    • By Export Market Analysis (Value & Volume)
    • By Price Trend Analysis
  • By Geography
    • North America
      • United States
      • Canada
    • Europe
      • Russia
      • United Kingdom
      • France
      • Ukraine
    • Asia Pacific
      • China
      • Australia
      • India
    • South America
      • Brazil
      • Argentina
    • Africa
      • South Africa
      • Egypt


Table of Contents

  1. 1. Introduction
    • 1.1. Research Scope
    • 1.2. Market Segmentation
    • 1.3. Research Methodology
    • 1.4. Definitions and Assumptions
  2. 2. Executive Summary
    • 2.1. Introduction
  3. 3. Market Dynamics
    • 3.1. Introduction
      • 3.2. Market Drivers
        • 3.2.1. Rising Consumption of Cashew Nuts in the Country; Favorable Government Initiatives
      • 3.3. Market Restrains
        • 3.3.1. Hazardous Climatic Condition Hinders Cashew Production; Stringent Regulations Related to Food Quality Standards
      • 3.4. Market Trends
        • 3.4.1. Growing Demand for Pea Protein Consumption
  4. 4. Market Factor Analysis
    • 4.1. Porters Five Forces
    • 4.2. Supply/Value Chain
    • 4.3. PESTEL analysis
    • 4.4. Market Entropy
    • 4.5. Patent/Trademark Analysis
  5. 5. Global Peas Industry Analysis, Insights and Forecast, 2019-2031
    • 5.1. Market Analysis, Insights and Forecast - by Production Analysis
      • 5.2. Market Analysis, Insights and Forecast - by Consumption Analysis
        • 5.3. Market Analysis, Insights and Forecast - by Import Market Analysis (Value & Volume)
          • 5.4. Market Analysis, Insights and Forecast - by Export Market Analysis (Value & Volume)
            • 5.5. Market Analysis, Insights and Forecast - by Price Trend Analysis
              • 5.6. Market Analysis, Insights and Forecast - by Region
                • 5.6.1. North America
                • 5.6.2. Europe
                • 5.6.3. Asia Pacific
                • 5.6.4. South America
                • 5.6.5. Africa
            • 6. North America Peas Industry Analysis, Insights and Forecast, 2019-2031
              • 6.1. Market Analysis, Insights and Forecast - by Production Analysis
                • 6.2. Market Analysis, Insights and Forecast - by Consumption Analysis
                  • 6.3. Market Analysis, Insights and Forecast - by Import Market Analysis (Value & Volume)
                    • 6.4. Market Analysis, Insights and Forecast - by Export Market Analysis (Value & Volume)
                      • 6.5. Market Analysis, Insights and Forecast - by Price Trend Analysis
                      • 7. Europe Peas Industry Analysis, Insights and Forecast, 2019-2031
                        • 7.1. Market Analysis, Insights and Forecast - by Production Analysis
                          • 7.2. Market Analysis, Insights and Forecast - by Consumption Analysis
                            • 7.3. Market Analysis, Insights and Forecast - by Import Market Analysis (Value & Volume)
                              • 7.4. Market Analysis, Insights and Forecast - by Export Market Analysis (Value & Volume)
                                • 7.5. Market Analysis, Insights and Forecast - by Price Trend Analysis
                                • 8. Asia Pacific Peas Industry Analysis, Insights and Forecast, 2019-2031
                                  • 8.1. Market Analysis, Insights and Forecast - by Production Analysis
                                    • 8.2. Market Analysis, Insights and Forecast - by Consumption Analysis
                                      • 8.3. Market Analysis, Insights and Forecast - by Import Market Analysis (Value & Volume)
                                        • 8.4. Market Analysis, Insights and Forecast - by Export Market Analysis (Value & Volume)
                                          • 8.5. Market Analysis, Insights and Forecast - by Price Trend Analysis
                                          • 9. South America Peas Industry Analysis, Insights and Forecast, 2019-2031
                                            • 9.1. Market Analysis, Insights and Forecast - by Production Analysis
                                              • 9.2. Market Analysis, Insights and Forecast - by Consumption Analysis
                                                • 9.3. Market Analysis, Insights and Forecast - by Import Market Analysis (Value & Volume)
                                                  • 9.4. Market Analysis, Insights and Forecast - by Export Market Analysis (Value & Volume)
                                                    • 9.5. Market Analysis, Insights and Forecast - by Price Trend Analysis
                                                    • 10. Africa Peas Industry Analysis, Insights and Forecast, 2019-2031
                                                      • 10.1. Market Analysis, Insights and Forecast - by Production Analysis
                                                        • 10.2. Market Analysis, Insights and Forecast - by Consumption Analysis
                                                          • 10.3. Market Analysis, Insights and Forecast - by Import Market Analysis (Value & Volume)
                                                            • 10.4. Market Analysis, Insights and Forecast - by Export Market Analysis (Value & Volume)
                                                              • 10.5. Market Analysis, Insights and Forecast - by Price Trend Analysis
                                                              • 11. South America Peas Industry Analysis, Insights and Forecast, 2019-2031
                                                                  • 11.1. Market Analysis, Insights and Forecast - By Country/Sub-region
                                                                    • 11.1.1 Brazil
                                                                    • 11.1.2 Argentina
                                                                    • 11.1.3 Rest of South America
                                                              • 12. North America Peas Industry Analysis, Insights and Forecast, 2019-2031
                                                                  • 12.1. Market Analysis, Insights and Forecast - By Country/Sub-region
                                                                    • 12.1.1 United States
                                                                    • 12.1.2 Canada
                                                                    • 12.1.3 Mexico
                                                              • 13. Asia Pacific Peas Industry Analysis, Insights and Forecast, 2019-2031
                                                                  • 13.1. Market Analysis, Insights and Forecast - By Country/Sub-region
                                                                    • 13.1.1 China
                                                                    • 13.1.2 India
                                                                    • 13.1.3 Japan
                                                                    • 13.1.4 South Korea
                                                                    • 13.1.5 ASEAN
                                                                    • 13.1.6 Oceania
                                                                    • 13.1.7 Rest of Asia Pacific
                                                              • 14. Europe Peas Industry Analysis, Insights and Forecast, 2019-2031
                                                                  • 14.1. Market Analysis, Insights and Forecast - By Country/Sub-region
                                                                    • 14.1.1 Germany
                                                                    • 14.1.2 France
                                                                    • 14.1.3 Italy
                                                                    • 14.1.4 United Kingdom
                                                                    • 14.1.5 Netherlands
                                                                    • 14.1.6 Rest of Europe
                                                              • 15. MEA Peas Industry Analysis, Insights and Forecast, 2019-2031
                                                                  • 15.1. Market Analysis, Insights and Forecast - By Country/Sub-region
                                                                    • 15.1.1 Middle East
                                                                    • 15.1.2 Africa
                                                              • 16. Competitive Analysis
                                                                • 16.1. Global Market Share Analysis 2024
                                                                  • 16.2. Company Profiles
                                                                    • 16.2.1 Solina Group
                                                                      • 16.2.1.1. Overview
                                                                      • 16.2.1.2. Products
                                                                      • 16.2.1.3. SWOT Analysis
                                                                      • 16.2.1.4. Recent Developments
                                                                      • 16.2.1.5. Financials (Based on Availability)
                                                                    • 16.2.2 Archer Daniels Midland
                                                                      • 16.2.2.1. Overview
                                                                      • 16.2.2.2. Products
                                                                      • 16.2.2.3. SWOT Analysis
                                                                      • 16.2.2.4. Recent Developments
                                                                      • 16.2.2.5. Financials (Based on Availability)
                                                                    • 16.2.3 Ingredion
                                                                      • 16.2.3.1. Overview
                                                                      • 16.2.3.2. Products
                                                                      • 16.2.3.3. SWOT Analysis
                                                                      • 16.2.3.4. Recent Developments
                                                                      • 16.2.3.5. Financials (Based on Availability)
                                                                    • 16.2.4 Cargill
                                                                      • 16.2.4.1. Overview
                                                                      • 16.2.4.2. Products
                                                                      • 16.2.4.3. SWOT Analysis
                                                                      • 16.2.4.4. Recent Developments
                                                                      • 16.2.4.5. Financials (Based on Availability)
                                                                    • 16.2.5 Roquette
                                                                      • 16.2.5.1. Overview
                                                                      • 16.2.5.2. Products
                                                                      • 16.2.5.3. SWOT Analysis
                                                                      • 16.2.5.4. Recent Developments
                                                                      • 16.2.5.5. Financials (Based on Availability)

                                                              List of Figures

                                                              1. Figure 1: Global Peas Industry Revenue Breakdown (Million, %) by Region 2024 & 2032
                                                              2. Figure 2: Global Peas Industry Volume Breakdown (Kiloton, %) by Region 2024 & 2032
                                                              3. Figure 3: South America Peas Industry Revenue (Million), by Country 2024 & 2032
                                                              4. Figure 4: South America Peas Industry Volume (Kiloton), by Country 2024 & 2032
                                                              5. Figure 5: South America Peas Industry Revenue Share (%), by Country 2024 & 2032
                                                              6. Figure 6: South America Peas Industry Volume Share (%), by Country 2024 & 2032
                                                              7. Figure 7: North America Peas Industry Revenue (Million), by Country 2024 & 2032
                                                              8. Figure 8: North America Peas Industry Volume (Kiloton), by Country 2024 & 2032
                                                              9. Figure 9: North America Peas Industry Revenue Share (%), by Country 2024 & 2032
                                                              10. Figure 10: North America Peas Industry Volume Share (%), by Country 2024 & 2032
                                                              11. Figure 11: Asia Pacific Peas Industry Revenue (Million), by Country 2024 & 2032
                                                              12. Figure 12: Asia Pacific Peas Industry Volume (Kiloton), by Country 2024 & 2032
                                                              13. Figure 13: Asia Pacific Peas Industry Revenue Share (%), by Country 2024 & 2032
                                                              14. Figure 14: Asia Pacific Peas Industry Volume Share (%), by Country 2024 & 2032
                                                              15. Figure 15: Europe Peas Industry Revenue (Million), by Country 2024 & 2032
                                                              16. Figure 16: Europe Peas Industry Volume (Kiloton), by Country 2024 & 2032
                                                              17. Figure 17: Europe Peas Industry Revenue Share (%), by Country 2024 & 2032
                                                              18. Figure 18: Europe Peas Industry Volume Share (%), by Country 2024 & 2032
                                                              19. Figure 19: MEA Peas Industry Revenue (Million), by Country 2024 & 2032
                                                              20. Figure 20: MEA Peas Industry Volume (Kiloton), by Country 2024 & 2032
                                                              21. Figure 21: MEA Peas Industry Revenue Share (%), by Country 2024 & 2032
                                                              22. Figure 22: MEA Peas Industry Volume Share (%), by Country 2024 & 2032
                                                              23. Figure 23: North America Peas Industry Revenue (Million), by Production Analysis 2024 & 2032
                                                              24. Figure 24: North America Peas Industry Volume (Kiloton), by Production Analysis 2024 & 2032
                                                              25. Figure 25: North America Peas Industry Revenue Share (%), by Production Analysis 2024 & 2032
                                                              26. Figure 26: North America Peas Industry Volume Share (%), by Production Analysis 2024 & 2032
                                                              27. Figure 27: North America Peas Industry Revenue (Million), by Consumption Analysis 2024 & 2032
                                                              28. Figure 28: North America Peas Industry Volume (Kiloton), by Consumption Analysis 2024 & 2032
                                                              29. Figure 29: North America Peas Industry Revenue Share (%), by Consumption Analysis 2024 & 2032
                                                              30. Figure 30: North America Peas Industry Volume Share (%), by Consumption Analysis 2024 & 2032
                                                              31. Figure 31: North America Peas Industry Revenue (Million), by Import Market Analysis (Value & Volume) 2024 & 2032
                                                              32. Figure 32: North America Peas Industry Volume (Kiloton), by Import Market Analysis (Value & Volume) 2024 & 2032
                                                              33. Figure 33: North America Peas Industry Revenue Share (%), by Import Market Analysis (Value & Volume) 2024 & 2032
                                                              34. Figure 34: North America Peas Industry Volume Share (%), by Import Market Analysis (Value & Volume) 2024 & 2032
                                                              35. Figure 35: North America Peas Industry Revenue (Million), by Export Market Analysis (Value & Volume) 2024 & 2032
                                                              36. Figure 36: North America Peas Industry Volume (Kiloton), by Export Market Analysis (Value & Volume) 2024 & 2032
                                                              37. Figure 37: North America Peas Industry Revenue Share (%), by Export Market Analysis (Value & Volume) 2024 & 2032
                                                              38. Figure 38: North America Peas Industry Volume Share (%), by Export Market Analysis (Value & Volume) 2024 & 2032
                                                              39. Figure 39: North America Peas Industry Revenue (Million), by Price Trend Analysis 2024 & 2032
                                                              40. Figure 40: North America Peas Industry Volume (Kiloton), by Price Trend Analysis 2024 & 2032
                                                              41. Figure 41: North America Peas Industry Revenue Share (%), by Price Trend Analysis 2024 & 2032
                                                              42. Figure 42: North America Peas Industry Volume Share (%), by Price Trend Analysis 2024 & 2032
                                                              43. Figure 43: North America Peas Industry Revenue (Million), by Country 2024 & 2032
                                                              44. Figure 44: North America Peas Industry Volume (Kiloton), by Country 2024 & 2032
                                                              45. Figure 45: North America Peas Industry Revenue Share (%), by Country 2024 & 2032
                                                              46. Figure 46: North America Peas Industry Volume Share (%), by Country 2024 & 2032
                                                              47. Figure 47: Europe Peas Industry Revenue (Million), by Production Analysis 2024 & 2032
                                                              48. Figure 48: Europe Peas Industry Volume (Kiloton), by Production Analysis 2024 & 2032
                                                              49. Figure 49: Europe Peas Industry Revenue Share (%), by Production Analysis 2024 & 2032
                                                              50. Figure 50: Europe Peas Industry Volume Share (%), by Production Analysis 2024 & 2032
                                                              51. Figure 51: Europe Peas Industry Revenue (Million), by Consumption Analysis 2024 & 2032
                                                              52. Figure 52: Europe Peas Industry Volume (Kiloton), by Consumption Analysis 2024 & 2032
                                                              53. Figure 53: Europe Peas Industry Revenue Share (%), by Consumption Analysis 2024 & 2032
                                                              54. Figure 54: Europe Peas Industry Volume Share (%), by Consumption Analysis 2024 & 2032
                                                              55. Figure 55: Europe Peas Industry Revenue (Million), by Import Market Analysis (Value & Volume) 2024 & 2032
                                                              56. Figure 56: Europe Peas Industry Volume (Kiloton), by Import Market Analysis (Value & Volume) 2024 & 2032
                                                              57. Figure 57: Europe Peas Industry Revenue Share (%), by Import Market Analysis (Value & Volume) 2024 & 2032
                                                              58. Figure 58: Europe Peas Industry Volume Share (%), by Import Market Analysis (Value & Volume) 2024 & 2032
                                                              59. Figure 59: Europe Peas Industry Revenue (Million), by Export Market Analysis (Value & Volume) 2024 & 2032
                                                              60. Figure 60: Europe Peas Industry Volume (Kiloton), by Export Market Analysis (Value & Volume) 2024 & 2032
                                                              61. Figure 61: Europe Peas Industry Revenue Share (%), by Export Market Analysis (Value & Volume) 2024 & 2032
                                                              62. Figure 62: Europe Peas Industry Volume Share (%), by Export Market Analysis (Value & Volume) 2024 & 2032
                                                              63. Figure 63: Europe Peas Industry Revenue (Million), by Price Trend Analysis 2024 & 2032
                                                              64. Figure 64: Europe Peas Industry Volume (Kiloton), by Price Trend Analysis 2024 & 2032
                                                              65. Figure 65: Europe Peas Industry Revenue Share (%), by Price Trend Analysis 2024 & 2032
                                                              66. Figure 66: Europe Peas Industry Volume Share (%), by Price Trend Analysis 2024 & 2032
                                                              67. Figure 67: Europe Peas Industry Revenue (Million), by Country 2024 & 2032
                                                              68. Figure 68: Europe Peas Industry Volume (Kiloton), by Country 2024 & 2032
                                                              69. Figure 69: Europe Peas Industry Revenue Share (%), by Country 2024 & 2032
                                                              70. Figure 70: Europe Peas Industry Volume Share (%), by Country 2024 & 2032
                                                              71. Figure 71: Asia Pacific Peas Industry Revenue (Million), by Production Analysis 2024 & 2032
                                                              72. Figure 72: Asia Pacific Peas Industry Volume (Kiloton), by Production Analysis 2024 & 2032
                                                              73. Figure 73: Asia Pacific Peas Industry Revenue Share (%), by Production Analysis 2024 & 2032
                                                              74. Figure 74: Asia Pacific Peas Industry Volume Share (%), by Production Analysis 2024 & 2032
                                                              75. Figure 75: Asia Pacific Peas Industry Revenue (Million), by Consumption Analysis 2024 & 2032
                                                              76. Figure 76: Asia Pacific Peas Industry Volume (Kiloton), by Consumption Analysis 2024 & 2032
                                                              77. Figure 77: Asia Pacific Peas Industry Revenue Share (%), by Consumption Analysis 2024 & 2032
                                                              78. Figure 78: Asia Pacific Peas Industry Volume Share (%), by Consumption Analysis 2024 & 2032
                                                              79. Figure 79: Asia Pacific Peas Industry Revenue (Million), by Import Market Analysis (Value & Volume) 2024 & 2032
                                                              80. Figure 80: Asia Pacific Peas Industry Volume (Kiloton), by Import Market Analysis (Value & Volume) 2024 & 2032
                                                              81. Figure 81: Asia Pacific Peas Industry Revenue Share (%), by Import Market Analysis (Value & Volume) 2024 & 2032
                                                              82. Figure 82: Asia Pacific Peas Industry Volume Share (%), by Import Market Analysis (Value & Volume) 2024 & 2032
                                                              83. Figure 83: Asia Pacific Peas Industry Revenue (Million), by Export Market Analysis (Value & Volume) 2024 & 2032
                                                              84. Figure 84: Asia Pacific Peas Industry Volume (Kiloton), by Export Market Analysis (Value & Volume) 2024 & 2032
                                                              85. Figure 85: Asia Pacific Peas Industry Revenue Share (%), by Export Market Analysis (Value & Volume) 2024 & 2032
                                                              86. Figure 86: Asia Pacific Peas Industry Volume Share (%), by Export Market Analysis (Value & Volume) 2024 & 2032
                                                              87. Figure 87: Asia Pacific Peas Industry Revenue (Million), by Price Trend Analysis 2024 & 2032
                                                              88. Figure 88: Asia Pacific Peas Industry Volume (Kiloton), by Price Trend Analysis 2024 & 2032
                                                              89. Figure 89: Asia Pacific Peas Industry Revenue Share (%), by Price Trend Analysis 2024 & 2032
                                                              90. Figure 90: Asia Pacific Peas Industry Volume Share (%), by Price Trend Analysis 2024 & 2032
                                                              91. Figure 91: Asia Pacific Peas Industry Revenue (Million), by Country 2024 & 2032
                                                              92. Figure 92: Asia Pacific Peas Industry Volume (Kiloton), by Country 2024 & 2032
                                                              93. Figure 93: Asia Pacific Peas Industry Revenue Share (%), by Country 2024 & 2032
                                                              94. Figure 94: Asia Pacific Peas Industry Volume Share (%), by Country 2024 & 2032
                                                              95. Figure 95: South America Peas Industry Revenue (Million), by Production Analysis 2024 & 2032
                                                              96. Figure 96: South America Peas Industry Volume (Kiloton), by Production Analysis 2024 & 2032
                                                              97. Figure 97: South America Peas Industry Revenue Share (%), by Production Analysis 2024 & 2032
                                                              98. Figure 98: South America Peas Industry Volume Share (%), by Production Analysis 2024 & 2032
                                                              99. Figure 99: South America Peas Industry Revenue (Million), by Consumption Analysis 2024 & 2032
                                                              100. Figure 100: South America Peas Industry Volume (Kiloton), by Consumption Analysis 2024 & 2032
                                                              101. Figure 101: South America Peas Industry Revenue Share (%), by Consumption Analysis 2024 & 2032
                                                              102. Figure 102: South America Peas Industry Volume Share (%), by Consumption Analysis 2024 & 2032
                                                              103. Figure 103: South America Peas Industry Revenue (Million), by Import Market Analysis (Value & Volume) 2024 & 2032
                                                              104. Figure 104: South America Peas Industry Volume (Kiloton), by Import Market Analysis (Value & Volume) 2024 & 2032
                                                              105. Figure 105: South America Peas Industry Revenue Share (%), by Import Market Analysis (Value & Volume) 2024 & 2032
                                                              106. Figure 106: South America Peas Industry Volume Share (%), by Import Market Analysis (Value & Volume) 2024 & 2032
                                                              107. Figure 107: South America Peas Industry Revenue (Million), by Export Market Analysis (Value & Volume) 2024 & 2032
                                                              108. Figure 108: South America Peas Industry Volume (Kiloton), by Export Market Analysis (Value & Volume) 2024 & 2032
                                                              109. Figure 109: South America Peas Industry Revenue Share (%), by Export Market Analysis (Value & Volume) 2024 & 2032
                                                              110. Figure 110: South America Peas Industry Volume Share (%), by Export Market Analysis (Value & Volume) 2024 & 2032
                                                              111. Figure 111: South America Peas Industry Revenue (Million), by Price Trend Analysis 2024 & 2032
                                                              112. Figure 112: South America Peas Industry Volume (Kiloton), by Price Trend Analysis 2024 & 2032
                                                              113. Figure 113: South America Peas Industry Revenue Share (%), by Price Trend Analysis 2024 & 2032
                                                              114. Figure 114: South America Peas Industry Volume Share (%), by Price Trend Analysis 2024 & 2032
                                                              115. Figure 115: South America Peas Industry Revenue (Million), by Country 2024 & 2032
                                                              116. Figure 116: South America Peas Industry Volume (Kiloton), by Country 2024 & 2032
                                                              117. Figure 117: South America Peas Industry Revenue Share (%), by Country 2024 & 2032
                                                              118. Figure 118: South America Peas Industry Volume Share (%), by Country 2024 & 2032
                                                              119. Figure 119: Africa Peas Industry Revenue (Million), by Production Analysis 2024 & 2032
                                                              120. Figure 120: Africa Peas Industry Volume (Kiloton), by Production Analysis 2024 & 2032
                                                              121. Figure 121: Africa Peas Industry Revenue Share (%), by Production Analysis 2024 & 2032
                                                              122. Figure 122: Africa Peas Industry Volume Share (%), by Production Analysis 2024 & 2032
                                                              123. Figure 123: Africa Peas Industry Revenue (Million), by Consumption Analysis 2024 & 2032
                                                              124. Figure 124: Africa Peas Industry Volume (Kiloton), by Consumption Analysis 2024 & 2032
                                                              125. Figure 125: Africa Peas Industry Revenue Share (%), by Consumption Analysis 2024 & 2032
                                                              126. Figure 126: Africa Peas Industry Volume Share (%), by Consumption Analysis 2024 & 2032
                                                              127. Figure 127: Africa Peas Industry Revenue (Million), by Import Market Analysis (Value & Volume) 2024 & 2032
                                                              128. Figure 128: Africa Peas Industry Volume (Kiloton), by Import Market Analysis (Value & Volume) 2024 & 2032
                                                              129. Figure 129: Africa Peas Industry Revenue Share (%), by Import Market Analysis (Value & Volume) 2024 & 2032
                                                              130. Figure 130: Africa Peas Industry Volume Share (%), by Import Market Analysis (Value & Volume) 2024 & 2032
                                                              131. Figure 131: Africa Peas Industry Revenue (Million), by Export Market Analysis (Value & Volume) 2024 & 2032
                                                              132. Figure 132: Africa Peas Industry Volume (Kiloton), by Export Market Analysis (Value & Volume) 2024 & 2032
                                                              133. Figure 133: Africa Peas Industry Revenue Share (%), by Export Market Analysis (Value & Volume) 2024 & 2032
                                                              134. Figure 134: Africa Peas Industry Volume Share (%), by Export Market Analysis (Value & Volume) 2024 & 2032
                                                              135. Figure 135: Africa Peas Industry Revenue (Million), by Price Trend Analysis 2024 & 2032
                                                              136. Figure 136: Africa Peas Industry Volume (Kiloton), by Price Trend Analysis 2024 & 2032
                                                              137. Figure 137: Africa Peas Industry Revenue Share (%), by Price Trend Analysis 2024 & 2032
                                                              138. Figure 138: Africa Peas Industry Volume Share (%), by Price Trend Analysis 2024 & 2032
                                                              139. Figure 139: Africa Peas Industry Revenue (Million), by Country 2024 & 2032
                                                              140. Figure 140: Africa Peas Industry Volume (Kiloton), by Country 2024 & 2032
                                                              141. Figure 141: Africa Peas Industry Revenue Share (%), by Country 2024 & 2032
                                                              142. Figure 142: Africa Peas Industry Volume Share (%), by Country 2024 & 2032

                                                              List of Tables

                                                              1. Table 1: Global Peas Industry Revenue Million Forecast, by Region 2019 & 2032
                                                              2. Table 2: Global Peas Industry Volume Kiloton Forecast, by Region 2019 & 2032
                                                              3. Table 3: Global Peas Industry Revenue Million Forecast, by Production Analysis 2019 & 2032
                                                              4. Table 4: Global Peas Industry Volume Kiloton Forecast, by Production Analysis 2019 & 2032
                                                              5. Table 5: Global Peas Industry Revenue Million Forecast, by Consumption Analysis 2019 & 2032
                                                              6. Table 6: Global Peas Industry Volume Kiloton Forecast, by Consumption Analysis 2019 & 2032
                                                              7. Table 7: Global Peas Industry Revenue Million Forecast, by Import Market Analysis (Value & Volume) 2019 & 2032
                                                              8. Table 8: Global Peas Industry Volume Kiloton Forecast, by Import Market Analysis (Value & Volume) 2019 & 2032
                                                              9. Table 9: Global Peas Industry Revenue Million Forecast, by Export Market Analysis (Value & Volume) 2019 & 2032
                                                              10. Table 10: Global Peas Industry Volume Kiloton Forecast, by Export Market Analysis (Value & Volume) 2019 & 2032
                                                              11. Table 11: Global Peas Industry Revenue Million Forecast, by Price Trend Analysis 2019 & 2032
                                                              12. Table 12: Global Peas Industry Volume Kiloton Forecast, by Price Trend Analysis 2019 & 2032
                                                              13. Table 13: Global Peas Industry Revenue Million Forecast, by Region 2019 & 2032
                                                              14. Table 14: Global Peas Industry Volume Kiloton Forecast, by Region 2019 & 2032
                                                              15. Table 15: Global Peas Industry Revenue Million Forecast, by Country 2019 & 2032
                                                              16. Table 16: Global Peas Industry Volume Kiloton Forecast, by Country 2019 & 2032
                                                              17. Table 17: Brazil Peas Industry Revenue (Million) Forecast, by Application 2019 & 2032
                                                              18. Table 18: Brazil Peas Industry Volume (Kiloton) Forecast, by Application 2019 & 2032
                                                              19. Table 19: Argentina Peas Industry Revenue (Million) Forecast, by Application 2019 & 2032
                                                              20. Table 20: Argentina Peas Industry Volume (Kiloton) Forecast, by Application 2019 & 2032
                                                              21. Table 21: Rest of South America Peas Industry Revenue (Million) Forecast, by Application 2019 & 2032
                                                              22. Table 22: Rest of South America Peas Industry Volume (Kiloton) Forecast, by Application 2019 & 2032
                                                              23. Table 23: Global Peas Industry Revenue Million Forecast, by Country 2019 & 2032
                                                              24. Table 24: Global Peas Industry Volume Kiloton Forecast, by Country 2019 & 2032
                                                              25. Table 25: United States Peas Industry Revenue (Million) Forecast, by Application 2019 & 2032
                                                              26. Table 26: United States Peas Industry Volume (Kiloton) Forecast, by Application 2019 & 2032
                                                              27. Table 27: Canada Peas Industry Revenue (Million) Forecast, by Application 2019 & 2032
                                                              28. Table 28: Canada Peas Industry Volume (Kiloton) Forecast, by Application 2019 & 2032
                                                              29. Table 29: Mexico Peas Industry Revenue (Million) Forecast, by Application 2019 & 2032
                                                              30. Table 30: Mexico Peas Industry Volume (Kiloton) Forecast, by Application 2019 & 2032
                                                              31. Table 31: Global Peas Industry Revenue Million Forecast, by Country 2019 & 2032
                                                              32. Table 32: Global Peas Industry Volume Kiloton Forecast, by Country 2019 & 2032
                                                              33. Table 33: China Peas Industry Revenue (Million) Forecast, by Application 2019 & 2032
                                                              34. Table 34: China Peas Industry Volume (Kiloton) Forecast, by Application 2019 & 2032
                                                              35. Table 35: India Peas Industry Revenue (Million) Forecast, by Application 2019 & 2032
                                                              36. Table 36: India Peas Industry Volume (Kiloton) Forecast, by Application 2019 & 2032
                                                              37. Table 37: Japan Peas Industry Revenue (Million) Forecast, by Application 2019 & 2032
                                                              38. Table 38: Japan Peas Industry Volume (Kiloton) Forecast, by Application 2019 & 2032
                                                              39. Table 39: South Korea Peas Industry Revenue (Million) Forecast, by Application 2019 & 2032
                                                              40. Table 40: South Korea Peas Industry Volume (Kiloton) Forecast, by Application 2019 & 2032
                                                              41. Table 41: ASEAN Peas Industry Revenue (Million) Forecast, by Application 2019 & 2032
                                                              42. Table 42: ASEAN Peas Industry Volume (Kiloton) Forecast, by Application 2019 & 2032
                                                              43. Table 43: Oceania Peas Industry Revenue (Million) Forecast, by Application 2019 & 2032
                                                              44. Table 44: Oceania Peas Industry Volume (Kiloton) Forecast, by Application 2019 & 2032
                                                              45. Table 45: Rest of Asia Pacific Peas Industry Revenue (Million) Forecast, by Application 2019 & 2032
                                                              46. Table 46: Rest of Asia Pacific Peas Industry Volume (Kiloton) Forecast, by Application 2019 & 2032
                                                              47. Table 47: Global Peas Industry Revenue Million Forecast, by Country 2019 & 2032
                                                              48. Table 48: Global Peas Industry Volume Kiloton Forecast, by Country 2019 & 2032
                                                              49. Table 49: Germany Peas Industry Revenue (Million) Forecast, by Application 2019 & 2032
                                                              50. Table 50: Germany Peas Industry Volume (Kiloton) Forecast, by Application 2019 & 2032
                                                              51. Table 51: France Peas Industry Revenue (Million) Forecast, by Application 2019 & 2032
                                                              52. Table 52: France Peas Industry Volume (Kiloton) Forecast, by Application 2019 & 2032
                                                              53. Table 53: Italy Peas Industry Revenue (Million) Forecast, by Application 2019 & 2032
                                                              54. Table 54: Italy Peas Industry Volume (Kiloton) Forecast, by Application 2019 & 2032
                                                              55. Table 55: United Kingdom Peas Industry Revenue (Million) Forecast, by Application 2019 & 2032
                                                              56. Table 56: United Kingdom Peas Industry Volume (Kiloton) Forecast, by Application 2019 & 2032
                                                              57. Table 57: Netherlands Peas Industry Revenue (Million) Forecast, by Application 2019 & 2032
                                                              58. Table 58: Netherlands Peas Industry Volume (Kiloton) Forecast, by Application 2019 & 2032
                                                              59. Table 59: Rest of Europe Peas Industry Revenue (Million) Forecast, by Application 2019 & 2032
                                                              60. Table 60: Rest of Europe Peas Industry Volume (Kiloton) Forecast, by Application 2019 & 2032
                                                              61. Table 61: Global Peas Industry Revenue Million Forecast, by Country 2019 & 2032
                                                              62. Table 62: Global Peas Industry Volume Kiloton Forecast, by Country 2019 & 2032
                                                              63. Table 63: Middle East Peas Industry Revenue (Million) Forecast, by Application 2019 & 2032
                                                              64. Table 64: Middle East Peas Industry Volume (Kiloton) Forecast, by Application 2019 & 2032
                                                              65. Table 65: Africa Peas Industry Revenue (Million) Forecast, by Application 2019 & 2032
                                                              66. Table 66: Africa Peas Industry Volume (Kiloton) Forecast, by Application 2019 & 2032
                                                              67. Table 67: Global Peas Industry Revenue Million Forecast, by Production Analysis 2019 & 2032
                                                              68. Table 68: Global Peas Industry Volume Kiloton Forecast, by Production Analysis 2019 & 2032
                                                              69. Table 69: Global Peas Industry Revenue Million Forecast, by Consumption Analysis 2019 & 2032
                                                              70. Table 70: Global Peas Industry Volume Kiloton Forecast, by Consumption Analysis 2019 & 2032
                                                              71. Table 71: Global Peas Industry Revenue Million Forecast, by Import Market Analysis (Value & Volume) 2019 & 2032
                                                              72. Table 72: Global Peas Industry Volume Kiloton Forecast, by Import Market Analysis (Value & Volume) 2019 & 2032
                                                              73. Table 73: Global Peas Industry Revenue Million Forecast, by Export Market Analysis (Value & Volume) 2019 & 2032
                                                              74. Table 74: Global Peas Industry Volume Kiloton Forecast, by Export Market Analysis (Value & Volume) 2019 & 2032
                                                              75. Table 75: Global Peas Industry Revenue Million Forecast, by Price Trend Analysis 2019 & 2032
                                                              76. Table 76: Global Peas Industry Volume Kiloton Forecast, by Price Trend Analysis 2019 & 2032
                                                              77. Table 77: Global Peas Industry Revenue Million Forecast, by Country 2019 & 2032
                                                              78. Table 78: Global Peas Industry Volume Kiloton Forecast, by Country 2019 & 2032
                                                              79. Table 79: United States Peas Industry Revenue (Million) Forecast, by Application 2019 & 2032
                                                              80. Table 80: United States Peas Industry Volume (Kiloton) Forecast, by Application 2019 & 2032
                                                              81. Table 81: Canada Peas Industry Revenue (Million) Forecast, by Application 2019 & 2032
                                                              82. Table 82: Canada Peas Industry Volume (Kiloton) Forecast, by Application 2019 & 2032
                                                              83. Table 83: Global Peas Industry Revenue Million Forecast, by Production Analysis 2019 & 2032
                                                              84. Table 84: Global Peas Industry Volume Kiloton Forecast, by Production Analysis 2019 & 2032
                                                              85. Table 85: Global Peas Industry Revenue Million Forecast, by Consumption Analysis 2019 & 2032
                                                              86. Table 86: Global Peas Industry Volume Kiloton Forecast, by Consumption Analysis 2019 & 2032
                                                              87. Table 87: Global Peas Industry Revenue Million Forecast, by Import Market Analysis (Value & Volume) 2019 & 2032
                                                              88. Table 88: Global Peas Industry Volume Kiloton Forecast, by Import Market Analysis (Value & Volume) 2019 & 2032
                                                              89. Table 89: Global Peas Industry Revenue Million Forecast, by Export Market Analysis (Value & Volume) 2019 & 2032
                                                              90. Table 90: Global Peas Industry Volume Kiloton Forecast, by Export Market Analysis (Value & Volume) 2019 & 2032
                                                              91. Table 91: Global Peas Industry Revenue Million Forecast, by Price Trend Analysis 2019 & 2032
                                                              92. Table 92: Global Peas Industry Volume Kiloton Forecast, by Price Trend Analysis 2019 & 2032
                                                              93. Table 93: Global Peas Industry Revenue Million Forecast, by Country 2019 & 2032
                                                              94. Table 94: Global Peas Industry Volume Kiloton Forecast, by Country 2019 & 2032
                                                              95. Table 95: Russia Peas Industry Revenue (Million) Forecast, by Application 2019 & 2032
                                                              96. Table 96: Russia Peas Industry Volume (Kiloton) Forecast, by Application 2019 & 2032
                                                              97. Table 97: United Kingdom Peas Industry Revenue (Million) Forecast, by Application 2019 & 2032
                                                              98. Table 98: United Kingdom Peas Industry Volume (Kiloton) Forecast, by Application 2019 & 2032
                                                              99. Table 99: France Peas Industry Revenue (Million) Forecast, by Application 2019 & 2032
                                                              100. Table 100: France Peas Industry Volume (Kiloton) Forecast, by Application 2019 & 2032
                                                              101. Table 101: Ukraine Peas Industry Revenue (Million) Forecast, by Application 2019 & 2032
                                                              102. Table 102: Ukraine Peas Industry Volume (Kiloton) Forecast, by Application 2019 & 2032
                                                              103. Table 103: Global Peas Industry Revenue Million Forecast, by Production Analysis 2019 & 2032
                                                              104. Table 104: Global Peas Industry Volume Kiloton Forecast, by Production Analysis 2019 & 2032
                                                              105. Table 105: Global Peas Industry Revenue Million Forecast, by Consumption Analysis 2019 & 2032
                                                              106. Table 106: Global Peas Industry Volume Kiloton Forecast, by Consumption Analysis 2019 & 2032
                                                              107. Table 107: Global Peas Industry Revenue Million Forecast, by Import Market Analysis (Value & Volume) 2019 & 2032
                                                              108. Table 108: Global Peas Industry Volume Kiloton Forecast, by Import Market Analysis (Value & Volume) 2019 & 2032
                                                              109. Table 109: Global Peas Industry Revenue Million Forecast, by Export Market Analysis (Value & Volume) 2019 & 2032
                                                              110. Table 110: Global Peas Industry Volume Kiloton Forecast, by Export Market Analysis (Value & Volume) 2019 & 2032
                                                              111. Table 111: Global Peas Industry Revenue Million Forecast, by Price Trend Analysis 2019 & 2032
                                                              112. Table 112: Global Peas Industry Volume Kiloton Forecast, by Price Trend Analysis 2019 & 2032
                                                              113. Table 113: Global Peas Industry Revenue Million Forecast, by Country 2019 & 2032
                                                              114. Table 114: Global Peas Industry Volume Kiloton Forecast, by Country 2019 & 2032
                                                              115. Table 115: China Peas Industry Revenue (Million) Forecast, by Application 2019 & 2032
                                                              116. Table 116: China Peas Industry Volume (Kiloton) Forecast, by Application 2019 & 2032
                                                              117. Table 117: Australia Peas Industry Revenue (Million) Forecast, by Application 2019 & 2032
                                                              118. Table 118: Australia Peas Industry Volume (Kiloton) Forecast, by Application 2019 & 2032
                                                              119. Table 119: India Peas Industry Revenue (Million) Forecast, by Application 2019 & 2032
                                                              120. Table 120: India Peas Industry Volume (Kiloton) Forecast, by Application 2019 & 2032
                                                              121. Table 121: Global Peas Industry Revenue Million Forecast, by Production Analysis 2019 & 2032
                                                              122. Table 122: Global Peas Industry Volume Kiloton Forecast, by Production Analysis 2019 & 2032
                                                              123. Table 123: Global Peas Industry Revenue Million Forecast, by Consumption Analysis 2019 & 2032
                                                              124. Table 124: Global Peas Industry Volume Kiloton Forecast, by Consumption Analysis 2019 & 2032
                                                              125. Table 125: Global Peas Industry Revenue Million Forecast, by Import Market Analysis (Value & Volume) 2019 & 2032
                                                              126. Table 126: Global Peas Industry Volume Kiloton Forecast, by Import Market Analysis (Value & Volume) 2019 & 2032
                                                              127. Table 127: Global Peas Industry Revenue Million Forecast, by Export Market Analysis (Value & Volume) 2019 & 2032
                                                              128. Table 128: Global Peas Industry Volume Kiloton Forecast, by Export Market Analysis (Value & Volume) 2019 & 2032
                                                              129. Table 129: Global Peas Industry Revenue Million Forecast, by Price Trend Analysis 2019 & 2032
                                                              130. Table 130: Global Peas Industry Volume Kiloton Forecast, by Price Trend Analysis 2019 & 2032
                                                              131. Table 131: Global Peas Industry Revenue Million Forecast, by Country 2019 & 2032
                                                              132. Table 132: Global Peas Industry Volume Kiloton Forecast, by Country 2019 & 2032
                                                              133. Table 133: Brazil Peas Industry Revenue (Million) Forecast, by Application 2019 & 2032
                                                              134. Table 134: Brazil Peas Industry Volume (Kiloton) Forecast, by Application 2019 & 2032
                                                              135. Table 135: Argentina Peas Industry Revenue (Million) Forecast, by Application 2019 & 2032
                                                              136. Table 136: Argentina Peas Industry Volume (Kiloton) Forecast, by Application 2019 & 2032
                                                              137. Table 137: Global Peas Industry Revenue Million Forecast, by Production Analysis 2019 & 2032
                                                              138. Table 138: Global Peas Industry Volume Kiloton Forecast, by Production Analysis 2019 & 2032
                                                              139. Table 139: Global Peas Industry Revenue Million Forecast, by Consumption Analysis 2019 & 2032
                                                              140. Table 140: Global Peas Industry Volume Kiloton Forecast, by Consumption Analysis 2019 & 2032
                                                              141. Table 141: Global Peas Industry Revenue Million Forecast, by Import Market Analysis (Value & Volume) 2019 & 2032
                                                              142. Table 142: Global Peas Industry Volume Kiloton Forecast, by Import Market Analysis (Value & Volume) 2019 & 2032
                                                              143. Table 143: Global Peas Industry Revenue Million Forecast, by Export Market Analysis (Value & Volume) 2019 & 2032
                                                              144. Table 144: Global Peas Industry Volume Kiloton Forecast, by Export Market Analysis (Value & Volume) 2019 & 2032
                                                              145. Table 145: Global Peas Industry Revenue Million Forecast, by Price Trend Analysis 2019 & 2032
                                                              146. Table 146: Global Peas Industry Volume Kiloton Forecast, by Price Trend Analysis 2019 & 2032
                                                              147. Table 147: Global Peas Industry Revenue Million Forecast, by Country 2019 & 2032
                                                              148. Table 148: Global Peas Industry Volume Kiloton Forecast, by Country 2019 & 2032
                                                              149. Table 149: South Africa Peas Industry Revenue (Million) Forecast, by Application 2019 & 2032
                                                              150. Table 150: South Africa Peas Industry Volume (Kiloton) Forecast, by Application 2019 & 2032
                                                              151. Table 151: Egypt Peas Industry Revenue (Million) Forecast, by Application 2019 & 2032
                                                              152. Table 152: Egypt Peas Industry Volume (Kiloton) Forecast, by Application 2019 & 2032


                                                              Frequently Asked Questions

                                                              1. What is the projected Compound Annual Growth Rate (CAGR) of the Peas Industry?

                                                              The projected CAGR is approximately 4.30%.

                                                              2. Which companies are prominent players in the Peas Industry?

                                                              Key companies in the market include Solina Group, Archer Daniels Midland, Ingredion, Cargill , Roquette .

                                                              3. What are the main segments of the Peas Industry?

                                                              The market segments include Production Analysis, Consumption Analysis, Import Market Analysis (Value & Volume), Export Market Analysis (Value & Volume), Price Trend Analysis.

                                                              4. Can you provide details about the market size?

                                                              The market size is estimated to be USD XXX Million as of 2022.

                                                              5. What are some drivers contributing to market growth?

                                                              Rising Consumption of Cashew Nuts in the Country; Favorable Government Initiatives.

                                                              6. What are the notable trends driving market growth?

                                                              Growing Demand for Pea Protein Consumption.

                                                              7. Are there any restraints impacting market growth?

                                                              Hazardous Climatic Condition Hinders Cashew Production; Stringent Regulations Related to Food Quality Standards.

                                                              8. Can you provide examples of recent developments in the market?

                                                              October 2022: Roquette, a global leader in plant-based ingredients and a pioneer of plant proteins, launched a new line of organic pea ingredients, organic pea starch, and organic pea protein in the North American and Europe markets to meet customer demand.

                                                              9. What pricing options are available for accessing the report?

                                                              Pricing options include single-user, multi-user, and enterprise licenses priced at USD 4750, USD 5250, and USD 8750 respectively.

                                                              10. Is the market size provided in terms of value or volume?

                                                              The market size is provided in terms of value, measured in Million and volume, measured in Kiloton.

                                                              11. Are there any specific market keywords associated with the report?

                                                              Yes, the market keyword associated with the report is "Peas Industry," which aids in identifying and referencing the specific market segment covered.

                                                              12. How do I determine which pricing option suits my needs best?

                                                              The pricing options vary based on user requirements and access needs. Individual users may opt for single-user licenses, while businesses requiring broader access may choose multi-user or enterprise licenses for cost-effective access to the report.

                                                              13. Are there any additional resources or data provided in the Peas Industry report?

                                                              While the report offers comprehensive insights, it's advisable to review the specific contents or supplementary materials provided to ascertain if additional resources or data are available.

                                                              14. How can I stay updated on further developments or reports in the Peas Industry?

                                                              To stay informed about further developments, trends, and reports in the Peas Industry, consider subscribing to industry newsletters, following relevant companies and organizations, or regularly checking reputable industry news sources and publications.


                                                              Methodology

                                                              Step 1 - Identification of Relevant Samples Size from Population Database

                                                              Step Chart
                                                              Bar Chart
                                                              Method Chart

                                                              Step 2 - Approaches for Defining Global Market Size (Value, Volume* & Price*)

                                                              Approach Chart
                                                              Top-down and bottom-up approaches are used to validate the global market size and estimate the market size for manufactures, regional segments, product, and application.

                                                              Note*: In applicable scenarios

                                                              Step 3 - Data Sources

                                                              Primary Research

                                                              • Web Analytics
                                                              • Survey Reports
                                                              • Research Institute
                                                              • Latest Research Reports
                                                              • Opinion Leaders

                                                              Secondary Research

                                                              • Annual Reports
                                                              • White Paper
                                                              • Latest Press Release
                                                              • Industry Association
                                                              • Paid Database
                                                              • Investor Presentations
                                                              Analyst Chart

                                                              Step 4 - Data Triangulation

                                                              Involves using different sources of information in order to increase the validity of a study

                                                              These sources are likely to be stakeholders in a program - participants, other researchers, program staff, other community members, and so on.

                                                              Then we put all data in single framework & apply various statistical tools to find out the dynamic on the market.

                                                              During the analysis stage, feedback from the stakeholder groups would be compared to determine areas of agreement as well as areas of divergence

                                                              Additionally, after gathering mixed and scattered data from a wide range of sources, data is triangulated and correlated to come up with estimated figures which are further validated through primary mediums or industry experts, opinion leaders.

                                                              About Report Pinnacle

                                                              Report Pinnacle provides top-tier market research, industry intelligence, and actionable insights for finance, technology, healthcare, and consumer sectors. Our reports empower you to make informed decisions and achieve business success.

                                                              Our expert team combines primary research, data analytics, and industry knowledge to deliver insights you can trust. We offer syndicated reports, custom research, and consulting services tailored to your unique business needs.

                                                              At Report Pinnacle, we are committed to quality, transparency, and client satisfaction. Every report is rigorously validated to ensure accuracy and relevance. Our global perspective and local expertise help you understand both broad trends and detailed market shifts.

                                                              Stay ahead with Report Pinnacle. Subscribe to our newsletter for the latest insights and research highlights, and follow us on social media for real-time updates.

                                                              Report Pinnacle – Your Partner for Reaching the Top in Market Intelligence.

                                                              artwork spiralartwork spiralRelated Reports
                                                              artwork underline

                                                              Hydrolyzed Feather Meal Industry Drivers of Growth: Opportunities to 2033

                                                              The hydrolyzed feather meal market is booming, projected to reach [estimated 2033 value based on CAGR] by 2033. Driven by sustainable agriculture and growing animal feed demand, this market offers lucrative opportunities. Learn about market trends, key players, and regional insights.

                                                              July 2025
                                                              Base Year: 2024
                                                              No Of Pages: 234
                                                              Price: $4750

                                                              South America Molluscicides Market Market Outlook and Strategic Insights

                                                              Discover the booming South American molluscicides market! This in-depth analysis reveals key trends, growth drivers, and challenges impacting the $XX million market, segmented by product type (Ferric Phosphate, Metaldehyde, etc.) and application. Learn about leading companies and projected CAGR of 3.50% through 2033.

                                                              July 2025
                                                              Base Year: 2024
                                                              No Of Pages: 150
                                                              Price: $4750

                                                              Asia-Pacific Agricultural Biologicals Market Strategic Insights for 2025 and Forecasts to 2033: Market Trends

                                                              The Asia-Pacific agricultural biologicals market is booming, projected to reach $XX million by 2033 with a 4% CAGR. Driven by sustainable farming trends and government initiatives, this market analysis explores key segments (biopesticides, biofertilizers), regional growth (China, India, Japan), and leading companies. Discover the opportunities and challenges in this dynamic sector.

                                                              July 2025
                                                              Base Year: 2024
                                                              No Of Pages: 197
                                                              Price: $3800

                                                              Exploring France Seed Treatment Market Market Disruption and Innovation

                                                              Discover the booming France seed treatment market! Learn about its €150 million valuation in 2025, 5.60% CAGR, key drivers (biological treatments, precision coating), leading companies (Syngenta, BASF, Semences de France), and future trends in this dynamic agricultural sector. Explore market segmentation and growth projections to 2033.

                                                              July 2025
                                                              Base Year: 2024
                                                              No Of Pages: 197
                                                              Price: $3800

                                                              Brazil Crops Industry Market’s Consumer Preferences: Trends and Analysis 2025-2033

                                                              Discover the booming Brazil crops market! Our analysis reveals a $100.13M (2025) industry projected to grow at a 2.60% CAGR through 2033, driven by soybeans, corn, and biofuels. Learn about key players, market trends, and regional insights.

                                                              July 2025
                                                              Base Year: 2024
                                                              No Of Pages: 197
                                                              Price: $3800

                                                              India Biofertilizer Market Strategic Market Roadmap: Analysis and Forecasts 2025-2033

                                                              Discover the booming India Biofertilizer Market! This in-depth analysis reveals a CAGR of 4% and projects significant growth to 2033, driven by sustainable farming trends and government initiatives. Explore market segments, key players, and regional insights. Learn about the opportunities and challenges shaping this vital sector.

                                                              July 2025
                                                              Base Year: 2024
                                                              No Of Pages: 197
                                                              Price: $3800

                                                              Mexico Seed Treatment Market Insightful Market Analysis: Trends and Opportunities 2025-2033

                                                              Discover the booming Mexico seed treatment market! This comprehensive analysis reveals a $158.20 million market in 2025, projected to grow at a 5.70% CAGR through 2033. Explore key drivers, trends, restraints, and leading companies shaping this dynamic sector. Learn more about market segmentation and growth opportunities in Mexico's agriculture sector.

                                                              July 2025
                                                              Base Year: 2024
                                                              No Of Pages: 197
                                                              Price: $3800

                                                              Exploring Growth Avenues in Europe Blueberry Market Market

                                                              Discover the booming European blueberry market! This in-depth analysis reveals a €8.88 billion market projected to grow at a 6.90% CAGR until 2033, driven by health trends and product diversification. Explore key players, segments, and regional insights.

                                                              July 2025
                                                              Base Year: 2024
                                                              No Of Pages: 180
                                                              Price: $4750

                                                              Germany Fertilizer Market: Competitive Landscape and Growth Trends 2025-2033

                                                              Discover the booming German fertilizer market! This in-depth analysis reveals a CAGR of 15.30% (2025-2033), driven by rising food demands and advanced farming techniques. Explore market segmentation, key players, and regional trends across North Rhine-Westphalia, Bavaria, and other key German states. Get the insights you need for informed decisions.

                                                              July 2025
                                                              Base Year: 2024
                                                              No Of Pages: 180
                                                              Price: $3800

                                                              Biostimulants Market Growth Opportunities and Market Forecast 2025-2033: A Strategic Analysis

                                                              Discover the booming biostimulants market! This in-depth analysis reveals a CAGR of 4.56%, driven by sustainable agriculture and rising food demand. Explore market segments, key players (UPL, Haifa Group, etc.), and regional growth projections (North America, Europe, Asia-Pacific) for 2025-2033. Learn how biostimulants like amino acids and seaweed extracts are transforming crop yields.

                                                              July 2025
                                                              Base Year: 2024
                                                              No Of Pages: 150
                                                              Price: $3800

                                                              South America Quinoa Seeds Industry Strategic Dynamics: Competitor Analysis 2025-2033

                                                              Discover the booming South American quinoa seeds market! This in-depth analysis reveals key trends, growth drivers, leading companies, and regional market shares from 2019-2033. Explore the potential of this lucrative industry with a projected CAGR of 12.50%.

                                                              July 2025
                                                              Base Year: 2024
                                                              No Of Pages: 180
                                                              Price: $4750

                                                              Unlocking Insights for North America Biopesticides Market Growth Strategies

                                                              The North America Biopesticides Market is booming, driven by growing demand for sustainable agriculture and stricter regulations. Discover key trends, market size projections, leading companies, and growth opportunities in this rapidly expanding sector. Explore the market's segmentation by crop type and geographic region to understand the future of biopesticides in North America.

                                                              July 2025
                                                              Base Year: 2024
                                                              No Of Pages: 197
                                                              Price: $3800

                                                              Indonesia Agrochemical Market Consumer Behavior Dynamics: Key Trends 2025-2033

                                                              Discover the booming Indonesian agrochemical market! This in-depth analysis reveals a CAGR of 4.09% through 2033, driven by rising food demand and government initiatives. Explore market size, segmentation, key players (BASF, Syngenta, etc.), and growth challenges. Invest wisely with our data-driven insights.

                                                              July 2025
                                                              Base Year: 2024
                                                              No Of Pages: 150
                                                              Price: $3800

                                                              Charting Insecticides Industry Growth: CAGR Projections for 2025-2033

                                                              The global insecticides market is booming, projected to reach $XX billion by 2033 with a 5.60% CAGR. Driven by food security needs and pest control challenges, this market analysis explores key trends, restraints, and leading companies like FMC, Bayer, and Syngenta, offering insights into application modes, crop types, and regional variations.

                                                              July 2025
                                                              Base Year: 2024
                                                              No Of Pages: 197
                                                              Price: $3800

                                                              US Vertical Farming Market to Grow at XX CAGR: Market Size Analysis and Forecasts 2025-2033

                                                              Discover the booming US vertical farming market! Explore its $3.56 billion (2025) valuation, 10.80% CAGR, key drivers, and leading companies. Learn about market segmentation, regional trends, and future growth projections in hydroponics, aeroponics, and aquaponics.

                                                              July 2025
                                                              Base Year: 2024
                                                              No Of Pages: 150
                                                              Price: $3800

                                                              Europe Agricultural Enzymes Market Strategic Insights: Analysis 2025 and Forecasts 2033

                                                              The European Agricultural Enzymes Market is booming, projected to reach €650 million by 2033 with a 10% CAGR. Driven by sustainable farming and increased food demand, this market analysis explores key trends, segments (crop protection, fertility, etc.), and leading companies like BASF and Novozymes. Discover the growth opportunities in this dynamic sector.

                                                              July 2025
                                                              Base Year: 2024
                                                              No Of Pages: 197
                                                              Price: $3800

                                                              Europe Quinoa Seed Market Analysis 2025 and Forecasts 2033: Unveiling Growth Opportunities

                                                              Discover the booming European quinoa seed market! This comprehensive analysis reveals key trends, growth drivers, and market segmentation from 2019-2033, including insights into major players and projected market value. Explore the rising demand for organic quinoa and its impact on the food and beverage industry.

                                                              July 2025
                                                              Base Year: 2024
                                                              No Of Pages: 180
                                                              Price: $4750

                                                              Africa Biofertilizers Industry CAGR Growth Drivers and Trends: Forecasts 2025-2033

                                                              Discover the booming Africa biofertilizers market, projected to reach [estimated final market size in 2033] by 2033 with a 15% CAGR. This comprehensive analysis explores key drivers, trends, restraints, and regional market shares across countries like South Africa, Nigeria, and Egypt. Learn about leading companies and investment opportunities in this sustainable agriculture sector.

                                                              July 2025
                                                              Base Year: 2024
                                                              No Of Pages: 197
                                                              Price: $3800

                                                              Biological Seed Treatment Market Future Forecasts: Insights and Trends to 2033

                                                              The biological seed treatment market is booming, projected to reach $1.2 billion by 2025 and growing at a CAGR of 10.80% to 2033. Driven by sustainable agriculture and innovative biotechnologies, this report analyzes market trends, key players (Bayer, Syngenta, BASF), and regional growth, offering valuable insights for investors and industry professionals. Explore the future of eco-friendly farming.

                                                              July 2025
                                                              Base Year: 2024
                                                              No Of Pages: 234
                                                              Price: $4750

                                                              Exploring Growth Patterns in Spain Biopesticides Market Market

                                                              Discover the booming Spain biopesticides market! This in-depth analysis reveals a €512.22 million market in 2025, projected to grow at a 5.60% CAGR until 2033. Explore key trends, drivers, restraints, and leading companies shaping this sustainable agriculture sector. Learn more about bioherbicides, bioinsecticides, and biofungicides in Spain.

                                                              July 2025
                                                              Base Year: 2024
                                                              No Of Pages: 197
                                                              Price: $3800
                                                              • Home
                                                              • About Us
                                                              • Industries
                                                                • Aerospace & Defense
                                                                • Agriculture
                                                                • Animal Nutrition & Wellness
                                                                • Automotive
                                                                • Chemicals & Materials
                                                                • Consumer Goods and Services
                                                                • Energy & Power
                                                                • Financial Services and Investment Intelligence
                                                                • Food & Beverage
                                                                • Home and Property Improvement
                                                                • Hospitality and Tourism
                                                                • Logistics
                                                                • Manufacturing Products and Services
                                                                • Packaging
                                                                • Professional and Commercial Services
                                                                • Real Estate and Construction
                                                                • Retail
                                                                • Technology, Media and Telecom
                                                                • Healthcare
                                                              • Services
                                                              • Contact
                                                              Main Logo
                                                              • Home
                                                              • About Us
                                                              • Industries
                                                                • Aerospace & Defense
                                                                • Agriculture
                                                                • Animal Nutrition & Wellness
                                                                • Automotive
                                                                • Chemicals & Materials
                                                                • Consumer Goods and Services
                                                                • Energy & Power
                                                                • Financial Services and Investment Intelligence
                                                                • Food & Beverage
                                                                • Home and Property Improvement
                                                                • Hospitality and Tourism
                                                                • Logistics
                                                                • Manufacturing Products and Services
                                                                • Packaging
                                                                • Professional and Commercial Services
                                                                • Real Estate and Construction
                                                                • Retail
                                                                • Technology, Media and Telecom
                                                                • Healthcare
                                                              • Services
                                                              • Contact
                                                              +17162654855
                                                              [email protected]

                                                              +17162654855

                                                              [email protected]

                                                              Business Address

                                                              Head Office

                                                              Office no. A 5010, fifth floor, Solitaire Business Hub, Near Phoenix mall, Pune, Maharashtra 411014

                                                              Contact Information

                                                              Craig Francis

                                                              Business Development Head

                                                              +17162654855

                                                              [email protected]

                                                              Connect With Us

                                                              Secure Payment Partners

                                                              payment image
                                                              RetailLogisticsPackagingAutomotiveHealthcareAgricultureEnergy & PowerFood & BeverageAerospace & DefenseChemicals & MaterialsHospitality and TourismAnimal Nutrition & WellnessConsumer Goods and ServicesReal Estate and ConstructionHome and Property ImprovementTechnology, Media and TelecomManufacturing Products and ServicesFinancial Services and Investment Intelligence

                                                              © 2025 All rights reserved


                                                              Privacy Policy
                                                              Terms and Conditions
                                                              FAQ