
Key Insights
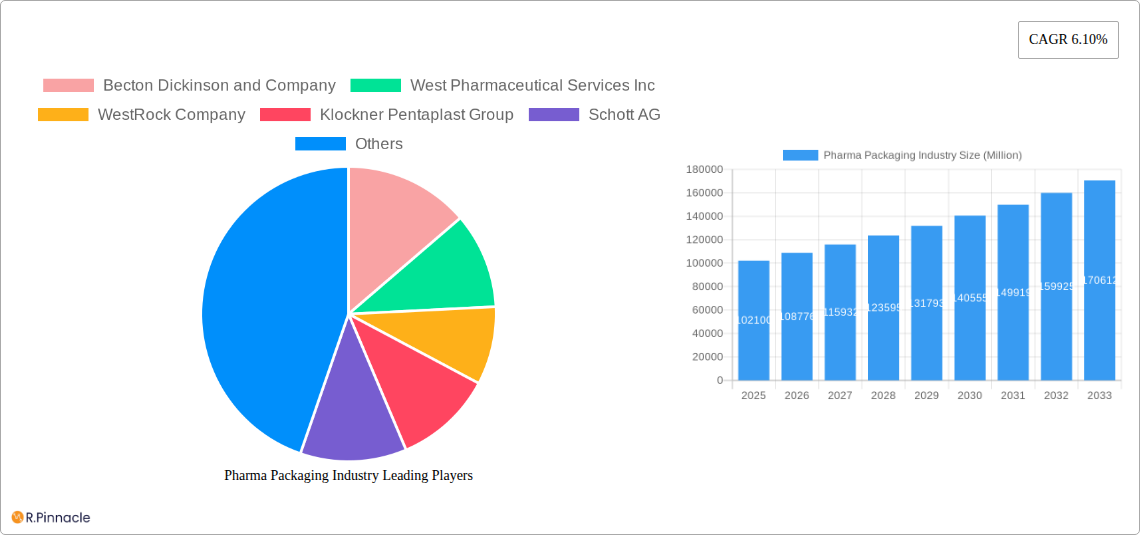
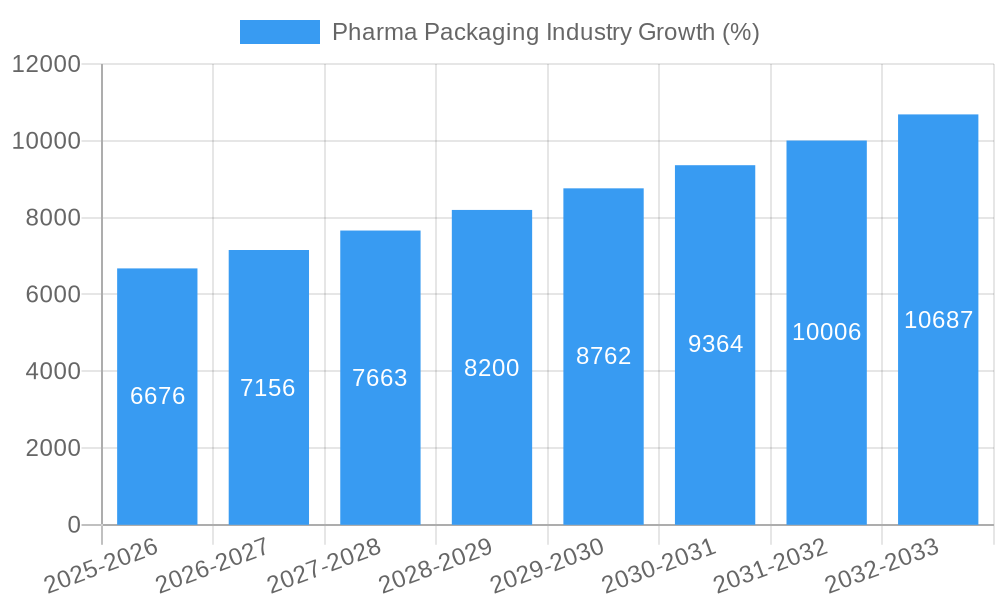
The pharmaceutical packaging market, valued at $102.10 billion in 2025, is projected to experience robust growth, exhibiting a Compound Annual Growth Rate (CAGR) of 6.10% from 2025 to 2033. This expansion is driven by several key factors. Firstly, the increasing prevalence of chronic diseases globally fuels demand for pharmaceutical products, consequently boosting the need for effective and safe packaging solutions. Secondly, advancements in drug delivery systems, such as injectable medications and biologics, necessitate specialized packaging materials and designs, contributing to market growth. Stringent regulatory requirements concerning drug safety and tamper-evidence further drive innovation and adoption of advanced packaging technologies. The market is segmented by material (plastics, glass, other materials) and product type (bottles, syringes, vials and ampoules, tubes, caps and closures, labels, and other product types), each segment presenting unique growth opportunities. The dominance of plastic packaging stems from its cost-effectiveness and versatility, while glass retains its relevance due to its inertness and suitability for sensitive pharmaceuticals. The growing preference for convenient and user-friendly packaging designs, including pre-filled syringes and unit-dose packaging, contributes to the growth of specific product types. Competition among established players like Becton Dickinson, West Pharmaceutical Services, and Amcor, alongside emerging players offering innovative solutions, is shaping the market landscape. Regional growth varies, with North America and Europe representing mature markets, while Asia-Pacific is expected to witness significant growth due to expanding healthcare infrastructure and rising pharmaceutical consumption.
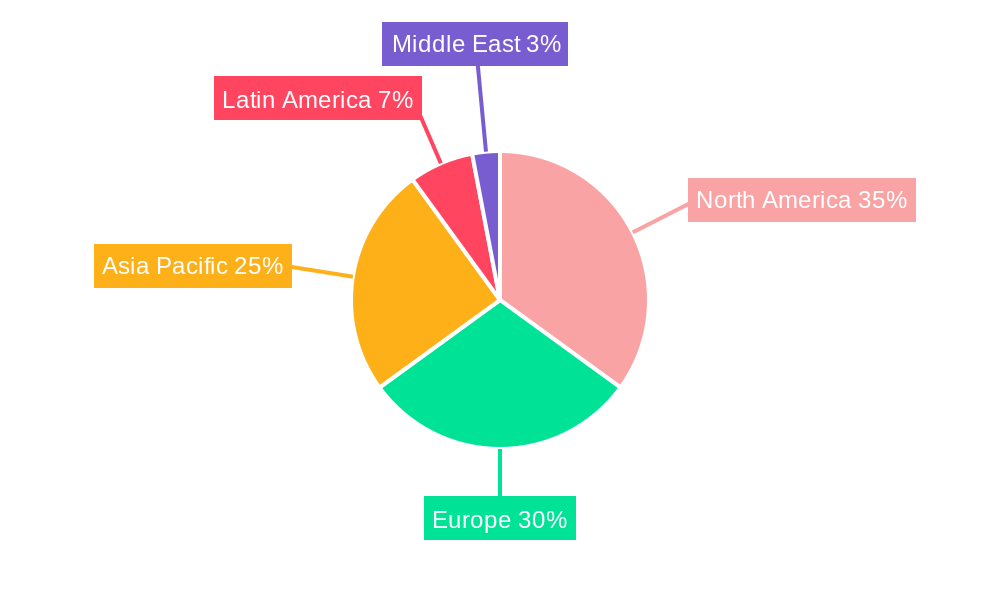
The geographical distribution of market share reflects these trends. North America and Europe currently hold substantial shares due to well-established healthcare systems and regulatory frameworks. However, the Asia-Pacific region is expected to demonstrate the fastest growth over the forecast period, driven by increasing healthcare spending and a burgeoning pharmaceutical industry, particularly in countries like China and India. Latin America and the Middle East are also poised for moderate growth, albeit at a slower pace compared to Asia-Pacific. The market's future growth trajectory is influenced by technological advancements in barrier materials, sustainable packaging solutions (reducing environmental impact), and the increasing adoption of serialization and track-and-trace technologies to combat counterfeiting. These trends will continue to shape the pharmaceutical packaging market's evolution over the coming years.
Pharma Packaging Industry Market Report: 2019-2033
This comprehensive report provides a detailed analysis of the global pharma packaging industry, projecting a market value of xx Million by 2033. It offers actionable insights for industry professionals, investors, and stakeholders seeking to understand market dynamics, competitive landscapes, and future growth opportunities. The study period spans 2019-2033, with 2025 as the base and estimated year. The forecast period covers 2025-2033, while the historical period encompasses 2019-2024.
Pharma Packaging Industry Market Structure & Innovation Trends
The pharma packaging market is characterized by a moderately concentrated structure, with key players holding significant market share. Companies like Becton Dickinson and Company, West Pharmaceutical Services Inc, and Amcor PLC dominate specific segments. Market share analysis reveals that the top 5 players collectively account for approximately xx% of the global market (2024 data). Innovation is driven by stringent regulatory requirements, increasing demand for enhanced drug delivery systems, and a growing focus on patient safety and convenience. Significant M&A activity, such as Amcor's USD 50 Million acquisition of MDK in January 2023, reflects the industry's consolidation and expansion strategies. The average M&A deal value in the last 5 years was approximately xx Million.
- Market Concentration: Moderately concentrated, with top players holding significant shares.
- Innovation Drivers: Regulatory compliance, advanced drug delivery, patient safety.
- Regulatory Frameworks: Stringent guidelines impacting material selection and packaging design.
- Product Substitutes: Limited, due to specific requirements for drug preservation and sterility.
- End-User Demographics: Primarily pharmaceutical companies, contract manufacturers, and healthcare providers.
- M&A Activity: High level of mergers and acquisitions, driving market consolidation.
Pharma Packaging Industry Market Dynamics & Trends
The pharma packaging market exhibits a robust growth trajectory, driven by factors such as increasing pharmaceutical production, rising prevalence of chronic diseases, and growing demand for convenient drug delivery systems. Technological advancements, including the adoption of smart packaging and serialization technologies, are reshaping industry practices. The market is also experiencing a shift in consumer preferences towards sustainable and eco-friendly packaging solutions. Competitive dynamics are characterized by intense rivalry among established players and emerging entrants focusing on niche applications and innovative materials. The CAGR for the forecast period (2025-2033) is estimated at xx%, with market penetration expected to reach xx% by 2033.
Dominant Regions & Segments in Pharma Packaging Industry
The North American region currently holds the largest market share, driven by robust pharmaceutical production, stringent regulatory frameworks, and high disposable incomes. However, the Asia-Pacific region is poised for significant growth, fueled by rapid economic expansion and increasing healthcare spending.
By Material:
- Plastics: Dominates due to cost-effectiveness, versatility, and lightweight nature. Key drivers include advancements in barrier technologies and increasing demand for flexible packaging.
- Glass: Retains a significant share, especially for sensitive pharmaceuticals requiring high barrier properties and chemical inertness. Growth is driven by innovations in glass forming technologies.
- Other Materials: This segment, including paperboard and metal, holds a smaller share but is experiencing growth due to sustainability concerns.
By Product Type:
- Bottles: Remains a dominant segment due to its wide applicability across diverse pharmaceutical products.
- Syringes: Strong growth due to increasing demand for injectable medications.
- Vials and Ampoules: High demand for injectable drugs and vaccines.
- Tubes: Steady growth due to their use in various pharmaceutical and cosmetic products.
- Caps and Closures: High demand due to their essential role in ensuring product integrity and safety.
- Labels: Growing demand driven by enhanced product traceability and information requirements.
- Other Product Types: This includes blisters, pouches, and other specialized packaging formats showing steady growth.
Pharma Packaging Industry Product Innovations
Recent product innovations focus on enhancing drug stability, improving patient convenience, and incorporating security features like tamper evidence and serialization. Technological advancements, such as the use of advanced polymers, smart packaging incorporating sensors, and sustainable materials, are driving innovation. These innovations are enhancing market fit by improving product shelf life, preventing counterfeiting, and enhancing patient adherence.
Report Scope & Segmentation Analysis
This report segments the pharma packaging market by material (plastics, glass, other materials) and product type (bottles, syringes, vials and ampoules, tubes, caps and closures, labels, other product types). Growth projections, market sizes, and competitive dynamics are analyzed for each segment. Each segment shows varied growth rates based on the drivers mentioned above.
Key Drivers of Pharma Packaging Industry Growth
Several factors contribute to the industry's growth, including rising healthcare expenditure, increasing demand for injectable drugs, advancements in drug delivery technologies, stringent regulatory requirements promoting safe and effective packaging, and growing adoption of sustainable packaging solutions.
Challenges in the Pharma Packaging Industry Sector
The industry faces challenges such as fluctuating raw material prices, stringent regulatory compliance requirements, intense competition among players, and supply chain disruptions impacting product availability. These factors impact margins and profitability.
Emerging Opportunities in Pharma Packaging Industry
Emerging opportunities include growth in developing markets, increasing demand for specialized packaging solutions (e.g., cold chain packaging), and adoption of innovative materials and technologies for enhanced product protection and patient compliance.
Leading Players in the Pharma Packaging Industry Market
- Becton Dickinson and Company
- West Pharmaceutical Services Inc
- WestRock Company
- Klockner Pentaplast Group
- Schott AG
- Nipro Corporation
- W L Gore & Associates Inc
- AptarGroup Inc
- Berry Global Group Inc
- 3M Company
- Vetter Pharma International GmbH
- Amcor PLC
- CCL Industries Inc
- FlexiTuff International Ltd
- Catalent Inc
- McKesson Corporation
- Gerresheimer AG
Key Developments in Pharma Packaging Industry Industry
- January 2023: Amcor announced the acquisition of Shanghai-based MDK for approximately USD 50 Million, strengthening its Asia-Pacific healthcare platform.
- June 2022: Catalent installed a high-speed blister packaging line in Japan, enhancing its clinical supply services globally.
Future Outlook for Pharma Packaging Industry Market
The pharma packaging market is expected to witness continued growth, driven by technological advancements, increasing demand for innovative packaging solutions, and expansion into emerging markets. Strategic partnerships, investments in R&D, and a focus on sustainability will play a crucial role in shaping the industry's future.
Pharma Packaging Industry Segmentation
-
1. Material
- 1.1. Plastics
- 1.2. Glass
- 1.3. Other Materials
-
2. Product Type
- 2.1. Bottles
- 2.2. Syringes
- 2.3. Vials and Ampoules
- 2.4. Tubes
- 2.5. Caps and Closures
- 2.6. Labels
- 2.7. Other Product Types
Pharma Packaging Industry Segmentation By Geography
-
1. North America
- 1.1. United States
- 1.2. Canada
-
2. Europe
- 2.1. Germany
- 2.2. United Kingdom
- 2.3. France
- 2.4. Italy
- 2.5. Spain
- 2.6. Rest of Europe
-
3. Asia Pacific
- 3.1. China
- 3.2. Japan
- 3.3. India
- 3.4. South Korea
- 3.5. Rest of Asia Pacific
-
4. Latin America
- 4.1. Brazil
- 4.2. Mexico
- 4.3. Rest of Latin America
-
5. Middle East and Africa
- 5.1. United Arab Emirates
- 5.2. Saudi Arabia
- 5.3. South Africa
- 5.4. Rest of Middle East and Africa
Pharma Packaging Industry REPORT HIGHLIGHTS
| Aspects | Details |
|---|---|
| Study Period | 2019-2033 |
| Base Year | 2024 |
| Estimated Year | 2025 |
| Forecast Period | 2025-2033 |
| Historical Period | 2019-2024 |
| Growth Rate | CAGR of 6.10% from 2019-2033 |
| Segmentation |
|
Table of Contents
- 1. Introduction
- 1.1. Research Scope
- 1.2. Market Segmentation
- 1.3. Research Methodology
- 1.4. Definitions and Assumptions
- 2. Executive Summary
- 2.1. Introduction
- 3. Market Dynamics
- 3.1. Introduction
- 3.2. Market Drivers
- 3.2.1. Regulatory Standards on Packaging and Stringent Norms against Counterfeit Products; Impact of Nanotechnology due to Innovative and New- generation Packaging Solutions
- 3.3. Market Restrains
- 3.3.1. Stringent Government Regulations in Developed Countries
- 3.4. Market Trends
- 3.4.1. Plastic Packaging Holds a Significant Market Share
- 4. Market Factor Analysis
- 4.1. Porters Five Forces
- 4.2. Supply/Value Chain
- 4.3. PESTEL analysis
- 4.4. Market Entropy
- 4.5. Patent/Trademark Analysis
- 5. Global Pharma Packaging Industry Analysis, Insights and Forecast, 2019-2031
- 5.1. Market Analysis, Insights and Forecast - by Material
- 5.1.1. Plastics
- 5.1.2. Glass
- 5.1.3. Other Materials
- 5.2. Market Analysis, Insights and Forecast - by Product Type
- 5.2.1. Bottles
- 5.2.2. Syringes
- 5.2.3. Vials and Ampoules
- 5.2.4. Tubes
- 5.2.5. Caps and Closures
- 5.2.6. Labels
- 5.2.7. Other Product Types
- 5.3. Market Analysis, Insights and Forecast - by Region
- 5.3.1. North America
- 5.3.2. Europe
- 5.3.3. Asia Pacific
- 5.3.4. Latin America
- 5.3.5. Middle East and Africa
- 5.1. Market Analysis, Insights and Forecast - by Material
- 6. North America Pharma Packaging Industry Analysis, Insights and Forecast, 2019-2031
- 6.1. Market Analysis, Insights and Forecast - by Material
- 6.1.1. Plastics
- 6.1.2. Glass
- 6.1.3. Other Materials
- 6.2. Market Analysis, Insights and Forecast - by Product Type
- 6.2.1. Bottles
- 6.2.2. Syringes
- 6.2.3. Vials and Ampoules
- 6.2.4. Tubes
- 6.2.5. Caps and Closures
- 6.2.6. Labels
- 6.2.7. Other Product Types
- 6.1. Market Analysis, Insights and Forecast - by Material
- 7. Europe Pharma Packaging Industry Analysis, Insights and Forecast, 2019-2031
- 7.1. Market Analysis, Insights and Forecast - by Material
- 7.1.1. Plastics
- 7.1.2. Glass
- 7.1.3. Other Materials
- 7.2. Market Analysis, Insights and Forecast - by Product Type
- 7.2.1. Bottles
- 7.2.2. Syringes
- 7.2.3. Vials and Ampoules
- 7.2.4. Tubes
- 7.2.5. Caps and Closures
- 7.2.6. Labels
- 7.2.7. Other Product Types
- 7.1. Market Analysis, Insights and Forecast - by Material
- 8. Asia Pacific Pharma Packaging Industry Analysis, Insights and Forecast, 2019-2031
- 8.1. Market Analysis, Insights and Forecast - by Material
- 8.1.1. Plastics
- 8.1.2. Glass
- 8.1.3. Other Materials
- 8.2. Market Analysis, Insights and Forecast - by Product Type
- 8.2.1. Bottles
- 8.2.2. Syringes
- 8.2.3. Vials and Ampoules
- 8.2.4. Tubes
- 8.2.5. Caps and Closures
- 8.2.6. Labels
- 8.2.7. Other Product Types
- 8.1. Market Analysis, Insights and Forecast - by Material
- 9. Latin America Pharma Packaging Industry Analysis, Insights and Forecast, 2019-2031
- 9.1. Market Analysis, Insights and Forecast - by Material
- 9.1.1. Plastics
- 9.1.2. Glass
- 9.1.3. Other Materials
- 9.2. Market Analysis, Insights and Forecast - by Product Type
- 9.2.1. Bottles
- 9.2.2. Syringes
- 9.2.3. Vials and Ampoules
- 9.2.4. Tubes
- 9.2.5. Caps and Closures
- 9.2.6. Labels
- 9.2.7. Other Product Types
- 9.1. Market Analysis, Insights and Forecast - by Material
- 10. Middle East and Africa Pharma Packaging Industry Analysis, Insights and Forecast, 2019-2031
- 10.1. Market Analysis, Insights and Forecast - by Material
- 10.1.1. Plastics
- 10.1.2. Glass
- 10.1.3. Other Materials
- 10.2. Market Analysis, Insights and Forecast - by Product Type
- 10.2.1. Bottles
- 10.2.2. Syringes
- 10.2.3. Vials and Ampoules
- 10.2.4. Tubes
- 10.2.5. Caps and Closures
- 10.2.6. Labels
- 10.2.7. Other Product Types
- 10.1. Market Analysis, Insights and Forecast - by Material
- 11. North America Pharma Packaging Industry Analysis, Insights and Forecast, 2019-2031
- 11.1. Market Analysis, Insights and Forecast - By Country/Sub-region
- 11.1.1 United States
- 11.1.2 Canada
- 12. Europe Pharma Packaging Industry Analysis, Insights and Forecast, 2019-2031
- 12.1. Market Analysis, Insights and Forecast - By Country/Sub-region
- 12.1.1 Germany
- 12.1.2 United Kingdom
- 12.1.3 France
- 12.1.4 Italy
- 12.1.5 Spain
- 12.1.6 Rest of Europe
- 13. Asia Pacific Pharma Packaging Industry Analysis, Insights and Forecast, 2019-2031
- 13.1. Market Analysis, Insights and Forecast - By Country/Sub-region
- 13.1.1 China
- 13.1.2 Japan
- 13.1.3 India
- 13.1.4 South Korea
- 13.1.5 Rest of Asia Pacific
- 14. Latin America Pharma Packaging Industry Analysis, Insights and Forecast, 2019-2031
- 14.1. Market Analysis, Insights and Forecast - By Country/Sub-region
- 14.1.1 Brazil
- 14.1.2 Mexico
- 14.1.3 Rest of Latin America
- 15. Middle East Pharma Packaging Industry Analysis, Insights and Forecast, 2019-2031
- 15.1. Market Analysis, Insights and Forecast - By Country/Sub-region
- 15.1.1.
- 16. United Arab Emirates Pharma Packaging Industry Analysis, Insights and Forecast, 2019-2031
- 16.1. Market Analysis, Insights and Forecast - By Country/Sub-region
- 16.1.1 Saudi Arabia
- 16.1.2 South Africa
- 16.1.3 Rest of Middle East
- 17. Competitive Analysis
- 17.1. Global Market Share Analysis 2024
- 17.2. Company Profiles
- 17.2.1 Becton Dickinson and Company
- 17.2.1.1. Overview
- 17.2.1.2. Products
- 17.2.1.3. SWOT Analysis
- 17.2.1.4. Recent Developments
- 17.2.1.5. Financials (Based on Availability)
- 17.2.2 West Pharmaceutical Services Inc
- 17.2.2.1. Overview
- 17.2.2.2. Products
- 17.2.2.3. SWOT Analysis
- 17.2.2.4. Recent Developments
- 17.2.2.5. Financials (Based on Availability)
- 17.2.3 WestRock Company
- 17.2.3.1. Overview
- 17.2.3.2. Products
- 17.2.3.3. SWOT Analysis
- 17.2.3.4. Recent Developments
- 17.2.3.5. Financials (Based on Availability)
- 17.2.4 Klockner Pentaplast Group
- 17.2.4.1. Overview
- 17.2.4.2. Products
- 17.2.4.3. SWOT Analysis
- 17.2.4.4. Recent Developments
- 17.2.4.5. Financials (Based on Availability)
- 17.2.5 Schott AG
- 17.2.5.1. Overview
- 17.2.5.2. Products
- 17.2.5.3. SWOT Analysis
- 17.2.5.4. Recent Developments
- 17.2.5.5. Financials (Based on Availability)
- 17.2.6 Nipro Corporation*List Not Exhaustive
- 17.2.6.1. Overview
- 17.2.6.2. Products
- 17.2.6.3. SWOT Analysis
- 17.2.6.4. Recent Developments
- 17.2.6.5. Financials (Based on Availability)
- 17.2.7 W L Gore & Associates Inc
- 17.2.7.1. Overview
- 17.2.7.2. Products
- 17.2.7.3. SWOT Analysis
- 17.2.7.4. Recent Developments
- 17.2.7.5. Financials (Based on Availability)
- 17.2.8 AptarGroup Inc
- 17.2.8.1. Overview
- 17.2.8.2. Products
- 17.2.8.3. SWOT Analysis
- 17.2.8.4. Recent Developments
- 17.2.8.5. Financials (Based on Availability)
- 17.2.9 Berry Global Group Inc
- 17.2.9.1. Overview
- 17.2.9.2. Products
- 17.2.9.3. SWOT Analysis
- 17.2.9.4. Recent Developments
- 17.2.9.5. Financials (Based on Availability)
- 17.2.10 3M Company
- 17.2.10.1. Overview
- 17.2.10.2. Products
- 17.2.10.3. SWOT Analysis
- 17.2.10.4. Recent Developments
- 17.2.10.5. Financials (Based on Availability)
- 17.2.11 Vetter Pharma International GmbH
- 17.2.11.1. Overview
- 17.2.11.2. Products
- 17.2.11.3. SWOT Analysis
- 17.2.11.4. Recent Developments
- 17.2.11.5. Financials (Based on Availability)
- 17.2.12 Amcor PLC
- 17.2.12.1. Overview
- 17.2.12.2. Products
- 17.2.12.3. SWOT Analysis
- 17.2.12.4. Recent Developments
- 17.2.12.5. Financials (Based on Availability)
- 17.2.13 CCL Industries Inc
- 17.2.13.1. Overview
- 17.2.13.2. Products
- 17.2.13.3. SWOT Analysis
- 17.2.13.4. Recent Developments
- 17.2.13.5. Financials (Based on Availability)
- 17.2.14 FlexiTuff International Ltd
- 17.2.14.1. Overview
- 17.2.14.2. Products
- 17.2.14.3. SWOT Analysis
- 17.2.14.4. Recent Developments
- 17.2.14.5. Financials (Based on Availability)
- 17.2.15 Catalent Inc
- 17.2.15.1. Overview
- 17.2.15.2. Products
- 17.2.15.3. SWOT Analysis
- 17.2.15.4. Recent Developments
- 17.2.15.5. Financials (Based on Availability)
- 17.2.16 McKesson Corporation
- 17.2.16.1. Overview
- 17.2.16.2. Products
- 17.2.16.3. SWOT Analysis
- 17.2.16.4. Recent Developments
- 17.2.16.5. Financials (Based on Availability)
- 17.2.17 Gerresheimer AG
- 17.2.17.1. Overview
- 17.2.17.2. Products
- 17.2.17.3. SWOT Analysis
- 17.2.17.4. Recent Developments
- 17.2.17.5. Financials (Based on Availability)
- 17.2.1 Becton Dickinson and Company
List of Figures
- Figure 1: Global Pharma Packaging Industry Revenue Breakdown (Million, %) by Region 2024 & 2032
- Figure 2: North America Pharma Packaging Industry Revenue (Million), by Country 2024 & 2032
- Figure 3: North America Pharma Packaging Industry Revenue Share (%), by Country 2024 & 2032
- Figure 4: Europe Pharma Packaging Industry Revenue (Million), by Country 2024 & 2032
- Figure 5: Europe Pharma Packaging Industry Revenue Share (%), by Country 2024 & 2032
- Figure 6: Asia Pacific Pharma Packaging Industry Revenue (Million), by Country 2024 & 2032
- Figure 7: Asia Pacific Pharma Packaging Industry Revenue Share (%), by Country 2024 & 2032
- Figure 8: Latin America Pharma Packaging Industry Revenue (Million), by Country 2024 & 2032
- Figure 9: Latin America Pharma Packaging Industry Revenue Share (%), by Country 2024 & 2032
- Figure 10: Middle East Pharma Packaging Industry Revenue (Million), by Country 2024 & 2032
- Figure 11: Middle East Pharma Packaging Industry Revenue Share (%), by Country 2024 & 2032
- Figure 12: United Arab Emirates Pharma Packaging Industry Revenue (Million), by Country 2024 & 2032
- Figure 13: United Arab Emirates Pharma Packaging Industry Revenue Share (%), by Country 2024 & 2032
- Figure 14: North America Pharma Packaging Industry Revenue (Million), by Material 2024 & 2032
- Figure 15: North America Pharma Packaging Industry Revenue Share (%), by Material 2024 & 2032
- Figure 16: North America Pharma Packaging Industry Revenue (Million), by Product Type 2024 & 2032
- Figure 17: North America Pharma Packaging Industry Revenue Share (%), by Product Type 2024 & 2032
- Figure 18: North America Pharma Packaging Industry Revenue (Million), by Country 2024 & 2032
- Figure 19: North America Pharma Packaging Industry Revenue Share (%), by Country 2024 & 2032
- Figure 20: Europe Pharma Packaging Industry Revenue (Million), by Material 2024 & 2032
- Figure 21: Europe Pharma Packaging Industry Revenue Share (%), by Material 2024 & 2032
- Figure 22: Europe Pharma Packaging Industry Revenue (Million), by Product Type 2024 & 2032
- Figure 23: Europe Pharma Packaging Industry Revenue Share (%), by Product Type 2024 & 2032
- Figure 24: Europe Pharma Packaging Industry Revenue (Million), by Country 2024 & 2032
- Figure 25: Europe Pharma Packaging Industry Revenue Share (%), by Country 2024 & 2032
- Figure 26: Asia Pacific Pharma Packaging Industry Revenue (Million), by Material 2024 & 2032
- Figure 27: Asia Pacific Pharma Packaging Industry Revenue Share (%), by Material 2024 & 2032
- Figure 28: Asia Pacific Pharma Packaging Industry Revenue (Million), by Product Type 2024 & 2032
- Figure 29: Asia Pacific Pharma Packaging Industry Revenue Share (%), by Product Type 2024 & 2032
- Figure 30: Asia Pacific Pharma Packaging Industry Revenue (Million), by Country 2024 & 2032
- Figure 31: Asia Pacific Pharma Packaging Industry Revenue Share (%), by Country 2024 & 2032
- Figure 32: Latin America Pharma Packaging Industry Revenue (Million), by Material 2024 & 2032
- Figure 33: Latin America Pharma Packaging Industry Revenue Share (%), by Material 2024 & 2032
- Figure 34: Latin America Pharma Packaging Industry Revenue (Million), by Product Type 2024 & 2032
- Figure 35: Latin America Pharma Packaging Industry Revenue Share (%), by Product Type 2024 & 2032
- Figure 36: Latin America Pharma Packaging Industry Revenue (Million), by Country 2024 & 2032
- Figure 37: Latin America Pharma Packaging Industry Revenue Share (%), by Country 2024 & 2032
- Figure 38: Middle East and Africa Pharma Packaging Industry Revenue (Million), by Material 2024 & 2032
- Figure 39: Middle East and Africa Pharma Packaging Industry Revenue Share (%), by Material 2024 & 2032
- Figure 40: Middle East and Africa Pharma Packaging Industry Revenue (Million), by Product Type 2024 & 2032
- Figure 41: Middle East and Africa Pharma Packaging Industry Revenue Share (%), by Product Type 2024 & 2032
- Figure 42: Middle East and Africa Pharma Packaging Industry Revenue (Million), by Country 2024 & 2032
- Figure 43: Middle East and Africa Pharma Packaging Industry Revenue Share (%), by Country 2024 & 2032
List of Tables
- Table 1: Global Pharma Packaging Industry Revenue Million Forecast, by Region 2019 & 2032
- Table 2: Global Pharma Packaging Industry Revenue Million Forecast, by Material 2019 & 2032
- Table 3: Global Pharma Packaging Industry Revenue Million Forecast, by Product Type 2019 & 2032
- Table 4: Global Pharma Packaging Industry Revenue Million Forecast, by Region 2019 & 2032
- Table 5: Global Pharma Packaging Industry Revenue Million Forecast, by Country 2019 & 2032
- Table 6: United States Pharma Packaging Industry Revenue (Million) Forecast, by Application 2019 & 2032
- Table 7: Canada Pharma Packaging Industry Revenue (Million) Forecast, by Application 2019 & 2032
- Table 8: Global Pharma Packaging Industry Revenue Million Forecast, by Country 2019 & 2032
- Table 9: Germany Pharma Packaging Industry Revenue (Million) Forecast, by Application 2019 & 2032
- Table 10: United Kingdom Pharma Packaging Industry Revenue (Million) Forecast, by Application 2019 & 2032
- Table 11: France Pharma Packaging Industry Revenue (Million) Forecast, by Application 2019 & 2032
- Table 12: Italy Pharma Packaging Industry Revenue (Million) Forecast, by Application 2019 & 2032
- Table 13: Spain Pharma Packaging Industry Revenue (Million) Forecast, by Application 2019 & 2032
- Table 14: Rest of Europe Pharma Packaging Industry Revenue (Million) Forecast, by Application 2019 & 2032
- Table 15: Global Pharma Packaging Industry Revenue Million Forecast, by Country 2019 & 2032
- Table 16: China Pharma Packaging Industry Revenue (Million) Forecast, by Application 2019 & 2032
- Table 17: Japan Pharma Packaging Industry Revenue (Million) Forecast, by Application 2019 & 2032
- Table 18: India Pharma Packaging Industry Revenue (Million) Forecast, by Application 2019 & 2032
- Table 19: South Korea Pharma Packaging Industry Revenue (Million) Forecast, by Application 2019 & 2032
- Table 20: Rest of Asia Pacific Pharma Packaging Industry Revenue (Million) Forecast, by Application 2019 & 2032
- Table 21: Global Pharma Packaging Industry Revenue Million Forecast, by Country 2019 & 2032
- Table 22: Brazil Pharma Packaging Industry Revenue (Million) Forecast, by Application 2019 & 2032
- Table 23: Mexico Pharma Packaging Industry Revenue (Million) Forecast, by Application 2019 & 2032
- Table 24: Rest of Latin America Pharma Packaging Industry Revenue (Million) Forecast, by Application 2019 & 2032
- Table 25: Global Pharma Packaging Industry Revenue Million Forecast, by Country 2019 & 2032
- Table 26: Pharma Packaging Industry Revenue (Million) Forecast, by Application 2019 & 2032
- Table 27: Global Pharma Packaging Industry Revenue Million Forecast, by Country 2019 & 2032
- Table 28: Saudi Arabia Pharma Packaging Industry Revenue (Million) Forecast, by Application 2019 & 2032
- Table 29: South Africa Pharma Packaging Industry Revenue (Million) Forecast, by Application 2019 & 2032
- Table 30: Rest of Middle East Pharma Packaging Industry Revenue (Million) Forecast, by Application 2019 & 2032
- Table 31: Global Pharma Packaging Industry Revenue Million Forecast, by Material 2019 & 2032
- Table 32: Global Pharma Packaging Industry Revenue Million Forecast, by Product Type 2019 & 2032
- Table 33: Global Pharma Packaging Industry Revenue Million Forecast, by Country 2019 & 2032
- Table 34: United States Pharma Packaging Industry Revenue (Million) Forecast, by Application 2019 & 2032
- Table 35: Canada Pharma Packaging Industry Revenue (Million) Forecast, by Application 2019 & 2032
- Table 36: Global Pharma Packaging Industry Revenue Million Forecast, by Material 2019 & 2032
- Table 37: Global Pharma Packaging Industry Revenue Million Forecast, by Product Type 2019 & 2032
- Table 38: Global Pharma Packaging Industry Revenue Million Forecast, by Country 2019 & 2032
- Table 39: Germany Pharma Packaging Industry Revenue (Million) Forecast, by Application 2019 & 2032
- Table 40: United Kingdom Pharma Packaging Industry Revenue (Million) Forecast, by Application 2019 & 2032
- Table 41: France Pharma Packaging Industry Revenue (Million) Forecast, by Application 2019 & 2032
- Table 42: Italy Pharma Packaging Industry Revenue (Million) Forecast, by Application 2019 & 2032
- Table 43: Spain Pharma Packaging Industry Revenue (Million) Forecast, by Application 2019 & 2032
- Table 44: Rest of Europe Pharma Packaging Industry Revenue (Million) Forecast, by Application 2019 & 2032
- Table 45: Global Pharma Packaging Industry Revenue Million Forecast, by Material 2019 & 2032
- Table 46: Global Pharma Packaging Industry Revenue Million Forecast, by Product Type 2019 & 2032
- Table 47: Global Pharma Packaging Industry Revenue Million Forecast, by Country 2019 & 2032
- Table 48: China Pharma Packaging Industry Revenue (Million) Forecast, by Application 2019 & 2032
- Table 49: Japan Pharma Packaging Industry Revenue (Million) Forecast, by Application 2019 & 2032
- Table 50: India Pharma Packaging Industry Revenue (Million) Forecast, by Application 2019 & 2032
- Table 51: South Korea Pharma Packaging Industry Revenue (Million) Forecast, by Application 2019 & 2032
- Table 52: Rest of Asia Pacific Pharma Packaging Industry Revenue (Million) Forecast, by Application 2019 & 2032
- Table 53: Global Pharma Packaging Industry Revenue Million Forecast, by Material 2019 & 2032
- Table 54: Global Pharma Packaging Industry Revenue Million Forecast, by Product Type 2019 & 2032
- Table 55: Global Pharma Packaging Industry Revenue Million Forecast, by Country 2019 & 2032
- Table 56: Brazil Pharma Packaging Industry Revenue (Million) Forecast, by Application 2019 & 2032
- Table 57: Mexico Pharma Packaging Industry Revenue (Million) Forecast, by Application 2019 & 2032
- Table 58: Rest of Latin America Pharma Packaging Industry Revenue (Million) Forecast, by Application 2019 & 2032
- Table 59: Global Pharma Packaging Industry Revenue Million Forecast, by Material 2019 & 2032
- Table 60: Global Pharma Packaging Industry Revenue Million Forecast, by Product Type 2019 & 2032
- Table 61: Global Pharma Packaging Industry Revenue Million Forecast, by Country 2019 & 2032
- Table 62: United Arab Emirates Pharma Packaging Industry Revenue (Million) Forecast, by Application 2019 & 2032
- Table 63: Saudi Arabia Pharma Packaging Industry Revenue (Million) Forecast, by Application 2019 & 2032
- Table 64: South Africa Pharma Packaging Industry Revenue (Million) Forecast, by Application 2019 & 2032
- Table 65: Rest of Middle East and Africa Pharma Packaging Industry Revenue (Million) Forecast, by Application 2019 & 2032
Frequently Asked Questions
1. What is the projected Compound Annual Growth Rate (CAGR) of the Pharma Packaging Industry?
The projected CAGR is approximately 6.10%.
2. Which companies are prominent players in the Pharma Packaging Industry?
Key companies in the market include Becton Dickinson and Company, West Pharmaceutical Services Inc, WestRock Company, Klockner Pentaplast Group, Schott AG, Nipro Corporation*List Not Exhaustive, W L Gore & Associates Inc, AptarGroup Inc, Berry Global Group Inc, 3M Company, Vetter Pharma International GmbH, Amcor PLC, CCL Industries Inc, FlexiTuff International Ltd, Catalent Inc, McKesson Corporation, Gerresheimer AG.
3. What are the main segments of the Pharma Packaging Industry?
The market segments include Material, Product Type.
4. Can you provide details about the market size?
The market size is estimated to be USD 102.10 Million as of 2022.
5. What are some drivers contributing to market growth?
Regulatory Standards on Packaging and Stringent Norms against Counterfeit Products; Impact of Nanotechnology due to Innovative and New- generation Packaging Solutions.
6. What are the notable trends driving market growth?
Plastic Packaging Holds a Significant Market Share.
7. Are there any restraints impacting market growth?
Stringent Government Regulations in Developed Countries.
8. Can you provide examples of recent developments in the market?
January 2023: Amcor announced the acquisition of Shanghai-based MDK. MDK, a market leader in medical device packaging and a key priority growth area for Amcor, has annual sales of about USD 50 million. The addition of MDK will strengthen Amcor's already strong healthcare platform in the Asia-Pacific region as it continues to focus its emphasis on higher growth priority categories.
9. What pricing options are available for accessing the report?
Pricing options include single-user, multi-user, and enterprise licenses priced at USD 4750, USD 5250, and USD 8750 respectively.
10. Is the market size provided in terms of value or volume?
The market size is provided in terms of value, measured in Million.
11. Are there any specific market keywords associated with the report?
Yes, the market keyword associated with the report is "Pharma Packaging Industry," which aids in identifying and referencing the specific market segment covered.
12. How do I determine which pricing option suits my needs best?
The pricing options vary based on user requirements and access needs. Individual users may opt for single-user licenses, while businesses requiring broader access may choose multi-user or enterprise licenses for cost-effective access to the report.
13. Are there any additional resources or data provided in the Pharma Packaging Industry report?
While the report offers comprehensive insights, it's advisable to review the specific contents or supplementary materials provided to ascertain if additional resources or data are available.
14. How can I stay updated on further developments or reports in the Pharma Packaging Industry?
To stay informed about further developments, trends, and reports in the Pharma Packaging Industry, consider subscribing to industry newsletters, following relevant companies and organizations, or regularly checking reputable industry news sources and publications.
Methodology
Step 1 - Identification of Relevant Samples Size from Population Database


Step 2 - Approaches for Defining Global Market Size (Value, Volume* & Price*)

Note*: In applicable scenarios
Step 3 - Data Sources
Primary Research
- Web Analytics
- Survey Reports
- Research Institute
- Latest Research Reports
- Opinion Leaders
Secondary Research
- Annual Reports
- White Paper
- Latest Press Release
- Industry Association
- Paid Database
- Investor Presentations

Step 4 - Data Triangulation
Involves using different sources of information in order to increase the validity of a study
These sources are likely to be stakeholders in a program - participants, other researchers, program staff, other community members, and so on.
Then we put all data in single framework & apply various statistical tools to find out the dynamic on the market.
During the analysis stage, feedback from the stakeholder groups would be compared to determine areas of agreement as well as areas of divergence


