
Key Insights
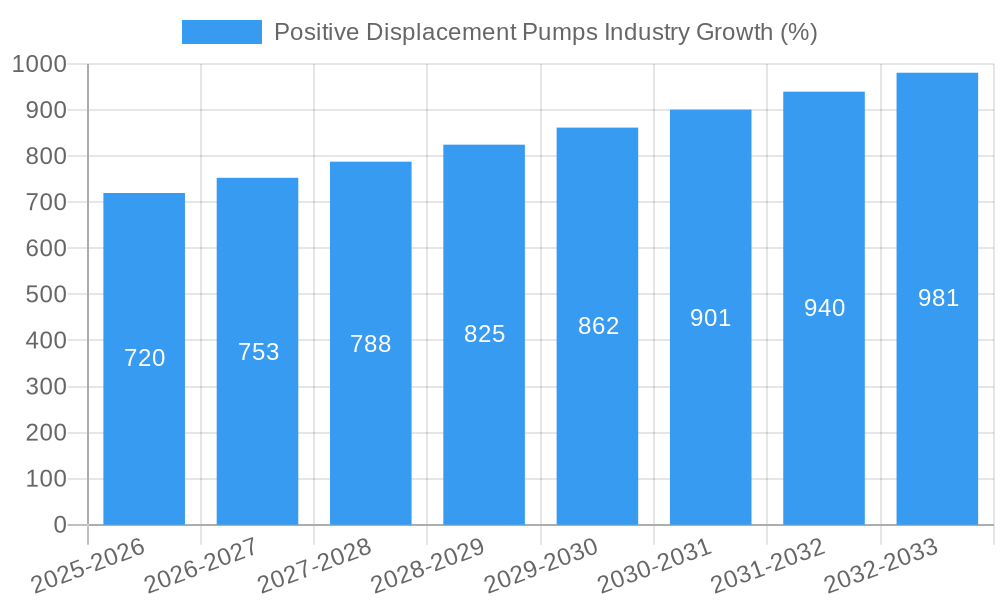
The Positive Displacement Pumps market is experiencing robust growth, projected to maintain a Compound Annual Growth Rate (CAGR) exceeding 4.80% from 2025 to 2033. This expansion is driven by several key factors. Increasing demand across various end-user industries, notably oil and gas, power generation, and water and wastewater treatment, fuels market expansion. The growing need for efficient and reliable fluid handling solutions in these sectors, coupled with advancements in pump technology leading to improved energy efficiency and durability, contribute significantly to market growth. Furthermore, stringent environmental regulations promoting sustainable practices are driving the adoption of advanced positive displacement pumps with reduced emissions and improved operational efficiency. The market segmentation reveals a strong presence of both reciprocating and rotary pumps, catering to diverse application requirements. Geographic analysis indicates significant market share contributions from North America and Europe, driven by established industrial infrastructure and technological advancements. However, rapid industrialization in Asia-Pacific presents a substantial growth opportunity, with countries like China and India experiencing rapid expansion in their respective industries.
The competitive landscape is marked by the presence of both established multinational corporations and specialized manufacturers. Key players such as Ampco Pumps, Flowserve, KSB, ITT, LEWA, SPX Flow, NETZSCH, Xylem, Sulzer, and Pentair are actively engaged in research and development, strategic acquisitions, and geographic expansion to solidify their market positions. The market's future trajectory depends on factors such as technological innovation, global economic conditions, and evolving regulatory frameworks. Continued advancements in materials science, control systems, and digitalization are expected to further enhance pump performance and efficiency, driving market growth. Potential restraints include fluctuating raw material prices and global economic uncertainties that could impact investment decisions in the industrial sector. However, the long-term outlook remains positive, driven by the consistent need for efficient fluid handling solutions across a broad range of applications.

Positive Displacement Pumps Industry Report: 2019-2033 Forecast
This comprehensive report provides an in-depth analysis of the global Positive Displacement Pumps industry, offering valuable insights for industry professionals, investors, and strategic decision-makers. Covering the period from 2019 to 2033, with a base year of 2025, this report meticulously examines market dynamics, competitive landscapes, and future growth potential. The report utilizes a robust methodology, incorporating historical data (2019-2024), current estimates (2025), and future forecasts (2025-2033) to present a holistic view of the market. Market values are expressed in Millions.
Positive Displacement Pumps Industry Market Structure & Innovation Trends
This section analyzes the competitive landscape of the positive displacement pump market, examining market concentration, innovation drivers, regulatory influences, and the impact of mergers and acquisitions (M&A) activity. We explore the role of substitute products and the demographic trends influencing end-user demand. The analysis includes metrics such as market share and M&A deal values. Key players such as Ampco Pumps Company Inc, Flowserve Corp, KSB SE & Co KGaA, ITT Inc, LEWA GmbH, SPX Flow Inc, NETZSCH Holding, Xylem Inc, Sulzer AG, and Pentair PLC (list not exhaustive) are evaluated for their strategies and market positions.
- Market Concentration: The market is moderately concentrated, with several major players holding significant market share. Specific market share figures will be detailed within the full report.
- Innovation Drivers: Technological advancements in materials science, automation, and control systems are driving innovation. Demand for energy-efficient and sustainable pumps is also a key driver.
- Regulatory Framework: Environmental regulations and safety standards significantly impact product design and manufacturing.
- Product Substitutes: Centrifugal pumps are the primary substitute, but positive displacement pumps maintain their edge in specific high-pressure or viscous fluid applications.
- M&A Activity: The acquisition of LEWA GmbH by Atlas Copco in March 2022 highlights the ongoing consolidation within the industry. The report will detail the financial implications and strategic rationale behind such deals, providing estimates of deal values where available. xx Million is a projected value for total M&A activity within the study period.
- End-User Demographics: Growth is driven by demand across diverse sectors, with varying degrees of market penetration in Oil and Gas, Power Generation, Water and Wastewater, Chemical processing, and other end-user industries.
Positive Displacement Pumps Industry Market Dynamics & Trends
This section delves into the key factors driving market growth, including technological advancements, evolving consumer preferences, and competitive dynamics. We analyze the Compound Annual Growth Rate (CAGR) and market penetration across various segments, exploring the impact of technological disruptions and shifts in end-user demand. The analysis provides a comprehensive overview of the dynamic forces shaping the industry's trajectory. The section will detail specific CAGR figures and market penetration rates for various segments. For instance, the Oil and Gas segment is expected to experience a CAGR of xx% during the forecast period.
Dominant Regions & Segments in Positive Displacement Pumps Industry
This section identifies the leading geographical regions and market segments within the positive displacement pumps industry. Detailed analysis will pinpoint the dominant players and factors contributing to their success in each region and segment. For example, the report explores the leading regions for Reciprocating and Rotary pumps and the top performing end-user industries.
- Leading Regions: [Specific region will be identified based on data analysis, along with reasons for dominance]
- Leading Segments (Type): Analysis of market dominance in Reciprocating and Rotary pumps, with detailed breakdowns of respective market size and CAGR.
- Leading Segments (End-user Industry): Analysis of Oil and Gas, Power Generation, Water and Wastewater, Chemical, and Other End-user Industries. The section will detail the specific reasons for the dominance of leading segments. For example, the strong growth in the Oil and Gas segment may be attributed to factors such as [economic policies, infrastructure development, etc.]. Bullet points will highlight key drivers for each leading segment.
Positive Displacement Pumps Industry Product Innovations
This section summarizes recent product developments and technological advancements, emphasizing the competitive advantages gained through innovation and highlighting the market fit of new products. Examples include the development of new materials, like the thermoplastic polymer composite material introduced by CDI Energy Products in May 2021, improving pump durability and efficiency.
Report Scope & Segmentation Analysis
This report provides a detailed segmentation analysis of the positive displacement pumps market based on pump type (Reciprocating, Rotary) and end-user industry (Oil and Gas, Power Generation, Water and Wastewater, Chemical, Other). Each segment is analyzed for its growth projections, market size, and competitive dynamics. Each segment’s paragraph will detail the expected growth, market size (in Millions), and competitive landscape.
Key Drivers of Positive Displacement Pumps Industry Growth
This section outlines the key factors driving the growth of the positive displacement pumps industry. These factors include technological advancements leading to improved efficiency and durability, increasing demand from key end-user industries driven by economic growth and infrastructure development, and supportive regulatory frameworks promoting environmental sustainability.
Challenges in the Positive Displacement Pumps Industry Sector
This section identifies challenges impacting the industry, such as regulatory hurdles (environmental regulations, safety standards), supply chain disruptions impacting material availability and costs, and intense competition. Quantifiable impacts of these challenges will be provided in the full report.
Emerging Opportunities in Positive Displacement Pumps Industry
This section highlights emerging opportunities, including the expansion into new geographic markets, the development of innovative pump designs and materials, and the growing demand for energy-efficient and sustainable solutions.
Leading Players in the Positive Displacement Pumps Industry Market
- Ampco Pumps Company Inc
- Flowserve Corp
- KSB SE & Co KGaA
- ITT Inc
- LEWA GmbH
- SPX Flow Inc
- NETZSCH Holding
- Xylem Inc
- Sulzer AG
- Pentair PLC
Key Developments in Positive Displacement Pumps Industry
- March 2022: Atlas Copco acquired LEWA GmbH and subsidiaries, significantly impacting the market structure.
- May 2021: CDI Energy Products launched a new thermoplastic polymer composite material, introducing a technological advancement in pump materials.
Future Outlook for Positive Displacement Pumps Industry Market
The positive displacement pumps market is poised for continued growth, driven by increasing demand from various end-user industries and ongoing technological advancements. Strategic opportunities exist for companies to focus on innovation, expansion into emerging markets, and sustainable solutions to capitalize on future market potential.
Positive Displacement Pumps Industry Segmentation
-
1. Type
- 1.1. Reciprocating
- 1.2. Rotary
-
2. End-user Industry
- 2.1. Oil and Gas
- 2.2. Power Generation
- 2.3. Water and Wastewater
- 2.4. Chemical
- 2.5. Other End-user Industries
Positive Displacement Pumps Industry Segmentation By Geography
- 1. North America
- 2. Europe
- 3. Asia Pacific
- 4. South America
- 5. Middle East

Positive Displacement Pumps Industry REPORT HIGHLIGHTS
| Aspects | Details |
|---|---|
| Study Period | 2019-2033 |
| Base Year | 2024 |
| Estimated Year | 2025 |
| Forecast Period | 2025-2033 |
| Historical Period | 2019-2024 |
| Growth Rate | CAGR of > 4.80% from 2019-2033 |
| Segmentation |
|
Table of Contents
- 1. Introduction
- 1.1. Research Scope
- 1.2. Market Segmentation
- 1.3. Research Methodology
- 1.4. Definitions and Assumptions
- 2. Executive Summary
- 2.1. Introduction
- 3. Market Dynamics
- 3.1. Introduction
- 3.2. Market Drivers
- 3.2.1. 4.; The Increasing Demand from the EV4.; Growing Renewable Energy Market
- 3.3. Market Restrains
- 3.3.1. 4.; Demand-Supply Mismatch for Raw Materials
- 3.4. Market Trends
- 3.4.1. Water and Wastewater Sector to Witness Significant Market Growth
- 4. Market Factor Analysis
- 4.1. Porters Five Forces
- 4.2. Supply/Value Chain
- 4.3. PESTEL analysis
- 4.4. Market Entropy
- 4.5. Patent/Trademark Analysis
- 5. Global Positive Displacement Pumps Industry Analysis, Insights and Forecast, 2019-2031
- 5.1. Market Analysis, Insights and Forecast - by Type
- 5.1.1. Reciprocating
- 5.1.2. Rotary
- 5.2. Market Analysis, Insights and Forecast - by End-user Industry
- 5.2.1. Oil and Gas
- 5.2.2. Power Generation
- 5.2.3. Water and Wastewater
- 5.2.4. Chemical
- 5.2.5. Other End-user Industries
- 5.3. Market Analysis, Insights and Forecast - by Region
- 5.3.1. North America
- 5.3.2. Europe
- 5.3.3. Asia Pacific
- 5.3.4. South America
- 5.3.5. Middle East
- 5.1. Market Analysis, Insights and Forecast - by Type
- 6. North America Positive Displacement Pumps Industry Analysis, Insights and Forecast, 2019-2031
- 6.1. Market Analysis, Insights and Forecast - by Type
- 6.1.1. Reciprocating
- 6.1.2. Rotary
- 6.2. Market Analysis, Insights and Forecast - by End-user Industry
- 6.2.1. Oil and Gas
- 6.2.2. Power Generation
- 6.2.3. Water and Wastewater
- 6.2.4. Chemical
- 6.2.5. Other End-user Industries
- 6.1. Market Analysis, Insights and Forecast - by Type
- 7. Europe Positive Displacement Pumps Industry Analysis, Insights and Forecast, 2019-2031
- 7.1. Market Analysis, Insights and Forecast - by Type
- 7.1.1. Reciprocating
- 7.1.2. Rotary
- 7.2. Market Analysis, Insights and Forecast - by End-user Industry
- 7.2.1. Oil and Gas
- 7.2.2. Power Generation
- 7.2.3. Water and Wastewater
- 7.2.4. Chemical
- 7.2.5. Other End-user Industries
- 7.1. Market Analysis, Insights and Forecast - by Type
- 8. Asia Pacific Positive Displacement Pumps Industry Analysis, Insights and Forecast, 2019-2031
- 8.1. Market Analysis, Insights and Forecast - by Type
- 8.1.1. Reciprocating
- 8.1.2. Rotary
- 8.2. Market Analysis, Insights and Forecast - by End-user Industry
- 8.2.1. Oil and Gas
- 8.2.2. Power Generation
- 8.2.3. Water and Wastewater
- 8.2.4. Chemical
- 8.2.5. Other End-user Industries
- 8.1. Market Analysis, Insights and Forecast - by Type
- 9. South America Positive Displacement Pumps Industry Analysis, Insights and Forecast, 2019-2031
- 9.1. Market Analysis, Insights and Forecast - by Type
- 9.1.1. Reciprocating
- 9.1.2. Rotary
- 9.2. Market Analysis, Insights and Forecast - by End-user Industry
- 9.2.1. Oil and Gas
- 9.2.2. Power Generation
- 9.2.3. Water and Wastewater
- 9.2.4. Chemical
- 9.2.5. Other End-user Industries
- 9.1. Market Analysis, Insights and Forecast - by Type
- 10. Middle East Positive Displacement Pumps Industry Analysis, Insights and Forecast, 2019-2031
- 10.1. Market Analysis, Insights and Forecast - by Type
- 10.1.1. Reciprocating
- 10.1.2. Rotary
- 10.2. Market Analysis, Insights and Forecast - by End-user Industry
- 10.2.1. Oil and Gas
- 10.2.2. Power Generation
- 10.2.3. Water and Wastewater
- 10.2.4. Chemical
- 10.2.5. Other End-user Industries
- 10.1. Market Analysis, Insights and Forecast - by Type
- 11. North America Positive Displacement Pumps Industry Analysis, Insights and Forecast, 2019-2031
- 11.1. Market Analysis, Insights and Forecast - By Country/Sub-region
- 11.1.1 United States
- 11.1.2 Canada
- 11.1.3 Mexico
- 12. Europe Positive Displacement Pumps Industry Analysis, Insights and Forecast, 2019-2031
- 12.1. Market Analysis, Insights and Forecast - By Country/Sub-region
- 12.1.1 Germany
- 12.1.2 United Kingdom
- 12.1.3 France
- 12.1.4 Spain
- 12.1.5 Italy
- 12.1.6 Spain
- 12.1.7 Belgium
- 12.1.8 Netherland
- 12.1.9 Nordics
- 12.1.10 Rest of Europe
- 13. Asia Pacific Positive Displacement Pumps Industry Analysis, Insights and Forecast, 2019-2031
- 13.1. Market Analysis, Insights and Forecast - By Country/Sub-region
- 13.1.1 China
- 13.1.2 Japan
- 13.1.3 India
- 13.1.4 South Korea
- 13.1.5 Southeast Asia
- 13.1.6 Australia
- 13.1.7 Indonesia
- 13.1.8 Phillipes
- 13.1.9 Singapore
- 13.1.10 Thailandc
- 13.1.11 Rest of Asia Pacific
- 14. South America Positive Displacement Pumps Industry Analysis, Insights and Forecast, 2019-2031
- 14.1. Market Analysis, Insights and Forecast - By Country/Sub-region
- 14.1.1 Brazil
- 14.1.2 Argentina
- 14.1.3 Peru
- 14.1.4 Chile
- 14.1.5 Colombia
- 14.1.6 Ecuador
- 14.1.7 Venezuela
- 14.1.8 Rest of South America
- 15. North America Positive Displacement Pumps Industry Analysis, Insights and Forecast, 2019-2031
- 15.1. Market Analysis, Insights and Forecast - By Country/Sub-region
- 15.1.1 United States
- 15.1.2 Canada
- 15.1.3 Mexico
- 16. MEA Positive Displacement Pumps Industry Analysis, Insights and Forecast, 2019-2031
- 16.1. Market Analysis, Insights and Forecast - By Country/Sub-region
- 16.1.1 United Arab Emirates
- 16.1.2 Saudi Arabia
- 16.1.3 South Africa
- 16.1.4 Rest of Middle East and Africa
- 17. Competitive Analysis
- 17.1. Global Market Share Analysis 2024
- 17.2. Company Profiles
- 17.2.1 Ampco Pumps Company Inc
- 17.2.1.1. Overview
- 17.2.1.2. Products
- 17.2.1.3. SWOT Analysis
- 17.2.1.4. Recent Developments
- 17.2.1.5. Financials (Based on Availability)
- 17.2.2 Flowserve Corp
- 17.2.2.1. Overview
- 17.2.2.2. Products
- 17.2.2.3. SWOT Analysis
- 17.2.2.4. Recent Developments
- 17.2.2.5. Financials (Based on Availability)
- 17.2.3 KSB SE & Co KGaA
- 17.2.3.1. Overview
- 17.2.3.2. Products
- 17.2.3.3. SWOT Analysis
- 17.2.3.4. Recent Developments
- 17.2.3.5. Financials (Based on Availability)
- 17.2.4 ITT Inc
- 17.2.4.1. Overview
- 17.2.4.2. Products
- 17.2.4.3. SWOT Analysis
- 17.2.4.4. Recent Developments
- 17.2.4.5. Financials (Based on Availability)
- 17.2.5 LEWA GmbH
- 17.2.5.1. Overview
- 17.2.5.2. Products
- 17.2.5.3. SWOT Analysis
- 17.2.5.4. Recent Developments
- 17.2.5.5. Financials (Based on Availability)
- 17.2.6 SPX Flow Inc
- 17.2.6.1. Overview
- 17.2.6.2. Products
- 17.2.6.3. SWOT Analysis
- 17.2.6.4. Recent Developments
- 17.2.6.5. Financials (Based on Availability)
- 17.2.7 NETZSCH Holding
- 17.2.7.1. Overview
- 17.2.7.2. Products
- 17.2.7.3. SWOT Analysis
- 17.2.7.4. Recent Developments
- 17.2.7.5. Financials (Based on Availability)
- 17.2.8 Xylem Inc *List Not Exhaustive
- 17.2.8.1. Overview
- 17.2.8.2. Products
- 17.2.8.3. SWOT Analysis
- 17.2.8.4. Recent Developments
- 17.2.8.5. Financials (Based on Availability)
- 17.2.9 Sulzer AG
- 17.2.9.1. Overview
- 17.2.9.2. Products
- 17.2.9.3. SWOT Analysis
- 17.2.9.4. Recent Developments
- 17.2.9.5. Financials (Based on Availability)
- 17.2.10 Pentair PLC
- 17.2.10.1. Overview
- 17.2.10.2. Products
- 17.2.10.3. SWOT Analysis
- 17.2.10.4. Recent Developments
- 17.2.10.5. Financials (Based on Availability)
- 17.2.1 Ampco Pumps Company Inc
List of Figures
- Figure 1: Global Positive Displacement Pumps Industry Revenue Breakdown (Million, %) by Region 2024 & 2032
- Figure 2: North America Positive Displacement Pumps Industry Revenue (Million), by Country 2024 & 2032
- Figure 3: North America Positive Displacement Pumps Industry Revenue Share (%), by Country 2024 & 2032
- Figure 4: Europe Positive Displacement Pumps Industry Revenue (Million), by Country 2024 & 2032
- Figure 5: Europe Positive Displacement Pumps Industry Revenue Share (%), by Country 2024 & 2032
- Figure 6: Asia Pacific Positive Displacement Pumps Industry Revenue (Million), by Country 2024 & 2032
- Figure 7: Asia Pacific Positive Displacement Pumps Industry Revenue Share (%), by Country 2024 & 2032
- Figure 8: South America Positive Displacement Pumps Industry Revenue (Million), by Country 2024 & 2032
- Figure 9: South America Positive Displacement Pumps Industry Revenue Share (%), by Country 2024 & 2032
- Figure 10: North America Positive Displacement Pumps Industry Revenue (Million), by Country 2024 & 2032
- Figure 11: North America Positive Displacement Pumps Industry Revenue Share (%), by Country 2024 & 2032
- Figure 12: MEA Positive Displacement Pumps Industry Revenue (Million), by Country 2024 & 2032
- Figure 13: MEA Positive Displacement Pumps Industry Revenue Share (%), by Country 2024 & 2032
- Figure 14: North America Positive Displacement Pumps Industry Revenue (Million), by Type 2024 & 2032
- Figure 15: North America Positive Displacement Pumps Industry Revenue Share (%), by Type 2024 & 2032
- Figure 16: North America Positive Displacement Pumps Industry Revenue (Million), by End-user Industry 2024 & 2032
- Figure 17: North America Positive Displacement Pumps Industry Revenue Share (%), by End-user Industry 2024 & 2032
- Figure 18: North America Positive Displacement Pumps Industry Revenue (Million), by Country 2024 & 2032
- Figure 19: North America Positive Displacement Pumps Industry Revenue Share (%), by Country 2024 & 2032
- Figure 20: Europe Positive Displacement Pumps Industry Revenue (Million), by Type 2024 & 2032
- Figure 21: Europe Positive Displacement Pumps Industry Revenue Share (%), by Type 2024 & 2032
- Figure 22: Europe Positive Displacement Pumps Industry Revenue (Million), by End-user Industry 2024 & 2032
- Figure 23: Europe Positive Displacement Pumps Industry Revenue Share (%), by End-user Industry 2024 & 2032
- Figure 24: Europe Positive Displacement Pumps Industry Revenue (Million), by Country 2024 & 2032
- Figure 25: Europe Positive Displacement Pumps Industry Revenue Share (%), by Country 2024 & 2032
- Figure 26: Asia Pacific Positive Displacement Pumps Industry Revenue (Million), by Type 2024 & 2032
- Figure 27: Asia Pacific Positive Displacement Pumps Industry Revenue Share (%), by Type 2024 & 2032
- Figure 28: Asia Pacific Positive Displacement Pumps Industry Revenue (Million), by End-user Industry 2024 & 2032
- Figure 29: Asia Pacific Positive Displacement Pumps Industry Revenue Share (%), by End-user Industry 2024 & 2032
- Figure 30: Asia Pacific Positive Displacement Pumps Industry Revenue (Million), by Country 2024 & 2032
- Figure 31: Asia Pacific Positive Displacement Pumps Industry Revenue Share (%), by Country 2024 & 2032
- Figure 32: South America Positive Displacement Pumps Industry Revenue (Million), by Type 2024 & 2032
- Figure 33: South America Positive Displacement Pumps Industry Revenue Share (%), by Type 2024 & 2032
- Figure 34: South America Positive Displacement Pumps Industry Revenue (Million), by End-user Industry 2024 & 2032
- Figure 35: South America Positive Displacement Pumps Industry Revenue Share (%), by End-user Industry 2024 & 2032
- Figure 36: South America Positive Displacement Pumps Industry Revenue (Million), by Country 2024 & 2032
- Figure 37: South America Positive Displacement Pumps Industry Revenue Share (%), by Country 2024 & 2032
- Figure 38: Middle East Positive Displacement Pumps Industry Revenue (Million), by Type 2024 & 2032
- Figure 39: Middle East Positive Displacement Pumps Industry Revenue Share (%), by Type 2024 & 2032
- Figure 40: Middle East Positive Displacement Pumps Industry Revenue (Million), by End-user Industry 2024 & 2032
- Figure 41: Middle East Positive Displacement Pumps Industry Revenue Share (%), by End-user Industry 2024 & 2032
- Figure 42: Middle East Positive Displacement Pumps Industry Revenue (Million), by Country 2024 & 2032
- Figure 43: Middle East Positive Displacement Pumps Industry Revenue Share (%), by Country 2024 & 2032
List of Tables
- Table 1: Global Positive Displacement Pumps Industry Revenue Million Forecast, by Region 2019 & 2032
- Table 2: Global Positive Displacement Pumps Industry Revenue Million Forecast, by Type 2019 & 2032
- Table 3: Global Positive Displacement Pumps Industry Revenue Million Forecast, by End-user Industry 2019 & 2032
- Table 4: Global Positive Displacement Pumps Industry Revenue Million Forecast, by Region 2019 & 2032
- Table 5: Global Positive Displacement Pumps Industry Revenue Million Forecast, by Country 2019 & 2032
- Table 6: United States Positive Displacement Pumps Industry Revenue (Million) Forecast, by Application 2019 & 2032
- Table 7: Canada Positive Displacement Pumps Industry Revenue (Million) Forecast, by Application 2019 & 2032
- Table 8: Mexico Positive Displacement Pumps Industry Revenue (Million) Forecast, by Application 2019 & 2032
- Table 9: Global Positive Displacement Pumps Industry Revenue Million Forecast, by Country 2019 & 2032
- Table 10: Germany Positive Displacement Pumps Industry Revenue (Million) Forecast, by Application 2019 & 2032
- Table 11: United Kingdom Positive Displacement Pumps Industry Revenue (Million) Forecast, by Application 2019 & 2032
- Table 12: France Positive Displacement Pumps Industry Revenue (Million) Forecast, by Application 2019 & 2032
- Table 13: Spain Positive Displacement Pumps Industry Revenue (Million) Forecast, by Application 2019 & 2032
- Table 14: Italy Positive Displacement Pumps Industry Revenue (Million) Forecast, by Application 2019 & 2032
- Table 15: Spain Positive Displacement Pumps Industry Revenue (Million) Forecast, by Application 2019 & 2032
- Table 16: Belgium Positive Displacement Pumps Industry Revenue (Million) Forecast, by Application 2019 & 2032
- Table 17: Netherland Positive Displacement Pumps Industry Revenue (Million) Forecast, by Application 2019 & 2032
- Table 18: Nordics Positive Displacement Pumps Industry Revenue (Million) Forecast, by Application 2019 & 2032
- Table 19: Rest of Europe Positive Displacement Pumps Industry Revenue (Million) Forecast, by Application 2019 & 2032
- Table 20: Global Positive Displacement Pumps Industry Revenue Million Forecast, by Country 2019 & 2032
- Table 21: China Positive Displacement Pumps Industry Revenue (Million) Forecast, by Application 2019 & 2032
- Table 22: Japan Positive Displacement Pumps Industry Revenue (Million) Forecast, by Application 2019 & 2032
- Table 23: India Positive Displacement Pumps Industry Revenue (Million) Forecast, by Application 2019 & 2032
- Table 24: South Korea Positive Displacement Pumps Industry Revenue (Million) Forecast, by Application 2019 & 2032
- Table 25: Southeast Asia Positive Displacement Pumps Industry Revenue (Million) Forecast, by Application 2019 & 2032
- Table 26: Australia Positive Displacement Pumps Industry Revenue (Million) Forecast, by Application 2019 & 2032
- Table 27: Indonesia Positive Displacement Pumps Industry Revenue (Million) Forecast, by Application 2019 & 2032
- Table 28: Phillipes Positive Displacement Pumps Industry Revenue (Million) Forecast, by Application 2019 & 2032
- Table 29: Singapore Positive Displacement Pumps Industry Revenue (Million) Forecast, by Application 2019 & 2032
- Table 30: Thailandc Positive Displacement Pumps Industry Revenue (Million) Forecast, by Application 2019 & 2032
- Table 31: Rest of Asia Pacific Positive Displacement Pumps Industry Revenue (Million) Forecast, by Application 2019 & 2032
- Table 32: Global Positive Displacement Pumps Industry Revenue Million Forecast, by Country 2019 & 2032
- Table 33: Brazil Positive Displacement Pumps Industry Revenue (Million) Forecast, by Application 2019 & 2032
- Table 34: Argentina Positive Displacement Pumps Industry Revenue (Million) Forecast, by Application 2019 & 2032
- Table 35: Peru Positive Displacement Pumps Industry Revenue (Million) Forecast, by Application 2019 & 2032
- Table 36: Chile Positive Displacement Pumps Industry Revenue (Million) Forecast, by Application 2019 & 2032
- Table 37: Colombia Positive Displacement Pumps Industry Revenue (Million) Forecast, by Application 2019 & 2032
- Table 38: Ecuador Positive Displacement Pumps Industry Revenue (Million) Forecast, by Application 2019 & 2032
- Table 39: Venezuela Positive Displacement Pumps Industry Revenue (Million) Forecast, by Application 2019 & 2032
- Table 40: Rest of South America Positive Displacement Pumps Industry Revenue (Million) Forecast, by Application 2019 & 2032
- Table 41: Global Positive Displacement Pumps Industry Revenue Million Forecast, by Country 2019 & 2032
- Table 42: United States Positive Displacement Pumps Industry Revenue (Million) Forecast, by Application 2019 & 2032
- Table 43: Canada Positive Displacement Pumps Industry Revenue (Million) Forecast, by Application 2019 & 2032
- Table 44: Mexico Positive Displacement Pumps Industry Revenue (Million) Forecast, by Application 2019 & 2032
- Table 45: Global Positive Displacement Pumps Industry Revenue Million Forecast, by Country 2019 & 2032
- Table 46: United Arab Emirates Positive Displacement Pumps Industry Revenue (Million) Forecast, by Application 2019 & 2032
- Table 47: Saudi Arabia Positive Displacement Pumps Industry Revenue (Million) Forecast, by Application 2019 & 2032
- Table 48: South Africa Positive Displacement Pumps Industry Revenue (Million) Forecast, by Application 2019 & 2032
- Table 49: Rest of Middle East and Africa Positive Displacement Pumps Industry Revenue (Million) Forecast, by Application 2019 & 2032
- Table 50: Global Positive Displacement Pumps Industry Revenue Million Forecast, by Type 2019 & 2032
- Table 51: Global Positive Displacement Pumps Industry Revenue Million Forecast, by End-user Industry 2019 & 2032
- Table 52: Global Positive Displacement Pumps Industry Revenue Million Forecast, by Country 2019 & 2032
- Table 53: Global Positive Displacement Pumps Industry Revenue Million Forecast, by Type 2019 & 2032
- Table 54: Global Positive Displacement Pumps Industry Revenue Million Forecast, by End-user Industry 2019 & 2032
- Table 55: Global Positive Displacement Pumps Industry Revenue Million Forecast, by Country 2019 & 2032
- Table 56: Global Positive Displacement Pumps Industry Revenue Million Forecast, by Type 2019 & 2032
- Table 57: Global Positive Displacement Pumps Industry Revenue Million Forecast, by End-user Industry 2019 & 2032
- Table 58: Global Positive Displacement Pumps Industry Revenue Million Forecast, by Country 2019 & 2032
- Table 59: Global Positive Displacement Pumps Industry Revenue Million Forecast, by Type 2019 & 2032
- Table 60: Global Positive Displacement Pumps Industry Revenue Million Forecast, by End-user Industry 2019 & 2032
- Table 61: Global Positive Displacement Pumps Industry Revenue Million Forecast, by Country 2019 & 2032
- Table 62: Global Positive Displacement Pumps Industry Revenue Million Forecast, by Type 2019 & 2032
- Table 63: Global Positive Displacement Pumps Industry Revenue Million Forecast, by End-user Industry 2019 & 2032
- Table 64: Global Positive Displacement Pumps Industry Revenue Million Forecast, by Country 2019 & 2032
Frequently Asked Questions
1. What is the projected Compound Annual Growth Rate (CAGR) of the Positive Displacement Pumps Industry?
The projected CAGR is approximately > 4.80%.
2. Which companies are prominent players in the Positive Displacement Pumps Industry?
Key companies in the market include Ampco Pumps Company Inc, Flowserve Corp, KSB SE & Co KGaA, ITT Inc, LEWA GmbH, SPX Flow Inc, NETZSCH Holding, Xylem Inc *List Not Exhaustive, Sulzer AG, Pentair PLC.
3. What are the main segments of the Positive Displacement Pumps Industry?
The market segments include Type, End-user Industry.
4. Can you provide details about the market size?
The market size is estimated to be USD XX Million as of 2022.
5. What are some drivers contributing to market growth?
4.; The Increasing Demand from the EV4.; Growing Renewable Energy Market.
6. What are the notable trends driving market growth?
Water and Wastewater Sector to Witness Significant Market Growth.
7. Are there any restraints impacting market growth?
4.; Demand-Supply Mismatch for Raw Materials.
8. Can you provide examples of recent developments in the market?
In March 2022, Atlas Copco agreed to acquire LEWA GmbH and subsidiaries and Geveke BV and subsidiaries. LEWA is a leading manufacturer of diaphragm metering pumps, process pumps, and positive displacement pumps.
9. What pricing options are available for accessing the report?
Pricing options include single-user, multi-user, and enterprise licenses priced at USD 4750, USD 5250, and USD 8750 respectively.
10. Is the market size provided in terms of value or volume?
The market size is provided in terms of value, measured in Million.
11. Are there any specific market keywords associated with the report?
Yes, the market keyword associated with the report is "Positive Displacement Pumps Industry," which aids in identifying and referencing the specific market segment covered.
12. How do I determine which pricing option suits my needs best?
The pricing options vary based on user requirements and access needs. Individual users may opt for single-user licenses, while businesses requiring broader access may choose multi-user or enterprise licenses for cost-effective access to the report.
13. Are there any additional resources or data provided in the Positive Displacement Pumps Industry report?
While the report offers comprehensive insights, it's advisable to review the specific contents or supplementary materials provided to ascertain if additional resources or data are available.
14. How can I stay updated on further developments or reports in the Positive Displacement Pumps Industry?
To stay informed about further developments, trends, and reports in the Positive Displacement Pumps Industry, consider subscribing to industry newsletters, following relevant companies and organizations, or regularly checking reputable industry news sources and publications.
Methodology
Step 1 - Identification of Relevant Samples Size from Population Database


Step 2 - Approaches for Defining Global Market Size (Value, Volume* & Price*)

Note*: In applicable scenarios
Step 3 - Data Sources
Primary Research
- Web Analytics
- Survey Reports
- Research Institute
- Latest Research Reports
- Opinion Leaders
Secondary Research
- Annual Reports
- White Paper
- Latest Press Release
- Industry Association
- Paid Database
- Investor Presentations

Step 4 - Data Triangulation
Involves using different sources of information in order to increase the validity of a study
These sources are likely to be stakeholders in a program - participants, other researchers, program staff, other community members, and so on.
Then we put all data in single framework & apply various statistical tools to find out the dynamic on the market.
During the analysis stage, feedback from the stakeholder groups would be compared to determine areas of agreement as well as areas of divergence


