
Key Insights
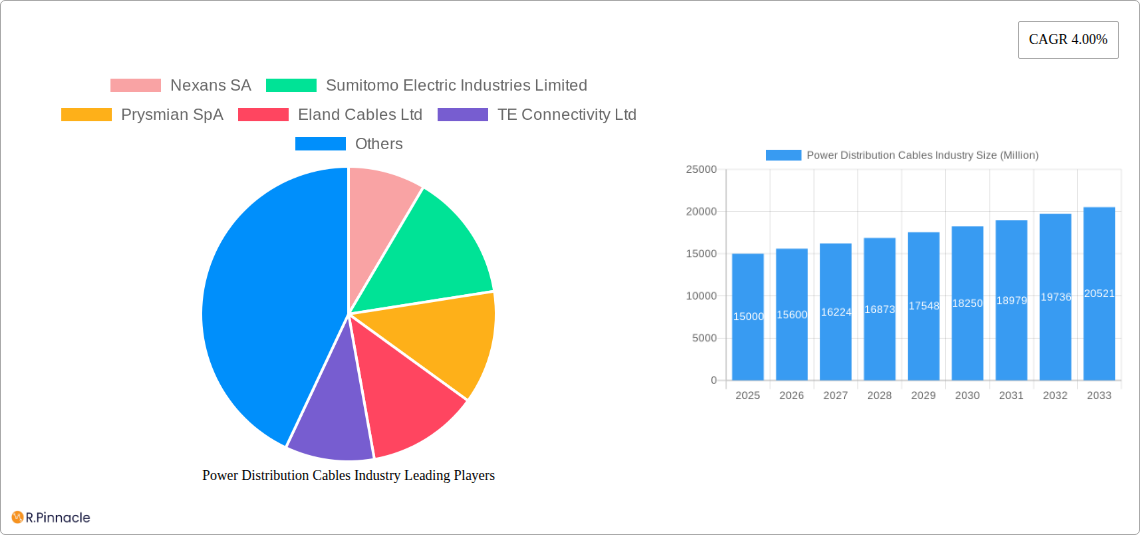
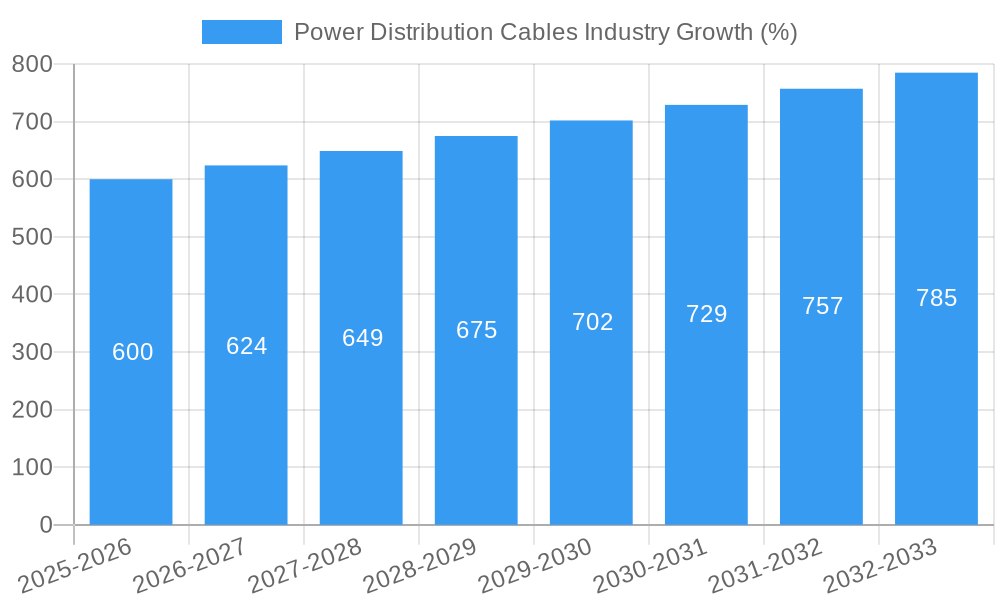
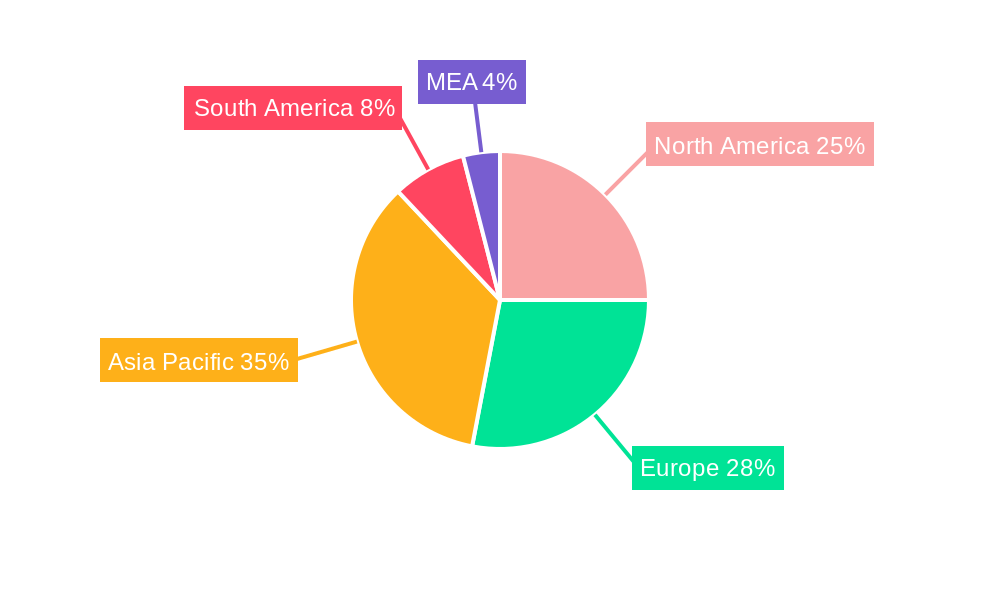
The global power distribution cables market is experiencing steady growth, driven by the increasing demand for electricity across residential, commercial, and industrial sectors. The market's compound annual growth rate (CAGR) of 4.00% from 2019 to 2024 indicates a consistent expansion, projected to continue through 2033. Key drivers include the ongoing expansion of power grids, particularly in developing economies experiencing rapid urbanization and industrialization. The rising adoption of renewable energy sources also fuels market growth, as these sources require robust and efficient transmission infrastructure. Technological advancements in cable materials, such as the development of high-voltage direct current (HVDC) cables and improved insulation materials, further enhance efficiency and reliability, bolstering market expansion. While factors like fluctuating raw material prices and stringent regulatory compliance pose challenges, the overall market outlook remains positive. Segment analysis reveals strong demand across all voltage levels (low, medium, and high), with overhead deployment remaining the dominant method due to its cost-effectiveness. However, underground and submarine cable installations are witnessing significant growth, driven by increasing urbanization and the need for reliable power transmission in challenging geographical locations. Leading players like Nexans SA, Sumitomo Electric Industries Limited, and Prysmian SpA are actively investing in research and development, focusing on innovation and market expansion strategies to maintain their competitive edge. Regional analysis indicates strong growth in Asia-Pacific, driven by infrastructure development in emerging economies such as India and China. North America and Europe also contribute significantly to the market, fueled by grid modernization and renewable energy integration projects.
The market segmentation by voltage level and location of deployment provides valuable insights into specific market niches. The high voltage segment is anticipated to witness faster growth due to the increasing demand for efficient long-distance power transmission. Similarly, the underground and submarine cable segments are poised for substantial growth due to their suitability for densely populated areas and offshore renewable energy projects. Competitive dynamics are shaped by factors such as technological innovation, cost-efficiency, and market reach. Companies are focusing on strategic partnerships, mergers and acquisitions, and product diversification to expand their market share and cater to diverse customer needs. Future growth will be significantly influenced by government policies promoting renewable energy adoption, infrastructure investments, and technological advancements in cable design and manufacturing. Overall, the power distribution cables market presents significant opportunities for companies that can adapt to the evolving market landscape and leverage technological advancements to offer innovative and cost-effective solutions.
Power Distribution Cables Industry Report: 2019-2033
This comprehensive report provides an in-depth analysis of the global power distribution cables industry, offering invaluable insights for industry professionals, investors, and strategic decision-makers. With a study period spanning 2019-2033, a base year of 2025, and a forecast period of 2025-2033, this report leverages rigorous data analysis to illuminate current market dynamics and future growth trajectories. The market is valued at $xx Million in 2025 and is projected to reach $xx Million by 2033.
Power Distribution Cables Industry Market Structure & Innovation Trends
This section analyzes the competitive landscape, focusing on market concentration, innovation drivers, regulatory landscapes, and key M&A activities within the power distribution cables industry. The report examines the market share of leading players such as Nexans SA, Sumitomo Electric Industries Limited, Prysmian SpA, Eland Cables Ltd, TE Connectivity Ltd, NKT A/S, Brugg Kabel AG, and ABB Limited. Analysis includes an evaluation of the impact of mergers and acquisitions, with an assessment of deal values exceeding $xx Million during the historical period (2019-2024). The report also explores the influence of regulatory frameworks on innovation and competition, examining the role of government policies and standards in shaping market dynamics. Innovation drivers are analyzed, considering factors such as technological advancements, evolving end-user needs, and the emergence of substitute products. The analysis encompasses a detailed examination of end-user demographics and their influence on market demand.
- Market Share Analysis of Key Players (2024): Nexans SA (xx%), Sumitomo Electric Industries (xx%), Prysmian SpA (xx%), Others (xx%)
- Significant M&A Activities (2019-2024): Deal Value Summary (Total exceeding $xx Million)
- Regulatory Landscape Analysis: Impact of key regulations on market growth and innovation.
Power Distribution Cables Industry Market Dynamics & Trends
This section delves into the key factors driving market growth, technological disruptions, shifting consumer preferences, and competitive dynamics within the power distribution cables sector. A detailed examination of the Compound Annual Growth Rate (CAGR) during the historical and forecast periods is provided, along with an analysis of market penetration across different segments. The report explores the impact of technological advancements on market structure and competition, including the adoption of smart grid technologies and the increasing demand for high-voltage cables. The evolution of consumer preferences and their implications for product development and market demand are also analyzed. Competitive dynamics are examined, highlighting strategies employed by leading players to gain market share and enhance profitability.
- CAGR (2019-2024): xx%
- CAGR (2025-2033): xx%
- Market Penetration Analysis (by segment and region): Detailed breakdown of market penetration rates.
Dominant Regions & Segments in Power Distribution Cables Industry
This section identifies the leading regions and segments within the power distribution cables market. Analysis is conducted across voltage levels (low, medium, high), and deployment locations (overhead, underground, submarine). Key drivers of dominance in each segment are analyzed, including economic policies, infrastructure development, and government initiatives. A comparative analysis of market growth and potential across different regions and segments is presented.
- Voltage Level: High-voltage cables are projected to dominate due to the increasing demand for efficient power transmission and the expansion of renewable energy projects.
- Location of Deployment: The underground segment holds a significant share due to the growing need for reliable and safe power distribution in urban areas. Submarine cables are also experiencing increasing growth due to the rising demand for offshore wind power and the expansion of subsea infrastructure projects.
- Regional Dominance: [Region X] is identified as the leading region due to [specific factors – e.g., robust infrastructure development, strong government support, and high energy demand].
Power Distribution Cables Industry Product Innovations
This section presents a concise overview of the latest product developments, applications, and competitive advantages in the power distribution cables industry. Technological trends, such as the development of advanced materials and improved manufacturing techniques, are discussed, along with their impact on market competitiveness and product performance. The alignment of new product features with market needs and consumer preferences is examined.
Report Scope & Segmentation Analysis
This report segments the market by voltage level (low, medium, high) and location of deployment (overhead, underground, submarine). Each segment's growth projections, market sizes, and competitive dynamics are analyzed in detail.
- Voltage Level: Low, Medium, High – (Market size and growth projections for each segment)
- Location of Deployment: Overhead, Underground, Submarine – (Market size and growth projections for each segment)
Key Drivers of Power Distribution Cables Industry Growth
The growth of the power distribution cables industry is driven by several factors, including increasing electricity demand globally, investments in renewable energy infrastructure, and the expansion of smart grids. Government regulations promoting energy efficiency and grid modernization further stimulate market growth. Technological advancements, such as the development of high-voltage direct current (HVDC) cables, contribute to the industry's expansion.
Challenges in the Power Distribution Cables Industry Sector
The power distribution cables industry faces challenges such as fluctuations in raw material prices, stringent regulatory requirements, and intense competition. Supply chain disruptions can impact production and delivery timelines. These factors affect profitability and overall market growth. The report quantifies the impact of these challenges using specific metrics and examples.
Emerging Opportunities in Power Distribution Cables Industry
Emerging opportunities include the growth of renewable energy sectors (solar, wind), increasing demand for HVDC cables for long-distance power transmission, and the expansion of smart grid infrastructure globally. These trends present significant opportunities for growth and innovation in the power distribution cables market.
Leading Players in the Power Distribution Cables Industry Market
- Nexans SA
- Sumitomo Electric Industries Limited
- Prysmian SpA
- Eland Cables Ltd
- TE Connectivity Ltd
- NKT A/S
- Brugg Kabel AG
- ABB Limited
Key Developments in Power Distribution Cables Industry
- December 2022: NKT awarded a turnkey cable system contract for the NOA and Krafla offshore fields in the North Sea. This significant contract involves more than 255 kilometers of 145kV high-voltage AC power cables, boosting NKT's market position and highlighting the growing demand for high-voltage subsea cables.
- February 2022: Sumitomo Electric Industries Ltd. received an LNTP from Samsung C&T Corporation for an HVDC cable project in the UAE, valued at approximately USD 200 Million. This underscores the increasing investments in HVDC technology for long-distance power transmission.
Future Outlook for Power Distribution Cables Industry Market
The future outlook for the power distribution cables industry is positive, driven by sustained growth in global energy demand, the expansion of renewable energy sources, and the ongoing development of smart grid technologies. Strategic investments in research and development, focusing on advanced materials and improved manufacturing processes, will play a crucial role in shaping future market dynamics and providing new opportunities for growth. The market is expected to experience a robust expansion, with significant growth anticipated in key segments.
Power Distribution Cables Industry Segmentation
-
1. Voltage Level
- 1.1. Low
- 1.2. Medium
- 1.3. High
-
2. Location of Deployment
- 2.1. Overhead
- 2.2. Underground
- 2.3. Submarine
Power Distribution Cables Industry Segmentation By Geography
- 1. North America
- 2. Europe
- 3. Asia Pacific
- 4. South America
- 5. Middle East and Africa
Power Distribution Cables Industry REPORT HIGHLIGHTS
| Aspects | Details |
|---|---|
| Study Period | 2019-2033 |
| Base Year | 2024 |
| Estimated Year | 2025 |
| Forecast Period | 2025-2033 |
| Historical Period | 2019-2024 |
| Growth Rate | CAGR of 4.00% from 2019-2033 |
| Segmentation |
|
Table of Contents
- 1. Introduction
- 1.1. Research Scope
- 1.2. Market Segmentation
- 1.3. Research Methodology
- 1.4. Definitions and Assumptions
- 2. Executive Summary
- 2.1. Introduction
- 3. Market Dynamics
- 3.1. Introduction
- 3.2. Market Drivers
- 3.2.1 Urbanization is a major driver for the power distribution cables market. As cities expand
- 3.2.2 there is a need for reliable and upgraded electrical infrastructure to meet the growing energy demand. Developing countries
- 3.2.3 in particular
- 3.2.4 are investing heavily in modernizing their power distribution systems to accommodate population growth and economic expansion.
- 3.3. Market Restrains
- 3.3.1 The initial capital investment required to manufacture and install power distribution cables can be significant. This includes costs related to raw materials
- 3.3.2 manufacturing processes
- 3.3.3 and installation infrastructure.
- 3.4. Market Trends
- 3.4.1 The smart grid is a major trend in the power distribution sector. Smart grids use advanced communication and control technologies to improve the reliability and efficiency of power distribution. They enable real-time monitoring
- 3.4.2 fault detection
- 3.4.3 and optimization of energy use
- 3.4.4 reducing losses and enhancing grid stability.
- 4. Market Factor Analysis
- 4.1. Porters Five Forces
- 4.2. Supply/Value Chain
- 4.3. PESTEL analysis
- 4.4. Market Entropy
- 4.5. Patent/Trademark Analysis
- 5. Global Power Distribution Cables Industry Analysis, Insights and Forecast, 2019-2031
- 5.1. Market Analysis, Insights and Forecast - by Voltage Level
- 5.1.1. Low
- 5.1.2. Medium
- 5.1.3. High
- 5.2. Market Analysis, Insights and Forecast - by Location of Deployment
- 5.2.1. Overhead
- 5.2.2. Underground
- 5.2.3. Submarine
- 5.3. Market Analysis, Insights and Forecast - by Region
- 5.3.1. North America
- 5.3.2. Europe
- 5.3.3. Asia Pacific
- 5.3.4. South America
- 5.3.5. Middle East and Africa
- 5.1. Market Analysis, Insights and Forecast - by Voltage Level
- 6. North America Power Distribution Cables Industry Analysis, Insights and Forecast, 2019-2031
- 6.1. Market Analysis, Insights and Forecast - by Voltage Level
- 6.1.1. Low
- 6.1.2. Medium
- 6.1.3. High
- 6.2. Market Analysis, Insights and Forecast - by Location of Deployment
- 6.2.1. Overhead
- 6.2.2. Underground
- 6.2.3. Submarine
- 6.1. Market Analysis, Insights and Forecast - by Voltage Level
- 7. Europe Power Distribution Cables Industry Analysis, Insights and Forecast, 2019-2031
- 7.1. Market Analysis, Insights and Forecast - by Voltage Level
- 7.1.1. Low
- 7.1.2. Medium
- 7.1.3. High
- 7.2. Market Analysis, Insights and Forecast - by Location of Deployment
- 7.2.1. Overhead
- 7.2.2. Underground
- 7.2.3. Submarine
- 7.1. Market Analysis, Insights and Forecast - by Voltage Level
- 8. Asia Pacific Power Distribution Cables Industry Analysis, Insights and Forecast, 2019-2031
- 8.1. Market Analysis, Insights and Forecast - by Voltage Level
- 8.1.1. Low
- 8.1.2. Medium
- 8.1.3. High
- 8.2. Market Analysis, Insights and Forecast - by Location of Deployment
- 8.2.1. Overhead
- 8.2.2. Underground
- 8.2.3. Submarine
- 8.1. Market Analysis, Insights and Forecast - by Voltage Level
- 9. South America Power Distribution Cables Industry Analysis, Insights and Forecast, 2019-2031
- 9.1. Market Analysis, Insights and Forecast - by Voltage Level
- 9.1.1. Low
- 9.1.2. Medium
- 9.1.3. High
- 9.2. Market Analysis, Insights and Forecast - by Location of Deployment
- 9.2.1. Overhead
- 9.2.2. Underground
- 9.2.3. Submarine
- 9.1. Market Analysis, Insights and Forecast - by Voltage Level
- 10. Middle East and Africa Power Distribution Cables Industry Analysis, Insights and Forecast, 2019-2031
- 10.1. Market Analysis, Insights and Forecast - by Voltage Level
- 10.1.1. Low
- 10.1.2. Medium
- 10.1.3. High
- 10.2. Market Analysis, Insights and Forecast - by Location of Deployment
- 10.2.1. Overhead
- 10.2.2. Underground
- 10.2.3. Submarine
- 10.1. Market Analysis, Insights and Forecast - by Voltage Level
- 11. North America Power Distribution Cables Industry Analysis, Insights and Forecast, 2019-2031
- 11.1. Market Analysis, Insights and Forecast - By Country/Sub-region
- 11.1.1 United States
- 11.1.2 Canada
- 11.1.3 Mexico
- 12. Europe Power Distribution Cables Industry Analysis, Insights and Forecast, 2019-2031
- 12.1. Market Analysis, Insights and Forecast - By Country/Sub-region
- 12.1.1 Germany
- 12.1.2 United Kingdom
- 12.1.3 France
- 12.1.4 Spain
- 12.1.5 Italy
- 12.1.6 Spain
- 12.1.7 Belgium
- 12.1.8 Netherland
- 12.1.9 Nordics
- 12.1.10 Rest of Europe
- 13. Asia Pacific Power Distribution Cables Industry Analysis, Insights and Forecast, 2019-2031
- 13.1. Market Analysis, Insights and Forecast - By Country/Sub-region
- 13.1.1 China
- 13.1.2 Japan
- 13.1.3 India
- 13.1.4 South Korea
- 13.1.5 Southeast Asia
- 13.1.6 Australia
- 13.1.7 Indonesia
- 13.1.8 Phillipes
- 13.1.9 Singapore
- 13.1.10 Thailandc
- 13.1.11 Rest of Asia Pacific
- 14. South America Power Distribution Cables Industry Analysis, Insights and Forecast, 2019-2031
- 14.1. Market Analysis, Insights and Forecast - By Country/Sub-region
- 14.1.1 Brazil
- 14.1.2 Argentina
- 14.1.3 Peru
- 14.1.4 Chile
- 14.1.5 Colombia
- 14.1.6 Ecuador
- 14.1.7 Venezuela
- 14.1.8 Rest of South America
- 15. North America Power Distribution Cables Industry Analysis, Insights and Forecast, 2019-2031
- 15.1. Market Analysis, Insights and Forecast - By Country/Sub-region
- 15.1.1 United States
- 15.1.2 Canada
- 15.1.3 Mexico
- 16. MEA Power Distribution Cables Industry Analysis, Insights and Forecast, 2019-2031
- 16.1. Market Analysis, Insights and Forecast - By Country/Sub-region
- 16.1.1 United Arab Emirates
- 16.1.2 Saudi Arabia
- 16.1.3 South Africa
- 16.1.4 Rest of Middle East and Africa
- 17. Competitive Analysis
- 17.1. Global Market Share Analysis 2024
- 17.2. Company Profiles
- 17.2.1 Nexans SA
- 17.2.1.1. Overview
- 17.2.1.2. Products
- 17.2.1.3. SWOT Analysis
- 17.2.1.4. Recent Developments
- 17.2.1.5. Financials (Based on Availability)
- 17.2.2 Sumitomo Electric Industries Limited
- 17.2.2.1. Overview
- 17.2.2.2. Products
- 17.2.2.3. SWOT Analysis
- 17.2.2.4. Recent Developments
- 17.2.2.5. Financials (Based on Availability)
- 17.2.3 Prysmian SpA
- 17.2.3.1. Overview
- 17.2.3.2. Products
- 17.2.3.3. SWOT Analysis
- 17.2.3.4. Recent Developments
- 17.2.3.5. Financials (Based on Availability)
- 17.2.4 Eland Cables Ltd
- 17.2.4.1. Overview
- 17.2.4.2. Products
- 17.2.4.3. SWOT Analysis
- 17.2.4.4. Recent Developments
- 17.2.4.5. Financials (Based on Availability)
- 17.2.5 TE Connectivity Ltd
- 17.2.5.1. Overview
- 17.2.5.2. Products
- 17.2.5.3. SWOT Analysis
- 17.2.5.4. Recent Developments
- 17.2.5.5. Financials (Based on Availability)
- 17.2.6 NKT A/S
- 17.2.6.1. Overview
- 17.2.6.2. Products
- 17.2.6.3. SWOT Analysis
- 17.2.6.4. Recent Developments
- 17.2.6.5. Financials (Based on Availability)
- 17.2.7 Brugg Kabel AG
- 17.2.7.1. Overview
- 17.2.7.2. Products
- 17.2.7.3. SWOT Analysis
- 17.2.7.4. Recent Developments
- 17.2.7.5. Financials (Based on Availability)
- 17.2.8 ABB Limited
- 17.2.8.1. Overview
- 17.2.8.2. Products
- 17.2.8.3. SWOT Analysis
- 17.2.8.4. Recent Developments
- 17.2.8.5. Financials (Based on Availability)
- 17.2.1 Nexans SA
List of Figures
- Figure 1: Global Power Distribution Cables Industry Revenue Breakdown (Million, %) by Region 2024 & 2032
- Figure 2: North America Power Distribution Cables Industry Revenue (Million), by Country 2024 & 2032
- Figure 3: North America Power Distribution Cables Industry Revenue Share (%), by Country 2024 & 2032
- Figure 4: Europe Power Distribution Cables Industry Revenue (Million), by Country 2024 & 2032
- Figure 5: Europe Power Distribution Cables Industry Revenue Share (%), by Country 2024 & 2032
- Figure 6: Asia Pacific Power Distribution Cables Industry Revenue (Million), by Country 2024 & 2032
- Figure 7: Asia Pacific Power Distribution Cables Industry Revenue Share (%), by Country 2024 & 2032
- Figure 8: South America Power Distribution Cables Industry Revenue (Million), by Country 2024 & 2032
- Figure 9: South America Power Distribution Cables Industry Revenue Share (%), by Country 2024 & 2032
- Figure 10: North America Power Distribution Cables Industry Revenue (Million), by Country 2024 & 2032
- Figure 11: North America Power Distribution Cables Industry Revenue Share (%), by Country 2024 & 2032
- Figure 12: MEA Power Distribution Cables Industry Revenue (Million), by Country 2024 & 2032
- Figure 13: MEA Power Distribution Cables Industry Revenue Share (%), by Country 2024 & 2032
- Figure 14: North America Power Distribution Cables Industry Revenue (Million), by Voltage Level 2024 & 2032
- Figure 15: North America Power Distribution Cables Industry Revenue Share (%), by Voltage Level 2024 & 2032
- Figure 16: North America Power Distribution Cables Industry Revenue (Million), by Location of Deployment 2024 & 2032
- Figure 17: North America Power Distribution Cables Industry Revenue Share (%), by Location of Deployment 2024 & 2032
- Figure 18: North America Power Distribution Cables Industry Revenue (Million), by Country 2024 & 2032
- Figure 19: North America Power Distribution Cables Industry Revenue Share (%), by Country 2024 & 2032
- Figure 20: Europe Power Distribution Cables Industry Revenue (Million), by Voltage Level 2024 & 2032
- Figure 21: Europe Power Distribution Cables Industry Revenue Share (%), by Voltage Level 2024 & 2032
- Figure 22: Europe Power Distribution Cables Industry Revenue (Million), by Location of Deployment 2024 & 2032
- Figure 23: Europe Power Distribution Cables Industry Revenue Share (%), by Location of Deployment 2024 & 2032
- Figure 24: Europe Power Distribution Cables Industry Revenue (Million), by Country 2024 & 2032
- Figure 25: Europe Power Distribution Cables Industry Revenue Share (%), by Country 2024 & 2032
- Figure 26: Asia Pacific Power Distribution Cables Industry Revenue (Million), by Voltage Level 2024 & 2032
- Figure 27: Asia Pacific Power Distribution Cables Industry Revenue Share (%), by Voltage Level 2024 & 2032
- Figure 28: Asia Pacific Power Distribution Cables Industry Revenue (Million), by Location of Deployment 2024 & 2032
- Figure 29: Asia Pacific Power Distribution Cables Industry Revenue Share (%), by Location of Deployment 2024 & 2032
- Figure 30: Asia Pacific Power Distribution Cables Industry Revenue (Million), by Country 2024 & 2032
- Figure 31: Asia Pacific Power Distribution Cables Industry Revenue Share (%), by Country 2024 & 2032
- Figure 32: South America Power Distribution Cables Industry Revenue (Million), by Voltage Level 2024 & 2032
- Figure 33: South America Power Distribution Cables Industry Revenue Share (%), by Voltage Level 2024 & 2032
- Figure 34: South America Power Distribution Cables Industry Revenue (Million), by Location of Deployment 2024 & 2032
- Figure 35: South America Power Distribution Cables Industry Revenue Share (%), by Location of Deployment 2024 & 2032
- Figure 36: South America Power Distribution Cables Industry Revenue (Million), by Country 2024 & 2032
- Figure 37: South America Power Distribution Cables Industry Revenue Share (%), by Country 2024 & 2032
- Figure 38: Middle East and Africa Power Distribution Cables Industry Revenue (Million), by Voltage Level 2024 & 2032
- Figure 39: Middle East and Africa Power Distribution Cables Industry Revenue Share (%), by Voltage Level 2024 & 2032
- Figure 40: Middle East and Africa Power Distribution Cables Industry Revenue (Million), by Location of Deployment 2024 & 2032
- Figure 41: Middle East and Africa Power Distribution Cables Industry Revenue Share (%), by Location of Deployment 2024 & 2032
- Figure 42: Middle East and Africa Power Distribution Cables Industry Revenue (Million), by Country 2024 & 2032
- Figure 43: Middle East and Africa Power Distribution Cables Industry Revenue Share (%), by Country 2024 & 2032
List of Tables
- Table 1: Global Power Distribution Cables Industry Revenue Million Forecast, by Region 2019 & 2032
- Table 2: Global Power Distribution Cables Industry Revenue Million Forecast, by Voltage Level 2019 & 2032
- Table 3: Global Power Distribution Cables Industry Revenue Million Forecast, by Location of Deployment 2019 & 2032
- Table 4: Global Power Distribution Cables Industry Revenue Million Forecast, by Region 2019 & 2032
- Table 5: Global Power Distribution Cables Industry Revenue Million Forecast, by Country 2019 & 2032
- Table 6: United States Power Distribution Cables Industry Revenue (Million) Forecast, by Application 2019 & 2032
- Table 7: Canada Power Distribution Cables Industry Revenue (Million) Forecast, by Application 2019 & 2032
- Table 8: Mexico Power Distribution Cables Industry Revenue (Million) Forecast, by Application 2019 & 2032
- Table 9: Global Power Distribution Cables Industry Revenue Million Forecast, by Country 2019 & 2032
- Table 10: Germany Power Distribution Cables Industry Revenue (Million) Forecast, by Application 2019 & 2032
- Table 11: United Kingdom Power Distribution Cables Industry Revenue (Million) Forecast, by Application 2019 & 2032
- Table 12: France Power Distribution Cables Industry Revenue (Million) Forecast, by Application 2019 & 2032
- Table 13: Spain Power Distribution Cables Industry Revenue (Million) Forecast, by Application 2019 & 2032
- Table 14: Italy Power Distribution Cables Industry Revenue (Million) Forecast, by Application 2019 & 2032
- Table 15: Spain Power Distribution Cables Industry Revenue (Million) Forecast, by Application 2019 & 2032
- Table 16: Belgium Power Distribution Cables Industry Revenue (Million) Forecast, by Application 2019 & 2032
- Table 17: Netherland Power Distribution Cables Industry Revenue (Million) Forecast, by Application 2019 & 2032
- Table 18: Nordics Power Distribution Cables Industry Revenue (Million) Forecast, by Application 2019 & 2032
- Table 19: Rest of Europe Power Distribution Cables Industry Revenue (Million) Forecast, by Application 2019 & 2032
- Table 20: Global Power Distribution Cables Industry Revenue Million Forecast, by Country 2019 & 2032
- Table 21: China Power Distribution Cables Industry Revenue (Million) Forecast, by Application 2019 & 2032
- Table 22: Japan Power Distribution Cables Industry Revenue (Million) Forecast, by Application 2019 & 2032
- Table 23: India Power Distribution Cables Industry Revenue (Million) Forecast, by Application 2019 & 2032
- Table 24: South Korea Power Distribution Cables Industry Revenue (Million) Forecast, by Application 2019 & 2032
- Table 25: Southeast Asia Power Distribution Cables Industry Revenue (Million) Forecast, by Application 2019 & 2032
- Table 26: Australia Power Distribution Cables Industry Revenue (Million) Forecast, by Application 2019 & 2032
- Table 27: Indonesia Power Distribution Cables Industry Revenue (Million) Forecast, by Application 2019 & 2032
- Table 28: Phillipes Power Distribution Cables Industry Revenue (Million) Forecast, by Application 2019 & 2032
- Table 29: Singapore Power Distribution Cables Industry Revenue (Million) Forecast, by Application 2019 & 2032
- Table 30: Thailandc Power Distribution Cables Industry Revenue (Million) Forecast, by Application 2019 & 2032
- Table 31: Rest of Asia Pacific Power Distribution Cables Industry Revenue (Million) Forecast, by Application 2019 & 2032
- Table 32: Global Power Distribution Cables Industry Revenue Million Forecast, by Country 2019 & 2032
- Table 33: Brazil Power Distribution Cables Industry Revenue (Million) Forecast, by Application 2019 & 2032
- Table 34: Argentina Power Distribution Cables Industry Revenue (Million) Forecast, by Application 2019 & 2032
- Table 35: Peru Power Distribution Cables Industry Revenue (Million) Forecast, by Application 2019 & 2032
- Table 36: Chile Power Distribution Cables Industry Revenue (Million) Forecast, by Application 2019 & 2032
- Table 37: Colombia Power Distribution Cables Industry Revenue (Million) Forecast, by Application 2019 & 2032
- Table 38: Ecuador Power Distribution Cables Industry Revenue (Million) Forecast, by Application 2019 & 2032
- Table 39: Venezuela Power Distribution Cables Industry Revenue (Million) Forecast, by Application 2019 & 2032
- Table 40: Rest of South America Power Distribution Cables Industry Revenue (Million) Forecast, by Application 2019 & 2032
- Table 41: Global Power Distribution Cables Industry Revenue Million Forecast, by Country 2019 & 2032
- Table 42: United States Power Distribution Cables Industry Revenue (Million) Forecast, by Application 2019 & 2032
- Table 43: Canada Power Distribution Cables Industry Revenue (Million) Forecast, by Application 2019 & 2032
- Table 44: Mexico Power Distribution Cables Industry Revenue (Million) Forecast, by Application 2019 & 2032
- Table 45: Global Power Distribution Cables Industry Revenue Million Forecast, by Country 2019 & 2032
- Table 46: United Arab Emirates Power Distribution Cables Industry Revenue (Million) Forecast, by Application 2019 & 2032
- Table 47: Saudi Arabia Power Distribution Cables Industry Revenue (Million) Forecast, by Application 2019 & 2032
- Table 48: South Africa Power Distribution Cables Industry Revenue (Million) Forecast, by Application 2019 & 2032
- Table 49: Rest of Middle East and Africa Power Distribution Cables Industry Revenue (Million) Forecast, by Application 2019 & 2032
- Table 50: Global Power Distribution Cables Industry Revenue Million Forecast, by Voltage Level 2019 & 2032
- Table 51: Global Power Distribution Cables Industry Revenue Million Forecast, by Location of Deployment 2019 & 2032
- Table 52: Global Power Distribution Cables Industry Revenue Million Forecast, by Country 2019 & 2032
- Table 53: Global Power Distribution Cables Industry Revenue Million Forecast, by Voltage Level 2019 & 2032
- Table 54: Global Power Distribution Cables Industry Revenue Million Forecast, by Location of Deployment 2019 & 2032
- Table 55: Global Power Distribution Cables Industry Revenue Million Forecast, by Country 2019 & 2032
- Table 56: Global Power Distribution Cables Industry Revenue Million Forecast, by Voltage Level 2019 & 2032
- Table 57: Global Power Distribution Cables Industry Revenue Million Forecast, by Location of Deployment 2019 & 2032
- Table 58: Global Power Distribution Cables Industry Revenue Million Forecast, by Country 2019 & 2032
- Table 59: Global Power Distribution Cables Industry Revenue Million Forecast, by Voltage Level 2019 & 2032
- Table 60: Global Power Distribution Cables Industry Revenue Million Forecast, by Location of Deployment 2019 & 2032
- Table 61: Global Power Distribution Cables Industry Revenue Million Forecast, by Country 2019 & 2032
- Table 62: Global Power Distribution Cables Industry Revenue Million Forecast, by Voltage Level 2019 & 2032
- Table 63: Global Power Distribution Cables Industry Revenue Million Forecast, by Location of Deployment 2019 & 2032
- Table 64: Global Power Distribution Cables Industry Revenue Million Forecast, by Country 2019 & 2032
Frequently Asked Questions
1. What is the projected Compound Annual Growth Rate (CAGR) of the Power Distribution Cables Industry?
The projected CAGR is approximately 4.00%.
2. Which companies are prominent players in the Power Distribution Cables Industry?
Key companies in the market include Nexans SA, Sumitomo Electric Industries Limited, Prysmian SpA, Eland Cables Ltd, TE Connectivity Ltd, NKT A/S, Brugg Kabel AG, ABB Limited.
3. What are the main segments of the Power Distribution Cables Industry?
The market segments include Voltage Level, Location of Deployment.
4. Can you provide details about the market size?
The market size is estimated to be USD XX Million as of 2022.
5. What are some drivers contributing to market growth?
Urbanization is a major driver for the power distribution cables market. As cities expand. there is a need for reliable and upgraded electrical infrastructure to meet the growing energy demand. Developing countries. in particular. are investing heavily in modernizing their power distribution systems to accommodate population growth and economic expansion..
6. What are the notable trends driving market growth?
The smart grid is a major trend in the power distribution sector. Smart grids use advanced communication and control technologies to improve the reliability and efficiency of power distribution. They enable real-time monitoring. fault detection. and optimization of energy use. reducing losses and enhancing grid stability..
7. Are there any restraints impacting market growth?
The initial capital investment required to manufacture and install power distribution cables can be significant. This includes costs related to raw materials. manufacturing processes. and installation infrastructure..
8. Can you provide examples of recent developments in the market?
December 2022: NKT was awarded a turnkey cable system contract for the electrification of the North of Alvheim (NOA) and Krafla offshore fields in the North Sea's NOAKA area. More than 255 kilometers of 145kV high-voltage AC power cables will be designed, manufactured, and installed by the cable-laying vessel NKT Victoria.
9. What pricing options are available for accessing the report?
Pricing options include single-user, multi-user, and enterprise licenses priced at USD 4750, USD 5250, and USD 8750 respectively.
10. Is the market size provided in terms of value or volume?
The market size is provided in terms of value, measured in Million.
11. Are there any specific market keywords associated with the report?
Yes, the market keyword associated with the report is "Power Distribution Cables Industry," which aids in identifying and referencing the specific market segment covered.
12. How do I determine which pricing option suits my needs best?
The pricing options vary based on user requirements and access needs. Individual users may opt for single-user licenses, while businesses requiring broader access may choose multi-user or enterprise licenses for cost-effective access to the report.
13. Are there any additional resources or data provided in the Power Distribution Cables Industry report?
While the report offers comprehensive insights, it's advisable to review the specific contents or supplementary materials provided to ascertain if additional resources or data are available.
14. How can I stay updated on further developments or reports in the Power Distribution Cables Industry?
To stay informed about further developments, trends, and reports in the Power Distribution Cables Industry, consider subscribing to industry newsletters, following relevant companies and organizations, or regularly checking reputable industry news sources and publications.
Methodology
Step 1 - Identification of Relevant Samples Size from Population Database


Step 2 - Approaches for Defining Global Market Size (Value, Volume* & Price*)

Note*: In applicable scenarios
Step 3 - Data Sources
Primary Research
- Web Analytics
- Survey Reports
- Research Institute
- Latest Research Reports
- Opinion Leaders
Secondary Research
- Annual Reports
- White Paper
- Latest Press Release
- Industry Association
- Paid Database
- Investor Presentations

Step 4 - Data Triangulation
Involves using different sources of information in order to increase the validity of a study
These sources are likely to be stakeholders in a program - participants, other researchers, program staff, other community members, and so on.
Then we put all data in single framework & apply various statistical tools to find out the dynamic on the market.
During the analysis stage, feedback from the stakeholder groups would be compared to determine areas of agreement as well as areas of divergence


