
Key Insights
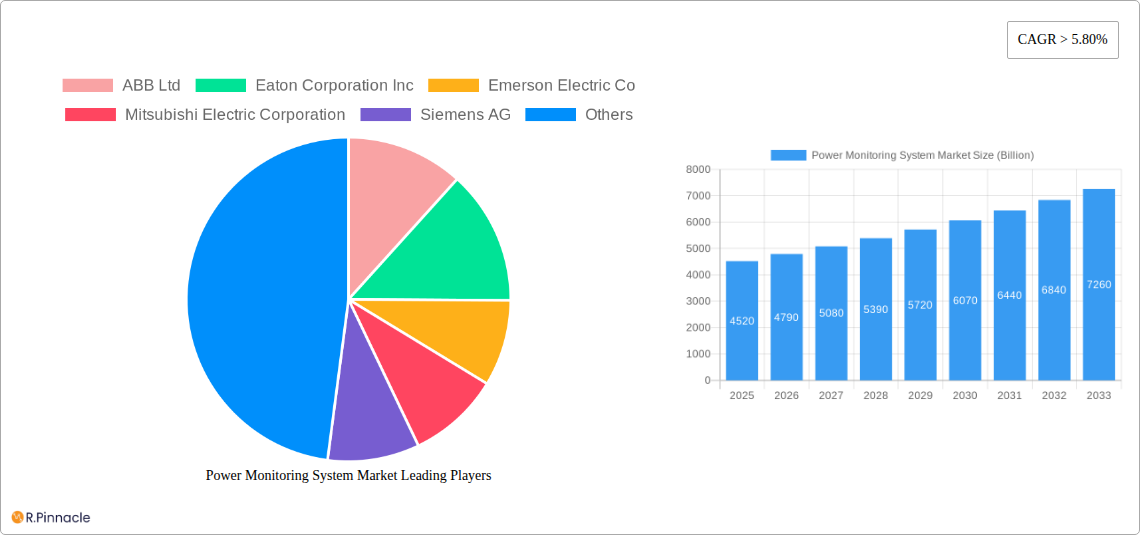
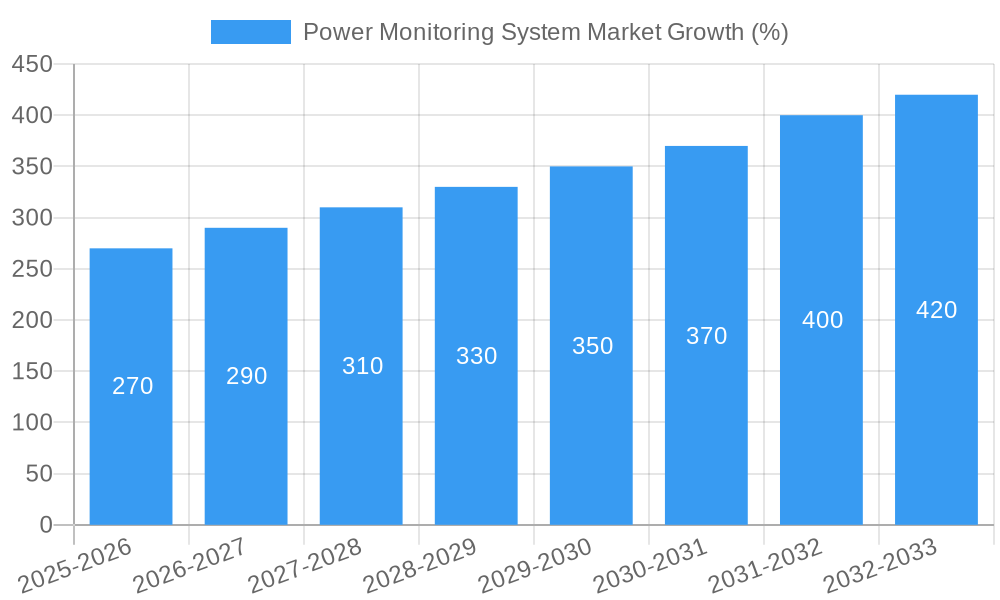
The Power Monitoring System market is experiencing robust growth, projected to reach a market size of $4.52 billion in 2025 and maintain a Compound Annual Growth Rate (CAGR) exceeding 5.80% from 2025 to 2033. This expansion is driven by several key factors. The increasing demand for energy efficiency and grid modernization across commercial, industrial, and utility sectors fuels the adoption of advanced power monitoring solutions. Stringent government regulations aimed at reducing carbon emissions and improving energy reliability are further bolstering market growth. Furthermore, the integration of smart technologies, such as IoT sensors and advanced analytics, enables real-time monitoring and predictive maintenance, significantly enhancing operational efficiency and reducing downtime. Technological advancements in power monitoring systems, including the development of more accurate, reliable, and cost-effective solutions, are also contributing to market expansion. Growth is particularly strong in regions like North America and Asia-Pacific, driven by substantial investments in infrastructure development and a rising focus on sustainable energy practices.
The market segmentation reveals significant opportunities across various end-user segments. The commercial and industrial sectors are major contributors, driven by the need for optimizing energy consumption and improving operational efficiency. Utility companies are also increasingly adopting power monitoring systems to enhance grid stability and reliability. The "Others" segment, encompassing residential and smaller-scale applications, is also witnessing gradual growth. Major players such as ABB, Eaton, Emerson, Mitsubishi Electric, Siemens, Schneider Electric, and others are shaping market dynamics through their innovative product offerings and strategic partnerships. Competition is fierce, prompting continuous innovation and the development of sophisticated solutions tailored to specific industry requirements. While factors like high initial investment costs and the complexities of integrating systems can pose challenges, the long-term benefits of improved energy management and reduced operational costs are incentivizing widespread adoption. Continued technological advancements and supportive government policies will likely drive sustained growth in the Power Monitoring System market throughout the forecast period.
Power Monitoring System Market: A Comprehensive Report (2019-2033)
This in-depth report provides a comprehensive analysis of the Power Monitoring System market, offering invaluable insights for industry professionals, investors, and strategic decision-makers. The study period covers 2019-2033, with a base year of 2025 and a forecast period spanning 2025-2033. The market is projected to reach a value exceeding XX Billion by 2033, exhibiting a CAGR of XX% during the forecast period. Key players analyzed include ABB Ltd, Eaton Corporation Inc, Emerson Electric Co, Mitsubishi Electric Corporation, Siemens AG, Schneider Electric SE, Fuji Electric FA Components & Systems Co Ltd, Fluke Corporation, Rockwell Automation Inc, Yokogawa Electric Corporation, and General Electric Company. This is not an exhaustive list.
Power Monitoring System Market Structure & Innovation Trends
The Power Monitoring System market demonstrates a moderately concentrated structure, with a few dominant players holding significant market share. ABB Ltd., Siemens AG, and Schneider Electric SE collectively account for approximately XX% of the global market. Innovation is primarily driven by the increasing demand for energy efficiency, grid modernization, and the integration of renewable energy sources. Stringent regulatory frameworks focused on energy conservation and emissions reduction are further propelling market growth. The market faces competition from alternative technologies like smart meters, but the advanced analytics and comprehensive data offered by Power Monitoring Systems provide a significant competitive advantage. The market has experienced substantial M&A activity in recent years, with deal values exceeding XX Billion between 2019 and 2024. These activities have significantly altered the market landscape, leading to increased consolidation and a more competitive environment.
- Market Concentration: Moderately concentrated, with top three players holding XX% market share.
- Innovation Drivers: Energy efficiency, grid modernization, renewable energy integration, and regulatory pressures.
- M&A Activity (2019-2024): Deal values exceeding XX Billion, leading to market consolidation.
- End-User Demographics: Growing adoption across commercial, industrial, and utility sectors.
Power Monitoring System Market Dynamics & Trends
The Power Monitoring System market is experiencing robust growth, fueled by several key factors. The increasing adoption of smart grids and the need for real-time power monitoring are major drivers. Technological advancements, such as the integration of Artificial Intelligence (AI) and the Internet of Things (IoT), are enhancing the capabilities of power monitoring systems, leading to improved energy management and reduced operational costs. Consumer preference is shifting towards sophisticated systems capable of providing actionable insights for optimizing energy consumption. The competitive landscape is highly dynamic, with ongoing innovation and strategic partnerships shaping the market. The market penetration rate is currently at XX%, with significant potential for future growth, especially in developing economies.
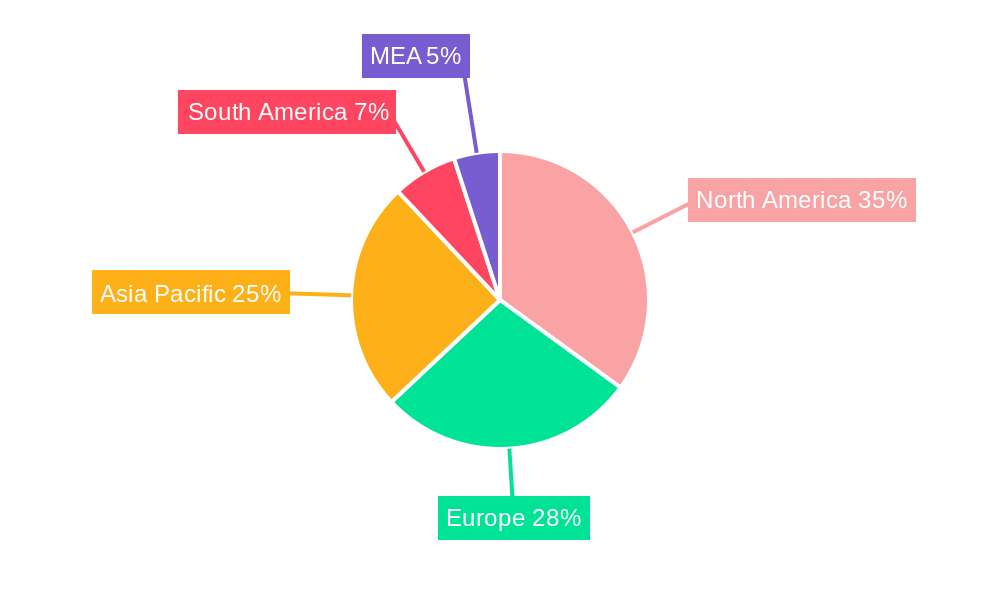
Dominant Regions & Segments in Power Monitoring System Market
North America currently holds the largest market share in the Power Monitoring System market, driven by robust infrastructure development, stringent environmental regulations, and high adoption rates in the commercial and industrial sectors.
- Key Drivers in North America:
- Stringent environmental regulations promoting energy efficiency.
- Significant investments in grid modernization and smart grid technologies.
- High adoption rates in the commercial and industrial sectors.
- Dominance Analysis: North America's dominance stems from a combination of supportive government policies, advanced infrastructure, and a high concentration of key industry players. Europe and Asia Pacific are also experiencing significant growth, fueled by increasing industrialization and urbanization.
The Commercial and Industrial segment dominates the end-user landscape, driven by the need for efficient energy management and cost optimization within large-scale operations.
Power Monitoring System Market Product Innovations
Recent product developments focus on enhancing system accuracy, improving data analytics capabilities, and integrating advanced communication protocols. The integration of AI and machine learning allows for predictive maintenance and improved operational efficiency. Power Monitoring Systems with cloud-based platforms are gaining traction, offering remote monitoring and data accessibility. These innovations enhance market fit by addressing the growing demand for sophisticated, data-driven solutions for power management and optimization.
Report Scope & Segmentation Analysis
This report segments the Power Monitoring System market based on end-user:
- Commercial and Industrial: This segment is projected to exhibit significant growth due to the rising need for energy efficiency and cost reduction in commercial and industrial settings. The market is characterized by high competition and a wide range of solutions available. Market size for 2025 is estimated at XX Billion.
- Utilities: The utility sector is adopting advanced power monitoring systems to enhance grid stability, optimize energy distribution, and improve overall efficiency. This segment presents significant growth opportunities. Market size for 2025 is estimated at XX Billion.
- Others: This segment encompasses other applications such as residential and transportation, with moderate growth expected. Market size for 2025 is estimated at XX Billion.
Key Drivers of Power Monitoring System Market Growth
Several factors are contributing to the growth of the Power Monitoring System market. The increasing demand for energy efficiency and reduction of carbon footprint is a primary driver, leading to widespread adoption of these systems. Government regulations and incentives promoting renewable energy integration further fuel market expansion. Technological advancements like AI, IoT, and advanced analytics enhance system capabilities, making them more attractive to end-users.
Challenges in the Power Monitoring System Market Sector
The market faces challenges such as high initial investment costs, concerns about data security and privacy, and the complexity of integrating systems with existing infrastructure. Supply chain disruptions can impact the availability of components, while intense competition puts pressure on pricing and profit margins. These factors can collectively impact the market growth rate by approximately XX%.
Emerging Opportunities in Power Monitoring System Market
Emerging opportunities lie in the integration of renewable energy sources, the development of smart city initiatives, and the expansion into developing economies. The adoption of advanced analytics and predictive maintenance capabilities offers further growth potential. The increasing demand for real-time data and remote monitoring creates opportunities for cloud-based solutions.
Leading Players in the Power Monitoring System Market
- ABB Ltd
- Eaton Corporation Inc
- Emerson Electric Co
- Mitsubishi Electric Corporation
- Siemens AG
- Schneider Electric SE
- Fuji Electric FA Components & Systems Co Ltd
- Fluke Corporation
- Rockwell Automation Inc
- Yokogawa Electric Corporation
- General Electric Company
Key Developments in Power Monitoring System Market Industry
- 2024 Q4: ABB Ltd. launched a new power monitoring system with enhanced AI capabilities.
- 2023 Q3: Siemens AG and Schneider Electric SE formed a strategic partnership to integrate their power monitoring solutions.
- 2022 Q2: Eaton Corporation Inc. acquired a smaller power monitoring system company, expanding its market presence.
Future Outlook for Power Monitoring System Market
The Power Monitoring System market is poised for continued growth, driven by technological advancements, increasing demand for energy efficiency, and supportive government policies. Strategic partnerships and acquisitions will continue to shape the market landscape. Expansion into emerging markets and the development of innovative solutions will unlock significant future potential, contributing to substantial market expansion.
Power Monitoring System Market Segmentation
-
1. End-User
- 1.1. Commercial and Industrial
- 1.2. Utilities
- 1.3. Others
Power Monitoring System Market Segmentation By Geography
- 1. North America
- 2. Europe
- 3. Asia Pacific
- 4. South America
- 5. Middle East and Africa
Power Monitoring System Market REPORT HIGHLIGHTS
| Aspects | Details |
|---|---|
| Study Period | 2019-2033 |
| Base Year | 2024 |
| Estimated Year | 2025 |
| Forecast Period | 2025-2033 |
| Historical Period | 2019-2024 |
| Growth Rate | CAGR of > 5.80% from 2019-2033 |
| Segmentation |
|
Table of Contents
- 1. Introduction
- 1.1. Research Scope
- 1.2. Market Segmentation
- 1.3. Research Methodology
- 1.4. Definitions and Assumptions
- 2. Executive Summary
- 2.1. Introduction
- 3. Market Dynamics
- 3.1. Introduction
- 3.2. Market Drivers
- 3.2.1. 4.; Growing Energy Demand4.; Renewable Energy Transition
- 3.3. Market Restrains
- 3.3.1. 4.; Phasing out of Conventional Sources of Electricity
- 3.4. Market Trends
- 3.4.1. Commercial and Industrial Segment to Witness Significant Growth
- 4. Market Factor Analysis
- 4.1. Porters Five Forces
- 4.2. Supply/Value Chain
- 4.3. PESTEL analysis
- 4.4. Market Entropy
- 4.5. Patent/Trademark Analysis
- 5. Global Power Monitoring System Market Analysis, Insights and Forecast, 2019-2031
- 5.1. Market Analysis, Insights and Forecast - by End-User
- 5.1.1. Commercial and Industrial
- 5.1.2. Utilities
- 5.1.3. Others
- 5.2. Market Analysis, Insights and Forecast - by Region
- 5.2.1. North America
- 5.2.2. Europe
- 5.2.3. Asia Pacific
- 5.2.4. South America
- 5.2.5. Middle East and Africa
- 5.1. Market Analysis, Insights and Forecast - by End-User
- 6. North America Power Monitoring System Market Analysis, Insights and Forecast, 2019-2031
- 6.1. Market Analysis, Insights and Forecast - by End-User
- 6.1.1. Commercial and Industrial
- 6.1.2. Utilities
- 6.1.3. Others
- 6.1. Market Analysis, Insights and Forecast - by End-User
- 7. Europe Power Monitoring System Market Analysis, Insights and Forecast, 2019-2031
- 7.1. Market Analysis, Insights and Forecast - by End-User
- 7.1.1. Commercial and Industrial
- 7.1.2. Utilities
- 7.1.3. Others
- 7.1. Market Analysis, Insights and Forecast - by End-User
- 8. Asia Pacific Power Monitoring System Market Analysis, Insights and Forecast, 2019-2031
- 8.1. Market Analysis, Insights and Forecast - by End-User
- 8.1.1. Commercial and Industrial
- 8.1.2. Utilities
- 8.1.3. Others
- 8.1. Market Analysis, Insights and Forecast - by End-User
- 9. South America Power Monitoring System Market Analysis, Insights and Forecast, 2019-2031
- 9.1. Market Analysis, Insights and Forecast - by End-User
- 9.1.1. Commercial and Industrial
- 9.1.2. Utilities
- 9.1.3. Others
- 9.1. Market Analysis, Insights and Forecast - by End-User
- 10. Middle East and Africa Power Monitoring System Market Analysis, Insights and Forecast, 2019-2031
- 10.1. Market Analysis, Insights and Forecast - by End-User
- 10.1.1. Commercial and Industrial
- 10.1.2. Utilities
- 10.1.3. Others
- 10.1. Market Analysis, Insights and Forecast - by End-User
- 11. North America Power Monitoring System Market Analysis, Insights and Forecast, 2019-2031
- 11.1. Market Analysis, Insights and Forecast - By Country/Sub-region
- 11.1.1 United States
- 11.1.2 Canada
- 11.1.3 Mexico
- 12. Europe Power Monitoring System Market Analysis, Insights and Forecast, 2019-2031
- 12.1. Market Analysis, Insights and Forecast - By Country/Sub-region
- 12.1.1 Germany
- 12.1.2 United Kingdom
- 12.1.3 France
- 12.1.4 Spain
- 12.1.5 Italy
- 12.1.6 Spain
- 12.1.7 Belgium
- 12.1.8 Netherland
- 12.1.9 Nordics
- 12.1.10 Rest of Europe
- 13. Asia Pacific Power Monitoring System Market Analysis, Insights and Forecast, 2019-2031
- 13.1. Market Analysis, Insights and Forecast - By Country/Sub-region
- 13.1.1 China
- 13.1.2 Japan
- 13.1.3 India
- 13.1.4 South Korea
- 13.1.5 Southeast Asia
- 13.1.6 Australia
- 13.1.7 Indonesia
- 13.1.8 Phillipes
- 13.1.9 Singapore
- 13.1.10 Thailandc
- 13.1.11 Rest of Asia Pacific
- 14. South America Power Monitoring System Market Analysis, Insights and Forecast, 2019-2031
- 14.1. Market Analysis, Insights and Forecast - By Country/Sub-region
- 14.1.1 Brazil
- 14.1.2 Argentina
- 14.1.3 Peru
- 14.1.4 Chile
- 14.1.5 Colombia
- 14.1.6 Ecuador
- 14.1.7 Venezuela
- 14.1.8 Rest of South America
- 15. North America Power Monitoring System Market Analysis, Insights and Forecast, 2019-2031
- 15.1. Market Analysis, Insights and Forecast - By Country/Sub-region
- 15.1.1 United States
- 15.1.2 Canada
- 15.1.3 Mexico
- 16. MEA Power Monitoring System Market Analysis, Insights and Forecast, 2019-2031
- 16.1. Market Analysis, Insights and Forecast - By Country/Sub-region
- 16.1.1 United Arab Emirates
- 16.1.2 Saudi Arabia
- 16.1.3 South Africa
- 16.1.4 Rest of Middle East and Africa
- 17. Competitive Analysis
- 17.1. Global Market Share Analysis 2024
- 17.2. Company Profiles
- 17.2.1 ABB Ltd
- 17.2.1.1. Overview
- 17.2.1.2. Products
- 17.2.1.3. SWOT Analysis
- 17.2.1.4. Recent Developments
- 17.2.1.5. Financials (Based on Availability)
- 17.2.2 Eaton Corporation Inc
- 17.2.2.1. Overview
- 17.2.2.2. Products
- 17.2.2.3. SWOT Analysis
- 17.2.2.4. Recent Developments
- 17.2.2.5. Financials (Based on Availability)
- 17.2.3 Emerson Electric Co
- 17.2.3.1. Overview
- 17.2.3.2. Products
- 17.2.3.3. SWOT Analysis
- 17.2.3.4. Recent Developments
- 17.2.3.5. Financials (Based on Availability)
- 17.2.4 Mitsubishi Electric Corporation
- 17.2.4.1. Overview
- 17.2.4.2. Products
- 17.2.4.3. SWOT Analysis
- 17.2.4.4. Recent Developments
- 17.2.4.5. Financials (Based on Availability)
- 17.2.5 Siemens AG
- 17.2.5.1. Overview
- 17.2.5.2. Products
- 17.2.5.3. SWOT Analysis
- 17.2.5.4. Recent Developments
- 17.2.5.5. Financials (Based on Availability)
- 17.2.6 Schneider Electric SE
- 17.2.6.1. Overview
- 17.2.6.2. Products
- 17.2.6.3. SWOT Analysis
- 17.2.6.4. Recent Developments
- 17.2.6.5. Financials (Based on Availability)
- 17.2.7 Fuji Electric FA Components & Systems Co Ltd *List Not Exhaustive
- 17.2.7.1. Overview
- 17.2.7.2. Products
- 17.2.7.3. SWOT Analysis
- 17.2.7.4. Recent Developments
- 17.2.7.5. Financials (Based on Availability)
- 17.2.8 Fluke Corporation
- 17.2.8.1. Overview
- 17.2.8.2. Products
- 17.2.8.3. SWOT Analysis
- 17.2.8.4. Recent Developments
- 17.2.8.5. Financials (Based on Availability)
- 17.2.9 Rockwell Automation Inc
- 17.2.9.1. Overview
- 17.2.9.2. Products
- 17.2.9.3. SWOT Analysis
- 17.2.9.4. Recent Developments
- 17.2.9.5. Financials (Based on Availability)
- 17.2.10 Yokogawa Electric Corporation
- 17.2.10.1. Overview
- 17.2.10.2. Products
- 17.2.10.3. SWOT Analysis
- 17.2.10.4. Recent Developments
- 17.2.10.5. Financials (Based on Availability)
- 17.2.11 General Electric Company
- 17.2.11.1. Overview
- 17.2.11.2. Products
- 17.2.11.3. SWOT Analysis
- 17.2.11.4. Recent Developments
- 17.2.11.5. Financials (Based on Availability)
- 17.2.1 ABB Ltd
List of Figures
- Figure 1: Global Power Monitoring System Market Revenue Breakdown (Billion, %) by Region 2024 & 2032
- Figure 2: North America Power Monitoring System Market Revenue (Billion), by Country 2024 & 2032
- Figure 3: North America Power Monitoring System Market Revenue Share (%), by Country 2024 & 2032
- Figure 4: Europe Power Monitoring System Market Revenue (Billion), by Country 2024 & 2032
- Figure 5: Europe Power Monitoring System Market Revenue Share (%), by Country 2024 & 2032
- Figure 6: Asia Pacific Power Monitoring System Market Revenue (Billion), by Country 2024 & 2032
- Figure 7: Asia Pacific Power Monitoring System Market Revenue Share (%), by Country 2024 & 2032
- Figure 8: South America Power Monitoring System Market Revenue (Billion), by Country 2024 & 2032
- Figure 9: South America Power Monitoring System Market Revenue Share (%), by Country 2024 & 2032
- Figure 10: North America Power Monitoring System Market Revenue (Billion), by Country 2024 & 2032
- Figure 11: North America Power Monitoring System Market Revenue Share (%), by Country 2024 & 2032
- Figure 12: MEA Power Monitoring System Market Revenue (Billion), by Country 2024 & 2032
- Figure 13: MEA Power Monitoring System Market Revenue Share (%), by Country 2024 & 2032
- Figure 14: North America Power Monitoring System Market Revenue (Billion), by End-User 2024 & 2032
- Figure 15: North America Power Monitoring System Market Revenue Share (%), by End-User 2024 & 2032
- Figure 16: North America Power Monitoring System Market Revenue (Billion), by Country 2024 & 2032
- Figure 17: North America Power Monitoring System Market Revenue Share (%), by Country 2024 & 2032
- Figure 18: Europe Power Monitoring System Market Revenue (Billion), by End-User 2024 & 2032
- Figure 19: Europe Power Monitoring System Market Revenue Share (%), by End-User 2024 & 2032
- Figure 20: Europe Power Monitoring System Market Revenue (Billion), by Country 2024 & 2032
- Figure 21: Europe Power Monitoring System Market Revenue Share (%), by Country 2024 & 2032
- Figure 22: Asia Pacific Power Monitoring System Market Revenue (Billion), by End-User 2024 & 2032
- Figure 23: Asia Pacific Power Monitoring System Market Revenue Share (%), by End-User 2024 & 2032
- Figure 24: Asia Pacific Power Monitoring System Market Revenue (Billion), by Country 2024 & 2032
- Figure 25: Asia Pacific Power Monitoring System Market Revenue Share (%), by Country 2024 & 2032
- Figure 26: South America Power Monitoring System Market Revenue (Billion), by End-User 2024 & 2032
- Figure 27: South America Power Monitoring System Market Revenue Share (%), by End-User 2024 & 2032
- Figure 28: South America Power Monitoring System Market Revenue (Billion), by Country 2024 & 2032
- Figure 29: South America Power Monitoring System Market Revenue Share (%), by Country 2024 & 2032
- Figure 30: Middle East and Africa Power Monitoring System Market Revenue (Billion), by End-User 2024 & 2032
- Figure 31: Middle East and Africa Power Monitoring System Market Revenue Share (%), by End-User 2024 & 2032
- Figure 32: Middle East and Africa Power Monitoring System Market Revenue (Billion), by Country 2024 & 2032
- Figure 33: Middle East and Africa Power Monitoring System Market Revenue Share (%), by Country 2024 & 2032
List of Tables
- Table 1: Global Power Monitoring System Market Revenue Billion Forecast, by Region 2019 & 2032
- Table 2: Global Power Monitoring System Market Revenue Billion Forecast, by End-User 2019 & 2032
- Table 3: Global Power Monitoring System Market Revenue Billion Forecast, by Region 2019 & 2032
- Table 4: Global Power Monitoring System Market Revenue Billion Forecast, by Country 2019 & 2032
- Table 5: United States Power Monitoring System Market Revenue (Billion) Forecast, by Application 2019 & 2032
- Table 6: Canada Power Monitoring System Market Revenue (Billion) Forecast, by Application 2019 & 2032
- Table 7: Mexico Power Monitoring System Market Revenue (Billion) Forecast, by Application 2019 & 2032
- Table 8: Global Power Monitoring System Market Revenue Billion Forecast, by Country 2019 & 2032
- Table 9: Germany Power Monitoring System Market Revenue (Billion) Forecast, by Application 2019 & 2032
- Table 10: United Kingdom Power Monitoring System Market Revenue (Billion) Forecast, by Application 2019 & 2032
- Table 11: France Power Monitoring System Market Revenue (Billion) Forecast, by Application 2019 & 2032
- Table 12: Spain Power Monitoring System Market Revenue (Billion) Forecast, by Application 2019 & 2032
- Table 13: Italy Power Monitoring System Market Revenue (Billion) Forecast, by Application 2019 & 2032
- Table 14: Spain Power Monitoring System Market Revenue (Billion) Forecast, by Application 2019 & 2032
- Table 15: Belgium Power Monitoring System Market Revenue (Billion) Forecast, by Application 2019 & 2032
- Table 16: Netherland Power Monitoring System Market Revenue (Billion) Forecast, by Application 2019 & 2032
- Table 17: Nordics Power Monitoring System Market Revenue (Billion) Forecast, by Application 2019 & 2032
- Table 18: Rest of Europe Power Monitoring System Market Revenue (Billion) Forecast, by Application 2019 & 2032
- Table 19: Global Power Monitoring System Market Revenue Billion Forecast, by Country 2019 & 2032
- Table 20: China Power Monitoring System Market Revenue (Billion) Forecast, by Application 2019 & 2032
- Table 21: Japan Power Monitoring System Market Revenue (Billion) Forecast, by Application 2019 & 2032
- Table 22: India Power Monitoring System Market Revenue (Billion) Forecast, by Application 2019 & 2032
- Table 23: South Korea Power Monitoring System Market Revenue (Billion) Forecast, by Application 2019 & 2032
- Table 24: Southeast Asia Power Monitoring System Market Revenue (Billion) Forecast, by Application 2019 & 2032
- Table 25: Australia Power Monitoring System Market Revenue (Billion) Forecast, by Application 2019 & 2032
- Table 26: Indonesia Power Monitoring System Market Revenue (Billion) Forecast, by Application 2019 & 2032
- Table 27: Phillipes Power Monitoring System Market Revenue (Billion) Forecast, by Application 2019 & 2032
- Table 28: Singapore Power Monitoring System Market Revenue (Billion) Forecast, by Application 2019 & 2032
- Table 29: Thailandc Power Monitoring System Market Revenue (Billion) Forecast, by Application 2019 & 2032
- Table 30: Rest of Asia Pacific Power Monitoring System Market Revenue (Billion) Forecast, by Application 2019 & 2032
- Table 31: Global Power Monitoring System Market Revenue Billion Forecast, by Country 2019 & 2032
- Table 32: Brazil Power Monitoring System Market Revenue (Billion) Forecast, by Application 2019 & 2032
- Table 33: Argentina Power Monitoring System Market Revenue (Billion) Forecast, by Application 2019 & 2032
- Table 34: Peru Power Monitoring System Market Revenue (Billion) Forecast, by Application 2019 & 2032
- Table 35: Chile Power Monitoring System Market Revenue (Billion) Forecast, by Application 2019 & 2032
- Table 36: Colombia Power Monitoring System Market Revenue (Billion) Forecast, by Application 2019 & 2032
- Table 37: Ecuador Power Monitoring System Market Revenue (Billion) Forecast, by Application 2019 & 2032
- Table 38: Venezuela Power Monitoring System Market Revenue (Billion) Forecast, by Application 2019 & 2032
- Table 39: Rest of South America Power Monitoring System Market Revenue (Billion) Forecast, by Application 2019 & 2032
- Table 40: Global Power Monitoring System Market Revenue Billion Forecast, by Country 2019 & 2032
- Table 41: United States Power Monitoring System Market Revenue (Billion) Forecast, by Application 2019 & 2032
- Table 42: Canada Power Monitoring System Market Revenue (Billion) Forecast, by Application 2019 & 2032
- Table 43: Mexico Power Monitoring System Market Revenue (Billion) Forecast, by Application 2019 & 2032
- Table 44: Global Power Monitoring System Market Revenue Billion Forecast, by Country 2019 & 2032
- Table 45: United Arab Emirates Power Monitoring System Market Revenue (Billion) Forecast, by Application 2019 & 2032
- Table 46: Saudi Arabia Power Monitoring System Market Revenue (Billion) Forecast, by Application 2019 & 2032
- Table 47: South Africa Power Monitoring System Market Revenue (Billion) Forecast, by Application 2019 & 2032
- Table 48: Rest of Middle East and Africa Power Monitoring System Market Revenue (Billion) Forecast, by Application 2019 & 2032
- Table 49: Global Power Monitoring System Market Revenue Billion Forecast, by End-User 2019 & 2032
- Table 50: Global Power Monitoring System Market Revenue Billion Forecast, by Country 2019 & 2032
- Table 51: Global Power Monitoring System Market Revenue Billion Forecast, by End-User 2019 & 2032
- Table 52: Global Power Monitoring System Market Revenue Billion Forecast, by Country 2019 & 2032
- Table 53: Global Power Monitoring System Market Revenue Billion Forecast, by End-User 2019 & 2032
- Table 54: Global Power Monitoring System Market Revenue Billion Forecast, by Country 2019 & 2032
- Table 55: Global Power Monitoring System Market Revenue Billion Forecast, by End-User 2019 & 2032
- Table 56: Global Power Monitoring System Market Revenue Billion Forecast, by Country 2019 & 2032
- Table 57: Global Power Monitoring System Market Revenue Billion Forecast, by End-User 2019 & 2032
- Table 58: Global Power Monitoring System Market Revenue Billion Forecast, by Country 2019 & 2032
Frequently Asked Questions
1. What is the projected Compound Annual Growth Rate (CAGR) of the Power Monitoring System Market?
The projected CAGR is approximately > 5.80%.
2. Which companies are prominent players in the Power Monitoring System Market?
Key companies in the market include ABB Ltd, Eaton Corporation Inc, Emerson Electric Co, Mitsubishi Electric Corporation, Siemens AG, Schneider Electric SE, Fuji Electric FA Components & Systems Co Ltd *List Not Exhaustive, Fluke Corporation, Rockwell Automation Inc, Yokogawa Electric Corporation, General Electric Company.
3. What are the main segments of the Power Monitoring System Market?
The market segments include End-User.
4. Can you provide details about the market size?
The market size is estimated to be USD 4.52 Billion as of 2022.
5. What are some drivers contributing to market growth?
4.; Growing Energy Demand4.; Renewable Energy Transition.
6. What are the notable trends driving market growth?
Commercial and Industrial Segment to Witness Significant Growth.
7. Are there any restraints impacting market growth?
4.; Phasing out of Conventional Sources of Electricity.
8. Can you provide examples of recent developments in the market?
New product launches: Major players are introducing innovative products with advanced features and functionality.
9. What pricing options are available for accessing the report?
Pricing options include single-user, multi-user, and enterprise licenses priced at USD 4750, USD 5250, and USD 8750 respectively.
10. Is the market size provided in terms of value or volume?
The market size is provided in terms of value, measured in Billion.
11. Are there any specific market keywords associated with the report?
Yes, the market keyword associated with the report is "Power Monitoring System Market," which aids in identifying and referencing the specific market segment covered.
12. How do I determine which pricing option suits my needs best?
The pricing options vary based on user requirements and access needs. Individual users may opt for single-user licenses, while businesses requiring broader access may choose multi-user or enterprise licenses for cost-effective access to the report.
13. Are there any additional resources or data provided in the Power Monitoring System Market report?
While the report offers comprehensive insights, it's advisable to review the specific contents or supplementary materials provided to ascertain if additional resources or data are available.
14. How can I stay updated on further developments or reports in the Power Monitoring System Market?
To stay informed about further developments, trends, and reports in the Power Monitoring System Market, consider subscribing to industry newsletters, following relevant companies and organizations, or regularly checking reputable industry news sources and publications.
Methodology
Step 1 - Identification of Relevant Samples Size from Population Database


Step 2 - Approaches for Defining Global Market Size (Value, Volume* & Price*)

Note*: In applicable scenarios
Step 3 - Data Sources
Primary Research
- Web Analytics
- Survey Reports
- Research Institute
- Latest Research Reports
- Opinion Leaders
Secondary Research
- Annual Reports
- White Paper
- Latest Press Release
- Industry Association
- Paid Database
- Investor Presentations

Step 4 - Data Triangulation
Involves using different sources of information in order to increase the validity of a study
These sources are likely to be stakeholders in a program - participants, other researchers, program staff, other community members, and so on.
Then we put all data in single framework & apply various statistical tools to find out the dynamic on the market.
During the analysis stage, feedback from the stakeholder groups would be compared to determine areas of agreement as well as areas of divergence


