
Key Insights
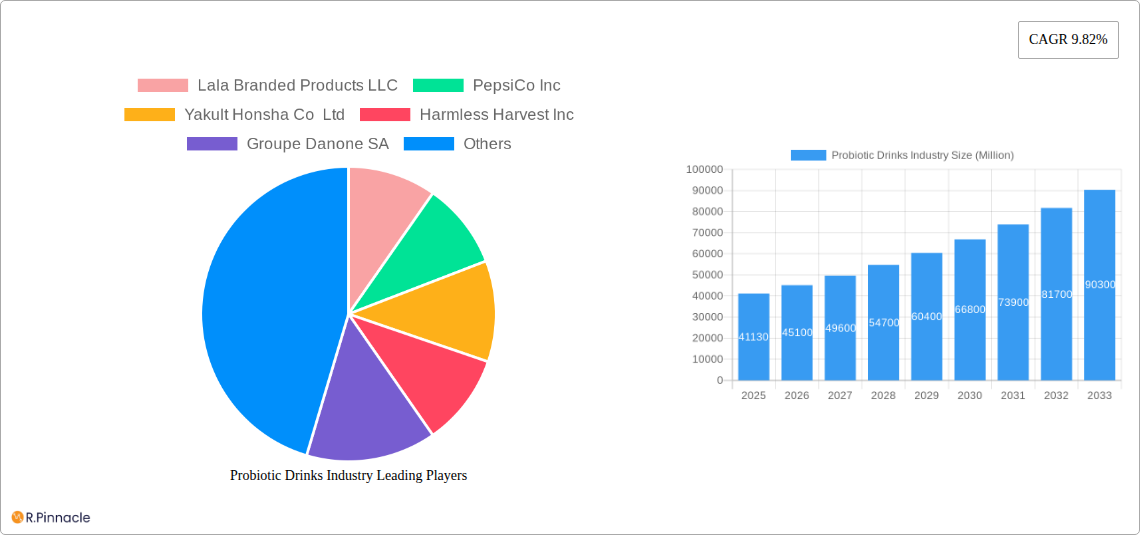
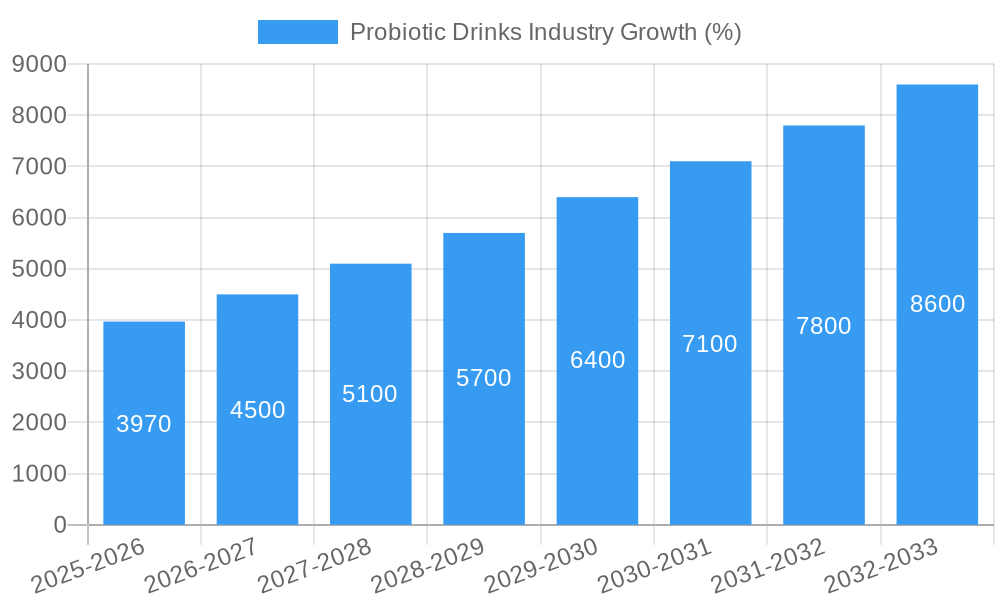
The global probiotic drinks market, valued at $41.13 billion in 2025, is projected to experience robust growth, driven by a CAGR of 9.82% from 2025 to 2033. This expansion is fueled by several key factors. Increasing consumer awareness of gut health and the associated benefits of probiotics is a primary driver. The rising prevalence of digestive disorders and the growing demand for natural and functional beverages further contribute to market growth. Product innovation, encompassing diverse flavors, convenient packaging formats (like single-serve bottles and ready-to-drink options), and the incorporation of added ingredients like fruits, vegetables, and other functional components, are also significantly impacting market expansion. The expanding distribution channels, including supermarkets, convenience stores, and online retailers, enhance accessibility and contribute to market penetration. Furthermore, the strategic marketing initiatives and product launches by key players like Danone, PepsiCo, and Yakult are shaping market dynamics. Yogurt drinks and fermented milk drinks currently hold significant market share within the product type segment, reflecting established consumer preferences.
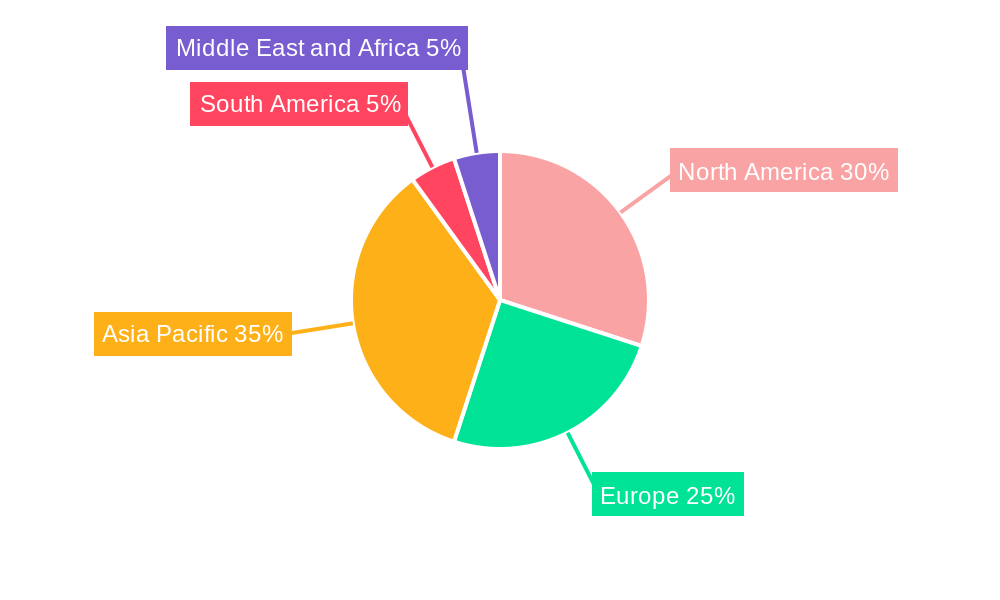
However, certain factors could potentially restrain market growth. Price sensitivity amongst consumers, especially in developing economies, might limit market penetration for premium probiotic drinks. Concerns about the efficacy and safety of certain probiotic strains, along with potential side effects in some individuals, could also create challenges. Fluctuations in raw material costs and supply chain disruptions could impact profitability. Nevertheless, the overall market outlook remains positive, with ongoing research and development efforts, and the increasing demand for health and wellness products expected to fuel continued expansion in the coming years. The Asia-Pacific region, driven by the growing health-conscious population and increased disposable incomes, is poised to witness substantial growth.
This comprehensive report provides an in-depth analysis of the global probiotic drinks industry, offering valuable insights for industry professionals, investors, and stakeholders. With a study period spanning 2019-2033, a base year of 2025, and a forecast period of 2025-2033, this report unveils the market's current state and future trajectory. The report uses data from the historical period of 2019-2024 and estimated values for 2025 to generate comprehensive forecasts. The market size is estimated to reach xx Million by 2025 and xx Million by 2033.
Probiotic Drinks Industry Market Structure & Innovation Trends
The probiotic drinks market is characterized by a mix of large multinational corporations and smaller specialized players. Market concentration is moderate, with key players like PepsiCo Inc, Groupe Danone SA, and Yakult Honsha Co Ltd holding significant market share, estimated at xx%, xx%, and xx% respectively in 2025. However, smaller niche brands are also gaining traction through innovative product offerings and targeted marketing. Innovation is driven by the increasing consumer demand for healthier beverages, functional foods, and personalized nutrition. Regulatory frameworks concerning food safety and labeling significantly influence market dynamics. Product substitutes, such as traditional juices and soft drinks, pose a competitive challenge. The end-user demographic is expanding, encompassing health-conscious individuals, athletes, and aging populations.
M&A activity has been relatively modest in recent years, with deal values totaling approximately xx Million in the past five years. Notable examples include smaller acquisitions focused on expanding product portfolios and geographic reach.
Probiotic Drinks Industry Market Dynamics & Trends
The global probiotic drinks market is experiencing robust growth, driven by several key factors. The rising awareness of gut health and its impact on overall well-being is a primary driver, fueling consumer demand for functional beverages. Technological advancements in probiotic strain development and preservation methods are enhancing product quality and shelf life, further boosting market expansion. Changing consumer preferences toward natural, healthier alternatives to sugary drinks are also contributing to the market's growth. The market is witnessing a shift towards on-the-go consumption formats, driving innovation in packaging and product offerings.
The market's Compound Annual Growth Rate (CAGR) during the forecast period (2025-2033) is estimated to be xx%, indicating a significant expansion. Market penetration is increasing steadily, particularly in developed economies, with the continued growth expected in emerging markets. Competitive dynamics are shaped by intense innovation, branding strategies, and distribution network expansion.
Dominant Regions & Segments in Probiotic Drinks Industry
The North American region currently dominates the probiotic drinks market, followed by Europe and Asia-Pacific. This dominance is attributed to factors such as higher consumer awareness of health benefits, strong regulatory frameworks, and established distribution channels.
- Key Drivers for North America: High disposable income, robust healthcare infrastructure, increasing health consciousness.
- Key Drivers for Europe: Growing awareness of gut health and functional foods, increasing demand for natural and organic products.
- Key Drivers for Asia-Pacific: Rising middle class, increasing urbanization, growing health awareness.
Dominant Product Type: Yogurt drinks currently hold the largest market share within the product type segment, followed by fermented milk drinks. This is driven by their established market presence and consumer familiarity.
Dominant Distribution Channel: Supermarkets/Hypermarkets represent the leading distribution channel, offering wide product visibility and accessibility to consumers.
Probiotic Drinks Industry Product Innovations
Recent innovations in the probiotic drinks market include the development of novel probiotic strains with enhanced efficacy, improved taste profiles, and convenient packaging formats. Technological advancements such as high-pressure processing and microencapsulation are enhancing product stability and extending shelf life. The market is seeing a surge in plant-based probiotic drinks, catering to growing vegan and vegetarian consumer segments, further enhancing market fit and appealing to a broader consumer base.
Report Scope & Segmentation Analysis
This report segments the probiotic drinks market based on product type (Yogurt Drinks, Fermented Milk Drinks, Kombucha, Kefir, Probiotics Juices, Other Product Types) and distribution channel (Supermarkets/Hypermarkets, Convenience Stores, Pharmacies/Health Stores, Other Distribution Channels). Each segment's growth projection, market size, and competitive dynamics are analyzed extensively within the full report. The detailed analysis of these segments provides a comprehensive understanding of the market's structure and evolution. For example, the Yogurt Drinks segment is projected to grow at a CAGR of xx% during the forecast period due to its established consumer base and ongoing innovation.
Key Drivers of Probiotic Drinks Industry Growth
Several factors are driving the growth of the probiotic drinks industry. These include the increasing awareness of gut health and its connection to overall wellness, the growing demand for functional foods and beverages, and technological advancements in probiotic cultivation and preservation. Furthermore, favorable regulatory frameworks and supportive government initiatives are facilitating market expansion. The rise in health and wellness trends, coupled with increased disposable income, is further boosting the consumption of probiotic drinks.
Challenges in the Probiotic Drinks Industry Sector
The probiotic drinks industry faces several challenges, including maintaining the stability and viability of live probiotic cultures, ensuring product quality and safety, and managing supply chain complexities. Stringent regulatory requirements for food and beverage products can add to production costs and complexity. Furthermore, intense competition from established beverage companies and the emergence of new players necessitate continuous innovation and differentiation. Maintaining consistent quality and consumer trust while managing supply chain disruptions poses further challenges.
Emerging Opportunities in Probiotic Drinks Industry
The probiotic drinks market presents numerous opportunities, including the expansion into emerging markets with rising health consciousness. The development of novel probiotic strains with targeted health benefits and personalized nutrition solutions offers significant potential. Growing consumer interest in sustainability and eco-friendly packaging provides opportunities for innovation in this area. Strategic partnerships and collaborations with healthcare professionals and wellness brands can further enhance market penetration and credibility.
Leading Players in the Probiotic Drinks Industry Market
- Lala Branded Products LLC
- PepsiCo Inc
- Yakult Honsha Co Ltd
- Harmless Harvest Inc
- Groupe Danone SA
- Lifeway Foods Inc
- Kerry Group PLC (Bio-K Plus International Inc)
- Obi Probiotic Soda
- Fonterra Co-op Group Ltd
- Groupe Lactalis
Key Developments in Probiotic Drinks Industry
- July 2021: PepsiCo launched KeVita Prebiotic Shots, expanding its presence in the functional beverage market.
- May 2022: Fonterra launched Nurture cultured milk in Singapore, targeting the health-conscious consumer segment.
- June 2022: Danone launched Activa+, a multi-benefit drinkable yogurt, further enhancing its market position.
Future Outlook for Probiotic Drinks Industry Market
The future outlook for the probiotic drinks industry is positive, driven by the ongoing growth in health consciousness and the increasing demand for functional beverages. The continuous innovation in probiotic strains, product formulations, and packaging will be key to sustaining market growth. Expanding into new geographical markets and catering to diverse consumer preferences will also be crucial. The market's expansion is projected to continue, propelled by the rising awareness of gut health and technological advancements within the sector.
Probiotic Drinks Industry Segmentation
-
1. Product Type
- 1.1. Yogurt Drinks
- 1.2. Fermented Milk Drinks
- 1.3. Kombucha
- 1.4. Kefir
- 1.5. Probiotics Juices
- 1.6. Other Product Types
-
2. Distribution Channel
- 2.1. Supermarkets/Hypermarkets
- 2.2. Convenience Stores
- 2.3. Pharmacies/Health Stores
- 2.4. Other Distribution Channels
Probiotic Drinks Industry Segmentation By Geography
-
1. North America
- 1.1. United States
- 1.2. Canada
- 1.3. Mexico
- 1.4. Rest of North America
-
2. Europe
- 2.1. United Kingdom
- 2.2. France
- 2.3. Germany
- 2.4. Italy
- 2.5. Spain
- 2.6. Russia
- 2.7. Rest of Europe
-
3. Asia Pacific
- 3.1. China
- 3.2. Japan
- 3.3. Australia
- 3.4. India
- 3.5. Rest of Asia Pacific
-
4. South America
- 4.1. Brazil
- 4.2. Argentina
- 4.3. Rest of South America
-
5. Middle East and Africa
- 5.1. South Africa
- 5.2. United Arab Emirates
- 5.3. Rest of Middle East and Africa
Probiotic Drinks Industry REPORT HIGHLIGHTS
| Aspects | Details |
|---|---|
| Study Period | 2019-2033 |
| Base Year | 2024 |
| Estimated Year | 2025 |
| Forecast Period | 2025-2033 |
| Historical Period | 2019-2024 |
| Growth Rate | CAGR of 9.82% from 2019-2033 |
| Segmentation |
|
Table of Contents
- 1. Introduction
- 1.1. Research Scope
- 1.2. Market Segmentation
- 1.3. Research Methodology
- 1.4. Definitions and Assumptions
- 2. Executive Summary
- 2.1. Introduction
- 3. Market Dynamics
- 3.1. Introduction
- 3.2. Market Drivers
- 3.2.1. Increasing Demand for Protein Rich Food and Supplements; Increasing Application of Collagen in Personal Care Products
- 3.3. Market Restrains
- 3.3.1. Increasing Demand for Plant-Based Protein
- 3.4. Market Trends
- 3.4.1. Growing Demand for Functional Beverages
- 4. Market Factor Analysis
- 4.1. Porters Five Forces
- 4.2. Supply/Value Chain
- 4.3. PESTEL analysis
- 4.4. Market Entropy
- 4.5. Patent/Trademark Analysis
- 5. Global Probiotic Drinks Industry Analysis, Insights and Forecast, 2019-2031
- 5.1. Market Analysis, Insights and Forecast - by Product Type
- 5.1.1. Yogurt Drinks
- 5.1.2. Fermented Milk Drinks
- 5.1.3. Kombucha
- 5.1.4. Kefir
- 5.1.5. Probiotics Juices
- 5.1.6. Other Product Types
- 5.2. Market Analysis, Insights and Forecast - by Distribution Channel
- 5.2.1. Supermarkets/Hypermarkets
- 5.2.2. Convenience Stores
- 5.2.3. Pharmacies/Health Stores
- 5.2.4. Other Distribution Channels
- 5.3. Market Analysis, Insights and Forecast - by Region
- 5.3.1. North America
- 5.3.2. Europe
- 5.3.3. Asia Pacific
- 5.3.4. South America
- 5.3.5. Middle East and Africa
- 5.1. Market Analysis, Insights and Forecast - by Product Type
- 6. North America Probiotic Drinks Industry Analysis, Insights and Forecast, 2019-2031
- 6.1. Market Analysis, Insights and Forecast - by Product Type
- 6.1.1. Yogurt Drinks
- 6.1.2. Fermented Milk Drinks
- 6.1.3. Kombucha
- 6.1.4. Kefir
- 6.1.5. Probiotics Juices
- 6.1.6. Other Product Types
- 6.2. Market Analysis, Insights and Forecast - by Distribution Channel
- 6.2.1. Supermarkets/Hypermarkets
- 6.2.2. Convenience Stores
- 6.2.3. Pharmacies/Health Stores
- 6.2.4. Other Distribution Channels
- 6.1. Market Analysis, Insights and Forecast - by Product Type
- 7. Europe Probiotic Drinks Industry Analysis, Insights and Forecast, 2019-2031
- 7.1. Market Analysis, Insights and Forecast - by Product Type
- 7.1.1. Yogurt Drinks
- 7.1.2. Fermented Milk Drinks
- 7.1.3. Kombucha
- 7.1.4. Kefir
- 7.1.5. Probiotics Juices
- 7.1.6. Other Product Types
- 7.2. Market Analysis, Insights and Forecast - by Distribution Channel
- 7.2.1. Supermarkets/Hypermarkets
- 7.2.2. Convenience Stores
- 7.2.3. Pharmacies/Health Stores
- 7.2.4. Other Distribution Channels
- 7.1. Market Analysis, Insights and Forecast - by Product Type
- 8. Asia Pacific Probiotic Drinks Industry Analysis, Insights and Forecast, 2019-2031
- 8.1. Market Analysis, Insights and Forecast - by Product Type
- 8.1.1. Yogurt Drinks
- 8.1.2. Fermented Milk Drinks
- 8.1.3. Kombucha
- 8.1.4. Kefir
- 8.1.5. Probiotics Juices
- 8.1.6. Other Product Types
- 8.2. Market Analysis, Insights and Forecast - by Distribution Channel
- 8.2.1. Supermarkets/Hypermarkets
- 8.2.2. Convenience Stores
- 8.2.3. Pharmacies/Health Stores
- 8.2.4. Other Distribution Channels
- 8.1. Market Analysis, Insights and Forecast - by Product Type
- 9. South America Probiotic Drinks Industry Analysis, Insights and Forecast, 2019-2031
- 9.1. Market Analysis, Insights and Forecast - by Product Type
- 9.1.1. Yogurt Drinks
- 9.1.2. Fermented Milk Drinks
- 9.1.3. Kombucha
- 9.1.4. Kefir
- 9.1.5. Probiotics Juices
- 9.1.6. Other Product Types
- 9.2. Market Analysis, Insights and Forecast - by Distribution Channel
- 9.2.1. Supermarkets/Hypermarkets
- 9.2.2. Convenience Stores
- 9.2.3. Pharmacies/Health Stores
- 9.2.4. Other Distribution Channels
- 9.1. Market Analysis, Insights and Forecast - by Product Type
- 10. Middle East and Africa Probiotic Drinks Industry Analysis, Insights and Forecast, 2019-2031
- 10.1. Market Analysis, Insights and Forecast - by Product Type
- 10.1.1. Yogurt Drinks
- 10.1.2. Fermented Milk Drinks
- 10.1.3. Kombucha
- 10.1.4. Kefir
- 10.1.5. Probiotics Juices
- 10.1.6. Other Product Types
- 10.2. Market Analysis, Insights and Forecast - by Distribution Channel
- 10.2.1. Supermarkets/Hypermarkets
- 10.2.2. Convenience Stores
- 10.2.3. Pharmacies/Health Stores
- 10.2.4. Other Distribution Channels
- 10.1. Market Analysis, Insights and Forecast - by Product Type
- 11. North America Probiotic Drinks Industry Analysis, Insights and Forecast, 2019-2031
- 11.1. Market Analysis, Insights and Forecast - By Country/Sub-region
- 11.1.1 United States
- 11.1.2 Canada
- 11.1.3 Mexico
- 11.1.4 Rest of North America
- 12. Europe Probiotic Drinks Industry Analysis, Insights and Forecast, 2019-2031
- 12.1. Market Analysis, Insights and Forecast - By Country/Sub-region
- 12.1.1 United Kingdom
- 12.1.2 France
- 12.1.3 Germany
- 12.1.4 Italy
- 12.1.5 Spain
- 12.1.6 Russia
- 12.1.7 Rest of Europe
- 13. Asia Pacific Probiotic Drinks Industry Analysis, Insights and Forecast, 2019-2031
- 13.1. Market Analysis, Insights and Forecast - By Country/Sub-region
- 13.1.1 China
- 13.1.2 Japan
- 13.1.3 Australia
- 13.1.4 India
- 13.1.5 Rest of Asia Pacific
- 14. South America Probiotic Drinks Industry Analysis, Insights and Forecast, 2019-2031
- 14.1. Market Analysis, Insights and Forecast - By Country/Sub-region
- 14.1.1 Brazil
- 14.1.2 Argentina
- 14.1.3 Rest of South America
- 15. Middle East and Africa Probiotic Drinks Industry Analysis, Insights and Forecast, 2019-2031
- 15.1. Market Analysis, Insights and Forecast - By Country/Sub-region
- 15.1.1 South Africa
- 15.1.2 United Arab Emirates
- 15.1.3 Rest of Middle East and Africa
- 16. Competitive Analysis
- 16.1. Global Market Share Analysis 2024
- 16.2. Company Profiles
- 16.2.1 Lala Branded Products LLC
- 16.2.1.1. Overview
- 16.2.1.2. Products
- 16.2.1.3. SWOT Analysis
- 16.2.1.4. Recent Developments
- 16.2.1.5. Financials (Based on Availability)
- 16.2.2 PepsiCo Inc
- 16.2.2.1. Overview
- 16.2.2.2. Products
- 16.2.2.3. SWOT Analysis
- 16.2.2.4. Recent Developments
- 16.2.2.5. Financials (Based on Availability)
- 16.2.3 Yakult Honsha Co Ltd
- 16.2.3.1. Overview
- 16.2.3.2. Products
- 16.2.3.3. SWOT Analysis
- 16.2.3.4. Recent Developments
- 16.2.3.5. Financials (Based on Availability)
- 16.2.4 Harmless Harvest Inc
- 16.2.4.1. Overview
- 16.2.4.2. Products
- 16.2.4.3. SWOT Analysis
- 16.2.4.4. Recent Developments
- 16.2.4.5. Financials (Based on Availability)
- 16.2.5 Groupe Danone SA
- 16.2.5.1. Overview
- 16.2.5.2. Products
- 16.2.5.3. SWOT Analysis
- 16.2.5.4. Recent Developments
- 16.2.5.5. Financials (Based on Availability)
- 16.2.6 Lifeway Foods Inc
- 16.2.6.1. Overview
- 16.2.6.2. Products
- 16.2.6.3. SWOT Analysis
- 16.2.6.4. Recent Developments
- 16.2.6.5. Financials (Based on Availability)
- 16.2.7 Kerry Group PLC (Bio-K Plus International Inc )
- 16.2.7.1. Overview
- 16.2.7.2. Products
- 16.2.7.3. SWOT Analysis
- 16.2.7.4. Recent Developments
- 16.2.7.5. Financials (Based on Availability)
- 16.2.8 Obi Probiotic Soda*List Not Exhaustive
- 16.2.8.1. Overview
- 16.2.8.2. Products
- 16.2.8.3. SWOT Analysis
- 16.2.8.4. Recent Developments
- 16.2.8.5. Financials (Based on Availability)
- 16.2.9 Fonterra Co-op Group Ltd
- 16.2.9.1. Overview
- 16.2.9.2. Products
- 16.2.9.3. SWOT Analysis
- 16.2.9.4. Recent Developments
- 16.2.9.5. Financials (Based on Availability)
- 16.2.10 Groupe Lactalis
- 16.2.10.1. Overview
- 16.2.10.2. Products
- 16.2.10.3. SWOT Analysis
- 16.2.10.4. Recent Developments
- 16.2.10.5. Financials (Based on Availability)
- 16.2.1 Lala Branded Products LLC
List of Figures
- Figure 1: Global Probiotic Drinks Industry Revenue Breakdown (Million, %) by Region 2024 & 2032
- Figure 2: Global Probiotic Drinks Industry Volume Breakdown (K Units, %) by Region 2024 & 2032
- Figure 3: North America Probiotic Drinks Industry Revenue (Million), by Country 2024 & 2032
- Figure 4: North America Probiotic Drinks Industry Volume (K Units), by Country 2024 & 2032
- Figure 5: North America Probiotic Drinks Industry Revenue Share (%), by Country 2024 & 2032
- Figure 6: North America Probiotic Drinks Industry Volume Share (%), by Country 2024 & 2032
- Figure 7: Europe Probiotic Drinks Industry Revenue (Million), by Country 2024 & 2032
- Figure 8: Europe Probiotic Drinks Industry Volume (K Units), by Country 2024 & 2032
- Figure 9: Europe Probiotic Drinks Industry Revenue Share (%), by Country 2024 & 2032
- Figure 10: Europe Probiotic Drinks Industry Volume Share (%), by Country 2024 & 2032
- Figure 11: Asia Pacific Probiotic Drinks Industry Revenue (Million), by Country 2024 & 2032
- Figure 12: Asia Pacific Probiotic Drinks Industry Volume (K Units), by Country 2024 & 2032
- Figure 13: Asia Pacific Probiotic Drinks Industry Revenue Share (%), by Country 2024 & 2032
- Figure 14: Asia Pacific Probiotic Drinks Industry Volume Share (%), by Country 2024 & 2032
- Figure 15: South America Probiotic Drinks Industry Revenue (Million), by Country 2024 & 2032
- Figure 16: South America Probiotic Drinks Industry Volume (K Units), by Country 2024 & 2032
- Figure 17: South America Probiotic Drinks Industry Revenue Share (%), by Country 2024 & 2032
- Figure 18: South America Probiotic Drinks Industry Volume Share (%), by Country 2024 & 2032
- Figure 19: Middle East and Africa Probiotic Drinks Industry Revenue (Million), by Country 2024 & 2032
- Figure 20: Middle East and Africa Probiotic Drinks Industry Volume (K Units), by Country 2024 & 2032
- Figure 21: Middle East and Africa Probiotic Drinks Industry Revenue Share (%), by Country 2024 & 2032
- Figure 22: Middle East and Africa Probiotic Drinks Industry Volume Share (%), by Country 2024 & 2032
- Figure 23: North America Probiotic Drinks Industry Revenue (Million), by Product Type 2024 & 2032
- Figure 24: North America Probiotic Drinks Industry Volume (K Units), by Product Type 2024 & 2032
- Figure 25: North America Probiotic Drinks Industry Revenue Share (%), by Product Type 2024 & 2032
- Figure 26: North America Probiotic Drinks Industry Volume Share (%), by Product Type 2024 & 2032
- Figure 27: North America Probiotic Drinks Industry Revenue (Million), by Distribution Channel 2024 & 2032
- Figure 28: North America Probiotic Drinks Industry Volume (K Units), by Distribution Channel 2024 & 2032
- Figure 29: North America Probiotic Drinks Industry Revenue Share (%), by Distribution Channel 2024 & 2032
- Figure 30: North America Probiotic Drinks Industry Volume Share (%), by Distribution Channel 2024 & 2032
- Figure 31: North America Probiotic Drinks Industry Revenue (Million), by Country 2024 & 2032
- Figure 32: North America Probiotic Drinks Industry Volume (K Units), by Country 2024 & 2032
- Figure 33: North America Probiotic Drinks Industry Revenue Share (%), by Country 2024 & 2032
- Figure 34: North America Probiotic Drinks Industry Volume Share (%), by Country 2024 & 2032
- Figure 35: Europe Probiotic Drinks Industry Revenue (Million), by Product Type 2024 & 2032
- Figure 36: Europe Probiotic Drinks Industry Volume (K Units), by Product Type 2024 & 2032
- Figure 37: Europe Probiotic Drinks Industry Revenue Share (%), by Product Type 2024 & 2032
- Figure 38: Europe Probiotic Drinks Industry Volume Share (%), by Product Type 2024 & 2032
- Figure 39: Europe Probiotic Drinks Industry Revenue (Million), by Distribution Channel 2024 & 2032
- Figure 40: Europe Probiotic Drinks Industry Volume (K Units), by Distribution Channel 2024 & 2032
- Figure 41: Europe Probiotic Drinks Industry Revenue Share (%), by Distribution Channel 2024 & 2032
- Figure 42: Europe Probiotic Drinks Industry Volume Share (%), by Distribution Channel 2024 & 2032
- Figure 43: Europe Probiotic Drinks Industry Revenue (Million), by Country 2024 & 2032
- Figure 44: Europe Probiotic Drinks Industry Volume (K Units), by Country 2024 & 2032
- Figure 45: Europe Probiotic Drinks Industry Revenue Share (%), by Country 2024 & 2032
- Figure 46: Europe Probiotic Drinks Industry Volume Share (%), by Country 2024 & 2032
- Figure 47: Asia Pacific Probiotic Drinks Industry Revenue (Million), by Product Type 2024 & 2032
- Figure 48: Asia Pacific Probiotic Drinks Industry Volume (K Units), by Product Type 2024 & 2032
- Figure 49: Asia Pacific Probiotic Drinks Industry Revenue Share (%), by Product Type 2024 & 2032
- Figure 50: Asia Pacific Probiotic Drinks Industry Volume Share (%), by Product Type 2024 & 2032
- Figure 51: Asia Pacific Probiotic Drinks Industry Revenue (Million), by Distribution Channel 2024 & 2032
- Figure 52: Asia Pacific Probiotic Drinks Industry Volume (K Units), by Distribution Channel 2024 & 2032
- Figure 53: Asia Pacific Probiotic Drinks Industry Revenue Share (%), by Distribution Channel 2024 & 2032
- Figure 54: Asia Pacific Probiotic Drinks Industry Volume Share (%), by Distribution Channel 2024 & 2032
- Figure 55: Asia Pacific Probiotic Drinks Industry Revenue (Million), by Country 2024 & 2032
- Figure 56: Asia Pacific Probiotic Drinks Industry Volume (K Units), by Country 2024 & 2032
- Figure 57: Asia Pacific Probiotic Drinks Industry Revenue Share (%), by Country 2024 & 2032
- Figure 58: Asia Pacific Probiotic Drinks Industry Volume Share (%), by Country 2024 & 2032
- Figure 59: South America Probiotic Drinks Industry Revenue (Million), by Product Type 2024 & 2032
- Figure 60: South America Probiotic Drinks Industry Volume (K Units), by Product Type 2024 & 2032
- Figure 61: South America Probiotic Drinks Industry Revenue Share (%), by Product Type 2024 & 2032
- Figure 62: South America Probiotic Drinks Industry Volume Share (%), by Product Type 2024 & 2032
- Figure 63: South America Probiotic Drinks Industry Revenue (Million), by Distribution Channel 2024 & 2032
- Figure 64: South America Probiotic Drinks Industry Volume (K Units), by Distribution Channel 2024 & 2032
- Figure 65: South America Probiotic Drinks Industry Revenue Share (%), by Distribution Channel 2024 & 2032
- Figure 66: South America Probiotic Drinks Industry Volume Share (%), by Distribution Channel 2024 & 2032
- Figure 67: South America Probiotic Drinks Industry Revenue (Million), by Country 2024 & 2032
- Figure 68: South America Probiotic Drinks Industry Volume (K Units), by Country 2024 & 2032
- Figure 69: South America Probiotic Drinks Industry Revenue Share (%), by Country 2024 & 2032
- Figure 70: South America Probiotic Drinks Industry Volume Share (%), by Country 2024 & 2032
- Figure 71: Middle East and Africa Probiotic Drinks Industry Revenue (Million), by Product Type 2024 & 2032
- Figure 72: Middle East and Africa Probiotic Drinks Industry Volume (K Units), by Product Type 2024 & 2032
- Figure 73: Middle East and Africa Probiotic Drinks Industry Revenue Share (%), by Product Type 2024 & 2032
- Figure 74: Middle East and Africa Probiotic Drinks Industry Volume Share (%), by Product Type 2024 & 2032
- Figure 75: Middle East and Africa Probiotic Drinks Industry Revenue (Million), by Distribution Channel 2024 & 2032
- Figure 76: Middle East and Africa Probiotic Drinks Industry Volume (K Units), by Distribution Channel 2024 & 2032
- Figure 77: Middle East and Africa Probiotic Drinks Industry Revenue Share (%), by Distribution Channel 2024 & 2032
- Figure 78: Middle East and Africa Probiotic Drinks Industry Volume Share (%), by Distribution Channel 2024 & 2032
- Figure 79: Middle East and Africa Probiotic Drinks Industry Revenue (Million), by Country 2024 & 2032
- Figure 80: Middle East and Africa Probiotic Drinks Industry Volume (K Units), by Country 2024 & 2032
- Figure 81: Middle East and Africa Probiotic Drinks Industry Revenue Share (%), by Country 2024 & 2032
- Figure 82: Middle East and Africa Probiotic Drinks Industry Volume Share (%), by Country 2024 & 2032
List of Tables
- Table 1: Global Probiotic Drinks Industry Revenue Million Forecast, by Region 2019 & 2032
- Table 2: Global Probiotic Drinks Industry Volume K Units Forecast, by Region 2019 & 2032
- Table 3: Global Probiotic Drinks Industry Revenue Million Forecast, by Product Type 2019 & 2032
- Table 4: Global Probiotic Drinks Industry Volume K Units Forecast, by Product Type 2019 & 2032
- Table 5: Global Probiotic Drinks Industry Revenue Million Forecast, by Distribution Channel 2019 & 2032
- Table 6: Global Probiotic Drinks Industry Volume K Units Forecast, by Distribution Channel 2019 & 2032
- Table 7: Global Probiotic Drinks Industry Revenue Million Forecast, by Region 2019 & 2032
- Table 8: Global Probiotic Drinks Industry Volume K Units Forecast, by Region 2019 & 2032
- Table 9: Global Probiotic Drinks Industry Revenue Million Forecast, by Country 2019 & 2032
- Table 10: Global Probiotic Drinks Industry Volume K Units Forecast, by Country 2019 & 2032
- Table 11: United States Probiotic Drinks Industry Revenue (Million) Forecast, by Application 2019 & 2032
- Table 12: United States Probiotic Drinks Industry Volume (K Units) Forecast, by Application 2019 & 2032
- Table 13: Canada Probiotic Drinks Industry Revenue (Million) Forecast, by Application 2019 & 2032
- Table 14: Canada Probiotic Drinks Industry Volume (K Units) Forecast, by Application 2019 & 2032
- Table 15: Mexico Probiotic Drinks Industry Revenue (Million) Forecast, by Application 2019 & 2032
- Table 16: Mexico Probiotic Drinks Industry Volume (K Units) Forecast, by Application 2019 & 2032
- Table 17: Rest of North America Probiotic Drinks Industry Revenue (Million) Forecast, by Application 2019 & 2032
- Table 18: Rest of North America Probiotic Drinks Industry Volume (K Units) Forecast, by Application 2019 & 2032
- Table 19: Global Probiotic Drinks Industry Revenue Million Forecast, by Country 2019 & 2032
- Table 20: Global Probiotic Drinks Industry Volume K Units Forecast, by Country 2019 & 2032
- Table 21: United Kingdom Probiotic Drinks Industry Revenue (Million) Forecast, by Application 2019 & 2032
- Table 22: United Kingdom Probiotic Drinks Industry Volume (K Units) Forecast, by Application 2019 & 2032
- Table 23: France Probiotic Drinks Industry Revenue (Million) Forecast, by Application 2019 & 2032
- Table 24: France Probiotic Drinks Industry Volume (K Units) Forecast, by Application 2019 & 2032
- Table 25: Germany Probiotic Drinks Industry Revenue (Million) Forecast, by Application 2019 & 2032
- Table 26: Germany Probiotic Drinks Industry Volume (K Units) Forecast, by Application 2019 & 2032
- Table 27: Italy Probiotic Drinks Industry Revenue (Million) Forecast, by Application 2019 & 2032
- Table 28: Italy Probiotic Drinks Industry Volume (K Units) Forecast, by Application 2019 & 2032
- Table 29: Spain Probiotic Drinks Industry Revenue (Million) Forecast, by Application 2019 & 2032
- Table 30: Spain Probiotic Drinks Industry Volume (K Units) Forecast, by Application 2019 & 2032
- Table 31: Russia Probiotic Drinks Industry Revenue (Million) Forecast, by Application 2019 & 2032
- Table 32: Russia Probiotic Drinks Industry Volume (K Units) Forecast, by Application 2019 & 2032
- Table 33: Rest of Europe Probiotic Drinks Industry Revenue (Million) Forecast, by Application 2019 & 2032
- Table 34: Rest of Europe Probiotic Drinks Industry Volume (K Units) Forecast, by Application 2019 & 2032
- Table 35: Global Probiotic Drinks Industry Revenue Million Forecast, by Country 2019 & 2032
- Table 36: Global Probiotic Drinks Industry Volume K Units Forecast, by Country 2019 & 2032
- Table 37: China Probiotic Drinks Industry Revenue (Million) Forecast, by Application 2019 & 2032
- Table 38: China Probiotic Drinks Industry Volume (K Units) Forecast, by Application 2019 & 2032
- Table 39: Japan Probiotic Drinks Industry Revenue (Million) Forecast, by Application 2019 & 2032
- Table 40: Japan Probiotic Drinks Industry Volume (K Units) Forecast, by Application 2019 & 2032
- Table 41: Australia Probiotic Drinks Industry Revenue (Million) Forecast, by Application 2019 & 2032
- Table 42: Australia Probiotic Drinks Industry Volume (K Units) Forecast, by Application 2019 & 2032
- Table 43: India Probiotic Drinks Industry Revenue (Million) Forecast, by Application 2019 & 2032
- Table 44: India Probiotic Drinks Industry Volume (K Units) Forecast, by Application 2019 & 2032
- Table 45: Rest of Asia Pacific Probiotic Drinks Industry Revenue (Million) Forecast, by Application 2019 & 2032
- Table 46: Rest of Asia Pacific Probiotic Drinks Industry Volume (K Units) Forecast, by Application 2019 & 2032
- Table 47: Global Probiotic Drinks Industry Revenue Million Forecast, by Country 2019 & 2032
- Table 48: Global Probiotic Drinks Industry Volume K Units Forecast, by Country 2019 & 2032
- Table 49: Brazil Probiotic Drinks Industry Revenue (Million) Forecast, by Application 2019 & 2032
- Table 50: Brazil Probiotic Drinks Industry Volume (K Units) Forecast, by Application 2019 & 2032
- Table 51: Argentina Probiotic Drinks Industry Revenue (Million) Forecast, by Application 2019 & 2032
- Table 52: Argentina Probiotic Drinks Industry Volume (K Units) Forecast, by Application 2019 & 2032
- Table 53: Rest of South America Probiotic Drinks Industry Revenue (Million) Forecast, by Application 2019 & 2032
- Table 54: Rest of South America Probiotic Drinks Industry Volume (K Units) Forecast, by Application 2019 & 2032
- Table 55: Global Probiotic Drinks Industry Revenue Million Forecast, by Country 2019 & 2032
- Table 56: Global Probiotic Drinks Industry Volume K Units Forecast, by Country 2019 & 2032
- Table 57: South Africa Probiotic Drinks Industry Revenue (Million) Forecast, by Application 2019 & 2032
- Table 58: South Africa Probiotic Drinks Industry Volume (K Units) Forecast, by Application 2019 & 2032
- Table 59: United Arab Emirates Probiotic Drinks Industry Revenue (Million) Forecast, by Application 2019 & 2032
- Table 60: United Arab Emirates Probiotic Drinks Industry Volume (K Units) Forecast, by Application 2019 & 2032
- Table 61: Rest of Middle East and Africa Probiotic Drinks Industry Revenue (Million) Forecast, by Application 2019 & 2032
- Table 62: Rest of Middle East and Africa Probiotic Drinks Industry Volume (K Units) Forecast, by Application 2019 & 2032
- Table 63: Global Probiotic Drinks Industry Revenue Million Forecast, by Product Type 2019 & 2032
- Table 64: Global Probiotic Drinks Industry Volume K Units Forecast, by Product Type 2019 & 2032
- Table 65: Global Probiotic Drinks Industry Revenue Million Forecast, by Distribution Channel 2019 & 2032
- Table 66: Global Probiotic Drinks Industry Volume K Units Forecast, by Distribution Channel 2019 & 2032
- Table 67: Global Probiotic Drinks Industry Revenue Million Forecast, by Country 2019 & 2032
- Table 68: Global Probiotic Drinks Industry Volume K Units Forecast, by Country 2019 & 2032
- Table 69: United States Probiotic Drinks Industry Revenue (Million) Forecast, by Application 2019 & 2032
- Table 70: United States Probiotic Drinks Industry Volume (K Units) Forecast, by Application 2019 & 2032
- Table 71: Canada Probiotic Drinks Industry Revenue (Million) Forecast, by Application 2019 & 2032
- Table 72: Canada Probiotic Drinks Industry Volume (K Units) Forecast, by Application 2019 & 2032
- Table 73: Mexico Probiotic Drinks Industry Revenue (Million) Forecast, by Application 2019 & 2032
- Table 74: Mexico Probiotic Drinks Industry Volume (K Units) Forecast, by Application 2019 & 2032
- Table 75: Rest of North America Probiotic Drinks Industry Revenue (Million) Forecast, by Application 2019 & 2032
- Table 76: Rest of North America Probiotic Drinks Industry Volume (K Units) Forecast, by Application 2019 & 2032
- Table 77: Global Probiotic Drinks Industry Revenue Million Forecast, by Product Type 2019 & 2032
- Table 78: Global Probiotic Drinks Industry Volume K Units Forecast, by Product Type 2019 & 2032
- Table 79: Global Probiotic Drinks Industry Revenue Million Forecast, by Distribution Channel 2019 & 2032
- Table 80: Global Probiotic Drinks Industry Volume K Units Forecast, by Distribution Channel 2019 & 2032
- Table 81: Global Probiotic Drinks Industry Revenue Million Forecast, by Country 2019 & 2032
- Table 82: Global Probiotic Drinks Industry Volume K Units Forecast, by Country 2019 & 2032
- Table 83: United Kingdom Probiotic Drinks Industry Revenue (Million) Forecast, by Application 2019 & 2032
- Table 84: United Kingdom Probiotic Drinks Industry Volume (K Units) Forecast, by Application 2019 & 2032
- Table 85: France Probiotic Drinks Industry Revenue (Million) Forecast, by Application 2019 & 2032
- Table 86: France Probiotic Drinks Industry Volume (K Units) Forecast, by Application 2019 & 2032
- Table 87: Germany Probiotic Drinks Industry Revenue (Million) Forecast, by Application 2019 & 2032
- Table 88: Germany Probiotic Drinks Industry Volume (K Units) Forecast, by Application 2019 & 2032
- Table 89: Italy Probiotic Drinks Industry Revenue (Million) Forecast, by Application 2019 & 2032
- Table 90: Italy Probiotic Drinks Industry Volume (K Units) Forecast, by Application 2019 & 2032
- Table 91: Spain Probiotic Drinks Industry Revenue (Million) Forecast, by Application 2019 & 2032
- Table 92: Spain Probiotic Drinks Industry Volume (K Units) Forecast, by Application 2019 & 2032
- Table 93: Russia Probiotic Drinks Industry Revenue (Million) Forecast, by Application 2019 & 2032
- Table 94: Russia Probiotic Drinks Industry Volume (K Units) Forecast, by Application 2019 & 2032
- Table 95: Rest of Europe Probiotic Drinks Industry Revenue (Million) Forecast, by Application 2019 & 2032
- Table 96: Rest of Europe Probiotic Drinks Industry Volume (K Units) Forecast, by Application 2019 & 2032
- Table 97: Global Probiotic Drinks Industry Revenue Million Forecast, by Product Type 2019 & 2032
- Table 98: Global Probiotic Drinks Industry Volume K Units Forecast, by Product Type 2019 & 2032
- Table 99: Global Probiotic Drinks Industry Revenue Million Forecast, by Distribution Channel 2019 & 2032
- Table 100: Global Probiotic Drinks Industry Volume K Units Forecast, by Distribution Channel 2019 & 2032
- Table 101: Global Probiotic Drinks Industry Revenue Million Forecast, by Country 2019 & 2032
- Table 102: Global Probiotic Drinks Industry Volume K Units Forecast, by Country 2019 & 2032
- Table 103: China Probiotic Drinks Industry Revenue (Million) Forecast, by Application 2019 & 2032
- Table 104: China Probiotic Drinks Industry Volume (K Units) Forecast, by Application 2019 & 2032
- Table 105: Japan Probiotic Drinks Industry Revenue (Million) Forecast, by Application 2019 & 2032
- Table 106: Japan Probiotic Drinks Industry Volume (K Units) Forecast, by Application 2019 & 2032
- Table 107: Australia Probiotic Drinks Industry Revenue (Million) Forecast, by Application 2019 & 2032
- Table 108: Australia Probiotic Drinks Industry Volume (K Units) Forecast, by Application 2019 & 2032
- Table 109: India Probiotic Drinks Industry Revenue (Million) Forecast, by Application 2019 & 2032
- Table 110: India Probiotic Drinks Industry Volume (K Units) Forecast, by Application 2019 & 2032
- Table 111: Rest of Asia Pacific Probiotic Drinks Industry Revenue (Million) Forecast, by Application 2019 & 2032
- Table 112: Rest of Asia Pacific Probiotic Drinks Industry Volume (K Units) Forecast, by Application 2019 & 2032
- Table 113: Global Probiotic Drinks Industry Revenue Million Forecast, by Product Type 2019 & 2032
- Table 114: Global Probiotic Drinks Industry Volume K Units Forecast, by Product Type 2019 & 2032
- Table 115: Global Probiotic Drinks Industry Revenue Million Forecast, by Distribution Channel 2019 & 2032
- Table 116: Global Probiotic Drinks Industry Volume K Units Forecast, by Distribution Channel 2019 & 2032
- Table 117: Global Probiotic Drinks Industry Revenue Million Forecast, by Country 2019 & 2032
- Table 118: Global Probiotic Drinks Industry Volume K Units Forecast, by Country 2019 & 2032
- Table 119: Brazil Probiotic Drinks Industry Revenue (Million) Forecast, by Application 2019 & 2032
- Table 120: Brazil Probiotic Drinks Industry Volume (K Units) Forecast, by Application 2019 & 2032
- Table 121: Argentina Probiotic Drinks Industry Revenue (Million) Forecast, by Application 2019 & 2032
- Table 122: Argentina Probiotic Drinks Industry Volume (K Units) Forecast, by Application 2019 & 2032
- Table 123: Rest of South America Probiotic Drinks Industry Revenue (Million) Forecast, by Application 2019 & 2032
- Table 124: Rest of South America Probiotic Drinks Industry Volume (K Units) Forecast, by Application 2019 & 2032
- Table 125: Global Probiotic Drinks Industry Revenue Million Forecast, by Product Type 2019 & 2032
- Table 126: Global Probiotic Drinks Industry Volume K Units Forecast, by Product Type 2019 & 2032
- Table 127: Global Probiotic Drinks Industry Revenue Million Forecast, by Distribution Channel 2019 & 2032
- Table 128: Global Probiotic Drinks Industry Volume K Units Forecast, by Distribution Channel 2019 & 2032
- Table 129: Global Probiotic Drinks Industry Revenue Million Forecast, by Country 2019 & 2032
- Table 130: Global Probiotic Drinks Industry Volume K Units Forecast, by Country 2019 & 2032
- Table 131: South Africa Probiotic Drinks Industry Revenue (Million) Forecast, by Application 2019 & 2032
- Table 132: South Africa Probiotic Drinks Industry Volume (K Units) Forecast, by Application 2019 & 2032
- Table 133: United Arab Emirates Probiotic Drinks Industry Revenue (Million) Forecast, by Application 2019 & 2032
- Table 134: United Arab Emirates Probiotic Drinks Industry Volume (K Units) Forecast, by Application 2019 & 2032
- Table 135: Rest of Middle East and Africa Probiotic Drinks Industry Revenue (Million) Forecast, by Application 2019 & 2032
- Table 136: Rest of Middle East and Africa Probiotic Drinks Industry Volume (K Units) Forecast, by Application 2019 & 2032
Frequently Asked Questions
1. What is the projected Compound Annual Growth Rate (CAGR) of the Probiotic Drinks Industry?
The projected CAGR is approximately 9.82%.
2. Which companies are prominent players in the Probiotic Drinks Industry?
Key companies in the market include Lala Branded Products LLC, PepsiCo Inc, Yakult Honsha Co Ltd, Harmless Harvest Inc, Groupe Danone SA, Lifeway Foods Inc, Kerry Group PLC (Bio-K Plus International Inc ), Obi Probiotic Soda*List Not Exhaustive, Fonterra Co-op Group Ltd, Groupe Lactalis.
3. What are the main segments of the Probiotic Drinks Industry?
The market segments include Product Type, Distribution Channel.
4. Can you provide details about the market size?
The market size is estimated to be USD 41.13 Million as of 2022.
5. What are some drivers contributing to market growth?
Increasing Demand for Protein Rich Food and Supplements; Increasing Application of Collagen in Personal Care Products.
6. What are the notable trends driving market growth?
Growing Demand for Functional Beverages.
7. Are there any restraints impacting market growth?
Increasing Demand for Plant-Based Protein.
8. Can you provide examples of recent developments in the market?
June 2022: Danone launched the new drinkable yogurt Activa+. Activa+ is a multi-benefit drinkable yogurt made with active probiotic vitamins A, D, and zinc. The product is available in different flavors like raspberry, peach, and strawberry.
9. What pricing options are available for accessing the report?
Pricing options include single-user, multi-user, and enterprise licenses priced at USD 4750, USD 5250, and USD 8750 respectively.
10. Is the market size provided in terms of value or volume?
The market size is provided in terms of value, measured in Million and volume, measured in K Units.
11. Are there any specific market keywords associated with the report?
Yes, the market keyword associated with the report is "Probiotic Drinks Industry," which aids in identifying and referencing the specific market segment covered.
12. How do I determine which pricing option suits my needs best?
The pricing options vary based on user requirements and access needs. Individual users may opt for single-user licenses, while businesses requiring broader access may choose multi-user or enterprise licenses for cost-effective access to the report.
13. Are there any additional resources or data provided in the Probiotic Drinks Industry report?
While the report offers comprehensive insights, it's advisable to review the specific contents or supplementary materials provided to ascertain if additional resources or data are available.
14. How can I stay updated on further developments or reports in the Probiotic Drinks Industry?
To stay informed about further developments, trends, and reports in the Probiotic Drinks Industry, consider subscribing to industry newsletters, following relevant companies and organizations, or regularly checking reputable industry news sources and publications.
Methodology
Step 1 - Identification of Relevant Samples Size from Population Database


Step 2 - Approaches for Defining Global Market Size (Value, Volume* & Price*)

Note*: In applicable scenarios
Step 3 - Data Sources
Primary Research
- Web Analytics
- Survey Reports
- Research Institute
- Latest Research Reports
- Opinion Leaders
Secondary Research
- Annual Reports
- White Paper
- Latest Press Release
- Industry Association
- Paid Database
- Investor Presentations

Step 4 - Data Triangulation
Involves using different sources of information in order to increase the validity of a study
These sources are likely to be stakeholders in a program - participants, other researchers, program staff, other community members, and so on.
Then we put all data in single framework & apply various statistical tools to find out the dynamic on the market.
During the analysis stage, feedback from the stakeholder groups would be compared to determine areas of agreement as well as areas of divergence


