
Key Insights
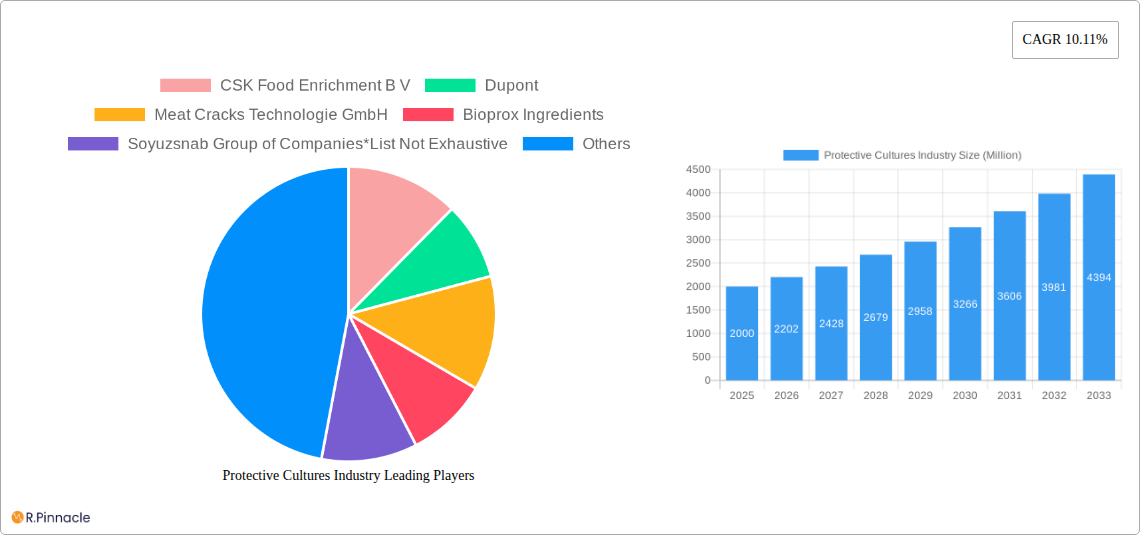
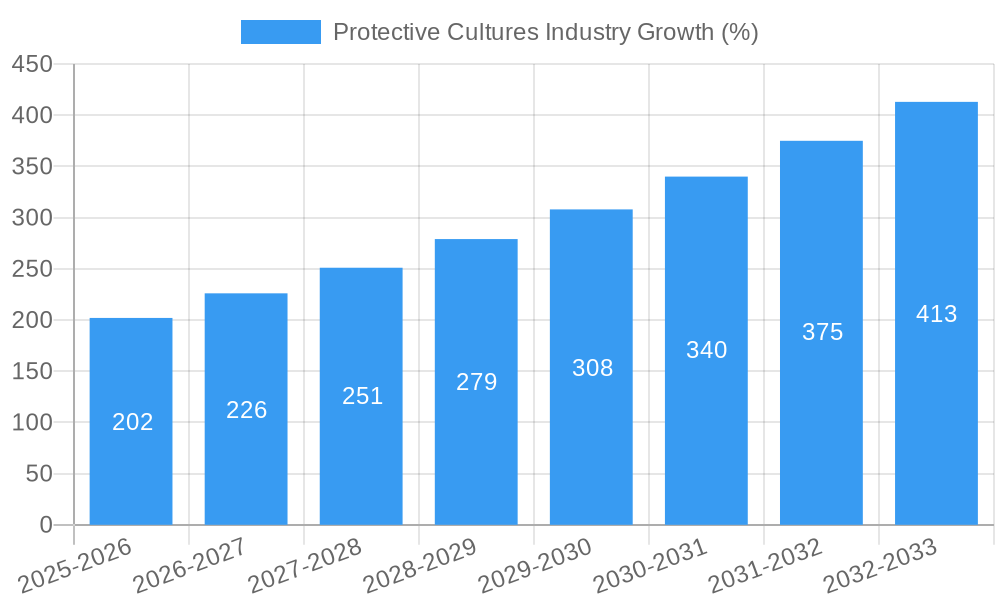
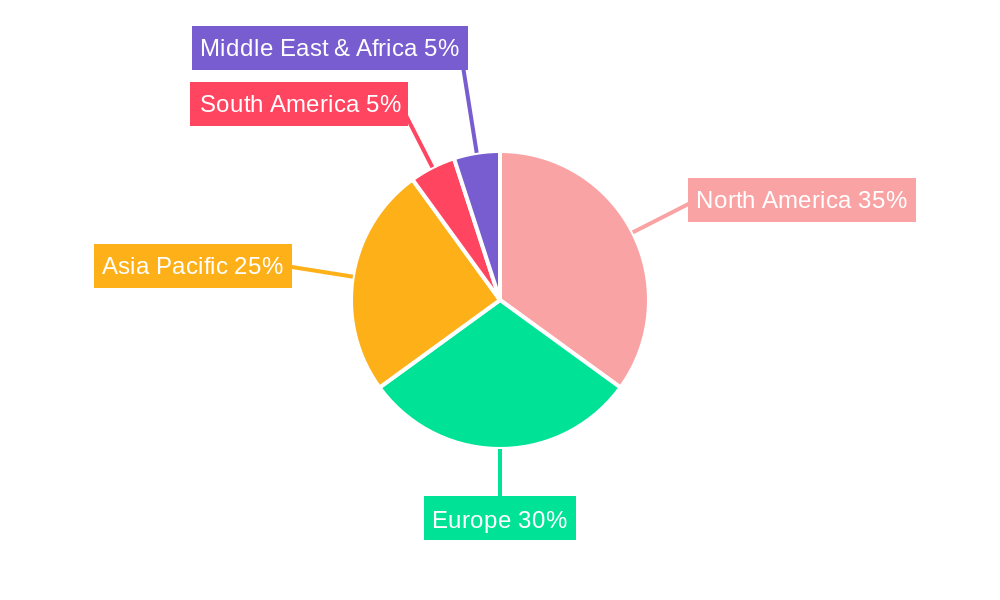
The global protective cultures market, valued at approximately $XX million in 2025, is projected to experience robust growth, exhibiting a compound annual growth rate (CAGR) of 10.11% from 2025 to 2033. This expansion is driven by several key factors. The increasing demand for natural and clean-label food products fuels the adoption of protective cultures as a safer alternative to chemical preservatives. Growing consumer awareness regarding food safety and the rising prevalence of foodborne illnesses further bolster market growth. The burgeoning demand for extended shelf-life products, particularly in the ready-to-eat food sector, is another significant driver. Technological advancements in culture development and application methods also contribute to market expansion. Different forms of protective cultures, such as freeze-dried and frozen, cater to diverse industry needs and preferences, while the diverse range of microorganisms (yeasts, molds, and bacteria) allows for tailored solutions depending on the application. The market is segmented by form, microorganism type, and application, with dairy products, meat, poultry, and seafood exhibiting significant demand. Key players in this market include CSK Food Enrichment B.V., DuPont, DSM Nutritional Products, and others, actively engaged in research, development, and market expansion. Regional growth varies, with North America and Europe currently holding larger market shares, however, the Asia-Pacific region is expected to exhibit significant growth in the coming years due to rising disposable incomes and changing dietary habits.
The market faces some restraints, including fluctuating raw material prices and stringent regulatory compliance requirements. However, the overall market outlook remains positive. The continuous innovation in protective culture technology, coupled with the growing emphasis on food safety and natural preservation methods, is expected to offset these challenges. The market is likely to witness increased mergers and acquisitions, strategic partnerships, and product diversification as companies strive to gain a competitive edge. The expanding application of protective cultures in various food segments, including functional foods and fermented products, will further contribute to market expansion in the forecast period. The continuous focus on research and development of new and improved protective cultures is expected to drive the market’s long-term growth trajectory.
Protective Cultures Industry Report: 2019-2033 Forecast
This comprehensive report provides an in-depth analysis of the Protective Cultures industry, projecting market trends from 2019 to 2033. Targeting industry professionals, this report offers actionable insights into market dynamics, competitive landscapes, and future opportunities within the $xx Million market. The study period covers 2019-2033, with a base year of 2025 and a forecast period of 2025-2033. Key players analyzed include CSK Food Enrichment B V, DuPont, Meat Cracks Technologie GmbH, Bioprox Ingredients, Soyuzsnab Group of Companies, DSM Nutritional Products, Dalton Biotechnologies S R L, Biochem S R L, Aristomenis D Phikas & Co S A, Sacco S R L, THT S A, and Chr Hansen.
Protective Cultures Industry Market Structure & Innovation Trends
The Protective Cultures market displays a moderately concentrated structure, with key players holding significant market share. The industry is driven by innovation in bio-preservation technologies, increasing consumer demand for clean-label products, and stringent food safety regulations. Regulatory frameworks, such as those governing the use of food additives and preservatives, significantly impact market growth. Product substitutes, including chemical preservatives, present a competitive challenge. The end-user demographic is broad, encompassing food and beverage manufacturers across various segments. M&A activities have been moderate, with deal values averaging $xx Million in recent years.
- Market Concentration: Moderate concentration with top 5 players holding approximately xx% of the market share (2025).
- Innovation Drivers: Demand for extended shelf life, clean-label trends, and stricter food safety regulations.
- Regulatory Frameworks: Stringent regulations regarding the use of preservatives and bio-protective cultures impact market dynamics.
- M&A Activity: Annual deal value (2019-2024): $xx Million average.
Protective Cultures Industry Market Dynamics & Trends
The Protective Cultures market is experiencing robust growth, driven by several factors. The increasing demand for extended shelf life products, rising consumer awareness of food safety, and the shift towards natural and clean-label ingredients are major contributors. Technological advancements in culture development and application are further boosting market expansion. Competitive dynamics are characterized by both intense competition among established players and the emergence of new entrants. The industry's CAGR from 2025 to 2033 is projected to be xx%, while market penetration is expected to reach xx% by 2033.
Dominant Regions & Segments in Protective Cultures Industry
The [Region Name, e.g., North America] region dominates the Protective Cultures market, driven by factors such as strong food processing industries, high consumer disposable income, and favorable regulatory environments. Within segments:
- By Form: Freeze-dried cultures hold a larger market share than frozen cultures due to their longer shelf life and ease of handling.
- By Microorganism Type: Bacteria-based cultures dominate due to their versatility and efficacy in various applications.
- By Application: Dairy products represent the largest application segment, followed by meat, poultry, and seafood products.
Key Drivers (By Region):
- Strong food processing infrastructure.
- High consumer spending on processed food.
- Supportive government regulations.
Protective Cultures Industry Product Innovations
Recent years have witnessed significant product innovations in the Protective Cultures industry. Companies are focusing on developing cultures with enhanced efficacy, extended shelf life, and improved organoleptic properties. Technological advancements are leading to the introduction of customized cultures tailored to specific applications and addressing consumer demands for clean label and natural products. This innovation directly impacts market competitiveness and drives adoption among food manufacturers.
Report Scope & Segmentation Analysis
This report segments the Protective Cultures market by form (freeze-dried, frozen), microorganism type (yeasts, molds, bacteria), and application (dairy products, meat, poultry and seafood, ready-to-eat foods, other). Each segment presents unique growth opportunities and competitive dynamics. Market size estimations and growth projections are provided for each segment for the forecast period (2025-2033), reflecting the dynamic evolution of this market. Competitive dynamics within each segment are analyzed based on market share, innovation capabilities and strategies of key players.
By Form: Freeze-dried is projected to grow at xx% CAGR, while Frozen at xx%. By Microorganism Type: Bacteria segment is expected to dominate with xx% market share by 2033. By Application: Dairy segment is projected to witness a significant growth of xx% during the forecast period.
Key Drivers of Protective Cultures Industry Growth
The growth of the Protective Cultures industry is propelled by several key factors. The increasing demand for extended shelf life products to minimize food waste is a significant driver. The rising consumer preference for natural and clean-label ingredients is also boosting demand for protective cultures as an alternative to synthetic preservatives. Furthermore, stringent food safety regulations worldwide are driving adoption of these cultures to enhance food safety and reduce risks associated with pathogenic bacteria.
Challenges in the Protective Cultures Industry Sector
The Protective Cultures industry faces certain challenges, including stringent regulatory hurdles for new product approvals. Supply chain complexities and inconsistencies in raw material quality can also affect production. Furthermore, intense competition from established players and the emergence of new entrants creates pressure on pricing and margins. These factors can impact overall market growth and profitability. The estimated impact of these factors on market growth is an estimated reduction of xx% annually.
Emerging Opportunities in Protective Cultures Industry
Emerging opportunities lie in expanding into new geographical markets with growing food processing sectors. The development of novel cultures with specialized functionalities, such as improved taste and texture, will open new avenues for growth. Tailoring cultures to specific niche applications and catering to the growing demand for personalized nutrition will also present significant opportunities.
Leading Players in the Protective Cultures Industry Market
- CSK Food Enrichment B V
- DuPont
- Meat Cracks Technologie GmbH
- Bioprox Ingredients
- Soyuzsnab Group of Companies
- DSM Nutritional Products
- Dalton Biotechnologies S R L
- Biochem S R L
- Aristomenis D Phikas & Co S A
- Sacco S R L
- THT S A
- Chr Hansen
Key Developments in Protective Cultures Industry
- December 2017: CSK Food Enrichment B.V. opens new R&D facility, signaling future product launches.
- November 2017: Chr. Hansen launches second-generation FreshQ bio-protective cultures with improved temperature resistance.
- April 2018: DuPont Nutrition & Health launches new cheese cultures (CHOOZIT SWIFT 600 and CHOOZIT AMERI-FLEX) for improved consistency.
- June 2018: Meat Cracks Technologies GmbH launches new M-Culture variant to combat listeria in meat products.
- October 2018: DuPont launches DuPont Danisco Lactobacillus Plus for fermented milk production.
- November 2018: DSM expands Delvo Guard protective cultures for clean-label dairy products.
Future Outlook for Protective Cultures Industry Market
The Protective Cultures industry is poised for significant growth in the coming years, driven by consistent demand for extended shelf life and clean-label food products. Strategic partnerships, acquisitions, and continued investments in R&D will further shape the industry's landscape. The focus on developing innovative cultures tailored to meet specific needs and preferences of consumers will unlock significant future market potential.
Protective Cultures Industry Segmentation
-
1. Form
- 1.1. Freeze-Dried
- 1.2. Frozen
-
2. Microorganism Type
- 2.1. Yeasts
- 2.2. Molds
- 2.3. Bacteria
-
3. Application
- 3.1. Dairy Products
- 3.2. Meat, Poultry and Seafood Products
- 3.3. Ready to Eat Food Products
- 3.4. Other Applications
Protective Cultures Industry Segmentation By Geography
-
1. North America
- 1.1. United States
- 1.2. Canada
- 1.3. Mexico
- 1.4. Rest of North America
-
2. Europe
- 2.1. United Kingdom
- 2.2. Germany
- 2.3. Spain
- 2.4. France
- 2.5. Italy
- 2.6. Rest of Europe
-
3. Asia Pacific
- 3.1. China
- 3.2. Japan
- 3.3. India
- 3.4. Australia
- 3.5. Rest of Asia Pacific
-
4. South America
- 4.1. Brazil
- 4.2. Argentina
- 4.3. Rest of South America
- 5. Middle East
-
6. United Arab Emirates
- 6.1. South Africa
- 6.2. Rest of Middle East
Protective Cultures Industry REPORT HIGHLIGHTS
| Aspects | Details |
|---|---|
| Study Period | 2019-2033 |
| Base Year | 2024 |
| Estimated Year | 2025 |
| Forecast Period | 2025-2033 |
| Historical Period | 2019-2024 |
| Growth Rate | CAGR of 10.11% from 2019-2033 |
| Segmentation |
|
Table of Contents
- 1. Introduction
- 1.1. Research Scope
- 1.2. Market Segmentation
- 1.3. Research Methodology
- 1.4. Definitions and Assumptions
- 2. Executive Summary
- 2.1. Introduction
- 3. Market Dynamics
- 3.1. Introduction
- 3.2. Market Drivers
- 3.2.1. Rising Health Consciousness among consumer
- 3.3. Market Restrains
- 3.3.1. High Cost of natural Ingredients
- 3.4. Market Trends
- 3.4.1. Increasing Consumption of Dairy Products
- 4. Market Factor Analysis
- 4.1. Porters Five Forces
- 4.2. Supply/Value Chain
- 4.3. PESTEL analysis
- 4.4. Market Entropy
- 4.5. Patent/Trademark Analysis
- 5. Global Protective Cultures Industry Analysis, Insights and Forecast, 2019-2031
- 5.1. Market Analysis, Insights and Forecast - by Form
- 5.1.1. Freeze-Dried
- 5.1.2. Frozen
- 5.2. Market Analysis, Insights and Forecast - by Microorganism Type
- 5.2.1. Yeasts
- 5.2.2. Molds
- 5.2.3. Bacteria
- 5.3. Market Analysis, Insights and Forecast - by Application
- 5.3.1. Dairy Products
- 5.3.2. Meat, Poultry and Seafood Products
- 5.3.3. Ready to Eat Food Products
- 5.3.4. Other Applications
- 5.4. Market Analysis, Insights and Forecast - by Region
- 5.4.1. North America
- 5.4.2. Europe
- 5.4.3. Asia Pacific
- 5.4.4. South America
- 5.4.5. Middle East
- 5.4.6. United Arab Emirates
- 5.1. Market Analysis, Insights and Forecast - by Form
- 6. North America Protective Cultures Industry Analysis, Insights and Forecast, 2019-2031
- 6.1. Market Analysis, Insights and Forecast - by Form
- 6.1.1. Freeze-Dried
- 6.1.2. Frozen
- 6.2. Market Analysis, Insights and Forecast - by Microorganism Type
- 6.2.1. Yeasts
- 6.2.2. Molds
- 6.2.3. Bacteria
- 6.3. Market Analysis, Insights and Forecast - by Application
- 6.3.1. Dairy Products
- 6.3.2. Meat, Poultry and Seafood Products
- 6.3.3. Ready to Eat Food Products
- 6.3.4. Other Applications
- 6.1. Market Analysis, Insights and Forecast - by Form
- 7. Europe Protective Cultures Industry Analysis, Insights and Forecast, 2019-2031
- 7.1. Market Analysis, Insights and Forecast - by Form
- 7.1.1. Freeze-Dried
- 7.1.2. Frozen
- 7.2. Market Analysis, Insights and Forecast - by Microorganism Type
- 7.2.1. Yeasts
- 7.2.2. Molds
- 7.2.3. Bacteria
- 7.3. Market Analysis, Insights and Forecast - by Application
- 7.3.1. Dairy Products
- 7.3.2. Meat, Poultry and Seafood Products
- 7.3.3. Ready to Eat Food Products
- 7.3.4. Other Applications
- 7.1. Market Analysis, Insights and Forecast - by Form
- 8. Asia Pacific Protective Cultures Industry Analysis, Insights and Forecast, 2019-2031
- 8.1. Market Analysis, Insights and Forecast - by Form
- 8.1.1. Freeze-Dried
- 8.1.2. Frozen
- 8.2. Market Analysis, Insights and Forecast - by Microorganism Type
- 8.2.1. Yeasts
- 8.2.2. Molds
- 8.2.3. Bacteria
- 8.3. Market Analysis, Insights and Forecast - by Application
- 8.3.1. Dairy Products
- 8.3.2. Meat, Poultry and Seafood Products
- 8.3.3. Ready to Eat Food Products
- 8.3.4. Other Applications
- 8.1. Market Analysis, Insights and Forecast - by Form
- 9. South America Protective Cultures Industry Analysis, Insights and Forecast, 2019-2031
- 9.1. Market Analysis, Insights and Forecast - by Form
- 9.1.1. Freeze-Dried
- 9.1.2. Frozen
- 9.2. Market Analysis, Insights and Forecast - by Microorganism Type
- 9.2.1. Yeasts
- 9.2.2. Molds
- 9.2.3. Bacteria
- 9.3. Market Analysis, Insights and Forecast - by Application
- 9.3.1. Dairy Products
- 9.3.2. Meat, Poultry and Seafood Products
- 9.3.3. Ready to Eat Food Products
- 9.3.4. Other Applications
- 9.1. Market Analysis, Insights and Forecast - by Form
- 10. Middle East Protective Cultures Industry Analysis, Insights and Forecast, 2019-2031
- 10.1. Market Analysis, Insights and Forecast - by Form
- 10.1.1. Freeze-Dried
- 10.1.2. Frozen
- 10.2. Market Analysis, Insights and Forecast - by Microorganism Type
- 10.2.1. Yeasts
- 10.2.2. Molds
- 10.2.3. Bacteria
- 10.3. Market Analysis, Insights and Forecast - by Application
- 10.3.1. Dairy Products
- 10.3.2. Meat, Poultry and Seafood Products
- 10.3.3. Ready to Eat Food Products
- 10.3.4. Other Applications
- 10.1. Market Analysis, Insights and Forecast - by Form
- 11. United Arab Emirates Protective Cultures Industry Analysis, Insights and Forecast, 2019-2031
- 11.1. Market Analysis, Insights and Forecast - by Form
- 11.1.1. Freeze-Dried
- 11.1.2. Frozen
- 11.2. Market Analysis, Insights and Forecast - by Microorganism Type
- 11.2.1. Yeasts
- 11.2.2. Molds
- 11.2.3. Bacteria
- 11.3. Market Analysis, Insights and Forecast - by Application
- 11.3.1. Dairy Products
- 11.3.2. Meat, Poultry and Seafood Products
- 11.3.3. Ready to Eat Food Products
- 11.3.4. Other Applications
- 11.1. Market Analysis, Insights and Forecast - by Form
- 12. North America Protective Cultures Industry Analysis, Insights and Forecast, 2019-2031
- 12.1. Market Analysis, Insights and Forecast - By Country/Sub-region
- 12.1.1 United States
- 12.1.2 Canada
- 12.1.3 Mexico
- 12.1.4 Rest of North America
- 13. Europe Protective Cultures Industry Analysis, Insights and Forecast, 2019-2031
- 13.1. Market Analysis, Insights and Forecast - By Country/Sub-region
- 13.1.1 United Kingdom
- 13.1.2 Germany
- 13.1.3 Spain
- 13.1.4 France
- 13.1.5 Italy
- 13.1.6 Rest of Europe
- 14. Asia Pacific Protective Cultures Industry Analysis, Insights and Forecast, 2019-2031
- 14.1. Market Analysis, Insights and Forecast - By Country/Sub-region
- 14.1.1 China
- 14.1.2 Japan
- 14.1.3 India
- 14.1.4 Australia
- 14.1.5 Rest of Asia Pacific
- 15. South America Protective Cultures Industry Analysis, Insights and Forecast, 2019-2031
- 15.1. Market Analysis, Insights and Forecast - By Country/Sub-region
- 15.1.1 Brazil
- 15.1.2 Argentina
- 15.1.3 Rest of South America
- 16. Middle East Protective Cultures Industry Analysis, Insights and Forecast, 2019-2031
- 16.1. Market Analysis, Insights and Forecast - By Country/Sub-region
- 16.1.1.
- 17. United Arab Emirates Protective Cultures Industry Analysis, Insights and Forecast, 2019-2031
- 17.1. Market Analysis, Insights and Forecast - By Country/Sub-region
- 17.1.1 South Africa
- 17.1.2 Rest of Middle East
- 18. Competitive Analysis
- 18.1. Global Market Share Analysis 2024
- 18.2. Company Profiles
- 18.2.1 CSK Food Enrichment B V
- 18.2.1.1. Overview
- 18.2.1.2. Products
- 18.2.1.3. SWOT Analysis
- 18.2.1.4. Recent Developments
- 18.2.1.5. Financials (Based on Availability)
- 18.2.2 Dupont
- 18.2.2.1. Overview
- 18.2.2.2. Products
- 18.2.2.3. SWOT Analysis
- 18.2.2.4. Recent Developments
- 18.2.2.5. Financials (Based on Availability)
- 18.2.3 Meat Cracks Technologie GmbH
- 18.2.3.1. Overview
- 18.2.3.2. Products
- 18.2.3.3. SWOT Analysis
- 18.2.3.4. Recent Developments
- 18.2.3.5. Financials (Based on Availability)
- 18.2.4 Bioprox Ingredients
- 18.2.4.1. Overview
- 18.2.4.2. Products
- 18.2.4.3. SWOT Analysis
- 18.2.4.4. Recent Developments
- 18.2.4.5. Financials (Based on Availability)
- 18.2.5 Soyuzsnab Group of Companies*List Not Exhaustive
- 18.2.5.1. Overview
- 18.2.5.2. Products
- 18.2.5.3. SWOT Analysis
- 18.2.5.4. Recent Developments
- 18.2.5.5. Financials (Based on Availability)
- 18.2.6 DSM Nutritional Products
- 18.2.6.1. Overview
- 18.2.6.2. Products
- 18.2.6.3. SWOT Analysis
- 18.2.6.4. Recent Developments
- 18.2.6.5. Financials (Based on Availability)
- 18.2.7 Dalton Biotechnologies S R L
- 18.2.7.1. Overview
- 18.2.7.2. Products
- 18.2.7.3. SWOT Analysis
- 18.2.7.4. Recent Developments
- 18.2.7.5. Financials (Based on Availability)
- 18.2.8 Biochem S R L
- 18.2.8.1. Overview
- 18.2.8.2. Products
- 18.2.8.3. SWOT Analysis
- 18.2.8.4. Recent Developments
- 18.2.8.5. Financials (Based on Availability)
- 18.2.9 Aristomenis D Phikas & Co S A
- 18.2.9.1. Overview
- 18.2.9.2. Products
- 18.2.9.3. SWOT Analysis
- 18.2.9.4. Recent Developments
- 18.2.9.5. Financials (Based on Availability)
- 18.2.10 Sacco S R L
- 18.2.10.1. Overview
- 18.2.10.2. Products
- 18.2.10.3. SWOT Analysis
- 18.2.10.4. Recent Developments
- 18.2.10.5. Financials (Based on Availability)
- 18.2.11 THT S A
- 18.2.11.1. Overview
- 18.2.11.2. Products
- 18.2.11.3. SWOT Analysis
- 18.2.11.4. Recent Developments
- 18.2.11.5. Financials (Based on Availability)
- 18.2.12 Chr Hansen
- 18.2.12.1. Overview
- 18.2.12.2. Products
- 18.2.12.3. SWOT Analysis
- 18.2.12.4. Recent Developments
- 18.2.12.5. Financials (Based on Availability)
- 18.2.1 CSK Food Enrichment B V
List of Figures
- Figure 1: Global Protective Cultures Industry Revenue Breakdown (Million, %) by Region 2024 & 2032
- Figure 2: North America Protective Cultures Industry Revenue (Million), by Country 2024 & 2032
- Figure 3: North America Protective Cultures Industry Revenue Share (%), by Country 2024 & 2032
- Figure 4: Europe Protective Cultures Industry Revenue (Million), by Country 2024 & 2032
- Figure 5: Europe Protective Cultures Industry Revenue Share (%), by Country 2024 & 2032
- Figure 6: Asia Pacific Protective Cultures Industry Revenue (Million), by Country 2024 & 2032
- Figure 7: Asia Pacific Protective Cultures Industry Revenue Share (%), by Country 2024 & 2032
- Figure 8: South America Protective Cultures Industry Revenue (Million), by Country 2024 & 2032
- Figure 9: South America Protective Cultures Industry Revenue Share (%), by Country 2024 & 2032
- Figure 10: Middle East Protective Cultures Industry Revenue (Million), by Country 2024 & 2032
- Figure 11: Middle East Protective Cultures Industry Revenue Share (%), by Country 2024 & 2032
- Figure 12: United Arab Emirates Protective Cultures Industry Revenue (Million), by Country 2024 & 2032
- Figure 13: United Arab Emirates Protective Cultures Industry Revenue Share (%), by Country 2024 & 2032
- Figure 14: North America Protective Cultures Industry Revenue (Million), by Form 2024 & 2032
- Figure 15: North America Protective Cultures Industry Revenue Share (%), by Form 2024 & 2032
- Figure 16: North America Protective Cultures Industry Revenue (Million), by Microorganism Type 2024 & 2032
- Figure 17: North America Protective Cultures Industry Revenue Share (%), by Microorganism Type 2024 & 2032
- Figure 18: North America Protective Cultures Industry Revenue (Million), by Application 2024 & 2032
- Figure 19: North America Protective Cultures Industry Revenue Share (%), by Application 2024 & 2032
- Figure 20: North America Protective Cultures Industry Revenue (Million), by Country 2024 & 2032
- Figure 21: North America Protective Cultures Industry Revenue Share (%), by Country 2024 & 2032
- Figure 22: Europe Protective Cultures Industry Revenue (Million), by Form 2024 & 2032
- Figure 23: Europe Protective Cultures Industry Revenue Share (%), by Form 2024 & 2032
- Figure 24: Europe Protective Cultures Industry Revenue (Million), by Microorganism Type 2024 & 2032
- Figure 25: Europe Protective Cultures Industry Revenue Share (%), by Microorganism Type 2024 & 2032
- Figure 26: Europe Protective Cultures Industry Revenue (Million), by Application 2024 & 2032
- Figure 27: Europe Protective Cultures Industry Revenue Share (%), by Application 2024 & 2032
- Figure 28: Europe Protective Cultures Industry Revenue (Million), by Country 2024 & 2032
- Figure 29: Europe Protective Cultures Industry Revenue Share (%), by Country 2024 & 2032
- Figure 30: Asia Pacific Protective Cultures Industry Revenue (Million), by Form 2024 & 2032
- Figure 31: Asia Pacific Protective Cultures Industry Revenue Share (%), by Form 2024 & 2032
- Figure 32: Asia Pacific Protective Cultures Industry Revenue (Million), by Microorganism Type 2024 & 2032
- Figure 33: Asia Pacific Protective Cultures Industry Revenue Share (%), by Microorganism Type 2024 & 2032
- Figure 34: Asia Pacific Protective Cultures Industry Revenue (Million), by Application 2024 & 2032
- Figure 35: Asia Pacific Protective Cultures Industry Revenue Share (%), by Application 2024 & 2032
- Figure 36: Asia Pacific Protective Cultures Industry Revenue (Million), by Country 2024 & 2032
- Figure 37: Asia Pacific Protective Cultures Industry Revenue Share (%), by Country 2024 & 2032
- Figure 38: South America Protective Cultures Industry Revenue (Million), by Form 2024 & 2032
- Figure 39: South America Protective Cultures Industry Revenue Share (%), by Form 2024 & 2032
- Figure 40: South America Protective Cultures Industry Revenue (Million), by Microorganism Type 2024 & 2032
- Figure 41: South America Protective Cultures Industry Revenue Share (%), by Microorganism Type 2024 & 2032
- Figure 42: South America Protective Cultures Industry Revenue (Million), by Application 2024 & 2032
- Figure 43: South America Protective Cultures Industry Revenue Share (%), by Application 2024 & 2032
- Figure 44: South America Protective Cultures Industry Revenue (Million), by Country 2024 & 2032
- Figure 45: South America Protective Cultures Industry Revenue Share (%), by Country 2024 & 2032
- Figure 46: Middle East Protective Cultures Industry Revenue (Million), by Form 2024 & 2032
- Figure 47: Middle East Protective Cultures Industry Revenue Share (%), by Form 2024 & 2032
- Figure 48: Middle East Protective Cultures Industry Revenue (Million), by Microorganism Type 2024 & 2032
- Figure 49: Middle East Protective Cultures Industry Revenue Share (%), by Microorganism Type 2024 & 2032
- Figure 50: Middle East Protective Cultures Industry Revenue (Million), by Application 2024 & 2032
- Figure 51: Middle East Protective Cultures Industry Revenue Share (%), by Application 2024 & 2032
- Figure 52: Middle East Protective Cultures Industry Revenue (Million), by Country 2024 & 2032
- Figure 53: Middle East Protective Cultures Industry Revenue Share (%), by Country 2024 & 2032
- Figure 54: United Arab Emirates Protective Cultures Industry Revenue (Million), by Form 2024 & 2032
- Figure 55: United Arab Emirates Protective Cultures Industry Revenue Share (%), by Form 2024 & 2032
- Figure 56: United Arab Emirates Protective Cultures Industry Revenue (Million), by Microorganism Type 2024 & 2032
- Figure 57: United Arab Emirates Protective Cultures Industry Revenue Share (%), by Microorganism Type 2024 & 2032
- Figure 58: United Arab Emirates Protective Cultures Industry Revenue (Million), by Application 2024 & 2032
- Figure 59: United Arab Emirates Protective Cultures Industry Revenue Share (%), by Application 2024 & 2032
- Figure 60: United Arab Emirates Protective Cultures Industry Revenue (Million), by Country 2024 & 2032
- Figure 61: United Arab Emirates Protective Cultures Industry Revenue Share (%), by Country 2024 & 2032
List of Tables
- Table 1: Global Protective Cultures Industry Revenue Million Forecast, by Region 2019 & 2032
- Table 2: Global Protective Cultures Industry Revenue Million Forecast, by Form 2019 & 2032
- Table 3: Global Protective Cultures Industry Revenue Million Forecast, by Microorganism Type 2019 & 2032
- Table 4: Global Protective Cultures Industry Revenue Million Forecast, by Application 2019 & 2032
- Table 5: Global Protective Cultures Industry Revenue Million Forecast, by Region 2019 & 2032
- Table 6: Global Protective Cultures Industry Revenue Million Forecast, by Country 2019 & 2032
- Table 7: United States Protective Cultures Industry Revenue (Million) Forecast, by Application 2019 & 2032
- Table 8: Canada Protective Cultures Industry Revenue (Million) Forecast, by Application 2019 & 2032
- Table 9: Mexico Protective Cultures Industry Revenue (Million) Forecast, by Application 2019 & 2032
- Table 10: Rest of North America Protective Cultures Industry Revenue (Million) Forecast, by Application 2019 & 2032
- Table 11: Global Protective Cultures Industry Revenue Million Forecast, by Country 2019 & 2032
- Table 12: United Kingdom Protective Cultures Industry Revenue (Million) Forecast, by Application 2019 & 2032
- Table 13: Germany Protective Cultures Industry Revenue (Million) Forecast, by Application 2019 & 2032
- Table 14: Spain Protective Cultures Industry Revenue (Million) Forecast, by Application 2019 & 2032
- Table 15: France Protective Cultures Industry Revenue (Million) Forecast, by Application 2019 & 2032
- Table 16: Italy Protective Cultures Industry Revenue (Million) Forecast, by Application 2019 & 2032
- Table 17: Rest of Europe Protective Cultures Industry Revenue (Million) Forecast, by Application 2019 & 2032
- Table 18: Global Protective Cultures Industry Revenue Million Forecast, by Country 2019 & 2032
- Table 19: China Protective Cultures Industry Revenue (Million) Forecast, by Application 2019 & 2032
- Table 20: Japan Protective Cultures Industry Revenue (Million) Forecast, by Application 2019 & 2032
- Table 21: India Protective Cultures Industry Revenue (Million) Forecast, by Application 2019 & 2032
- Table 22: Australia Protective Cultures Industry Revenue (Million) Forecast, by Application 2019 & 2032
- Table 23: Rest of Asia Pacific Protective Cultures Industry Revenue (Million) Forecast, by Application 2019 & 2032
- Table 24: Global Protective Cultures Industry Revenue Million Forecast, by Country 2019 & 2032
- Table 25: Brazil Protective Cultures Industry Revenue (Million) Forecast, by Application 2019 & 2032
- Table 26: Argentina Protective Cultures Industry Revenue (Million) Forecast, by Application 2019 & 2032
- Table 27: Rest of South America Protective Cultures Industry Revenue (Million) Forecast, by Application 2019 & 2032
- Table 28: Global Protective Cultures Industry Revenue Million Forecast, by Country 2019 & 2032
- Table 29: Protective Cultures Industry Revenue (Million) Forecast, by Application 2019 & 2032
- Table 30: Global Protective Cultures Industry Revenue Million Forecast, by Country 2019 & 2032
- Table 31: South Africa Protective Cultures Industry Revenue (Million) Forecast, by Application 2019 & 2032
- Table 32: Rest of Middle East Protective Cultures Industry Revenue (Million) Forecast, by Application 2019 & 2032
- Table 33: Global Protective Cultures Industry Revenue Million Forecast, by Form 2019 & 2032
- Table 34: Global Protective Cultures Industry Revenue Million Forecast, by Microorganism Type 2019 & 2032
- Table 35: Global Protective Cultures Industry Revenue Million Forecast, by Application 2019 & 2032
- Table 36: Global Protective Cultures Industry Revenue Million Forecast, by Country 2019 & 2032
- Table 37: United States Protective Cultures Industry Revenue (Million) Forecast, by Application 2019 & 2032
- Table 38: Canada Protective Cultures Industry Revenue (Million) Forecast, by Application 2019 & 2032
- Table 39: Mexico Protective Cultures Industry Revenue (Million) Forecast, by Application 2019 & 2032
- Table 40: Rest of North America Protective Cultures Industry Revenue (Million) Forecast, by Application 2019 & 2032
- Table 41: Global Protective Cultures Industry Revenue Million Forecast, by Form 2019 & 2032
- Table 42: Global Protective Cultures Industry Revenue Million Forecast, by Microorganism Type 2019 & 2032
- Table 43: Global Protective Cultures Industry Revenue Million Forecast, by Application 2019 & 2032
- Table 44: Global Protective Cultures Industry Revenue Million Forecast, by Country 2019 & 2032
- Table 45: United Kingdom Protective Cultures Industry Revenue (Million) Forecast, by Application 2019 & 2032
- Table 46: Germany Protective Cultures Industry Revenue (Million) Forecast, by Application 2019 & 2032
- Table 47: Spain Protective Cultures Industry Revenue (Million) Forecast, by Application 2019 & 2032
- Table 48: France Protective Cultures Industry Revenue (Million) Forecast, by Application 2019 & 2032
- Table 49: Italy Protective Cultures Industry Revenue (Million) Forecast, by Application 2019 & 2032
- Table 50: Rest of Europe Protective Cultures Industry Revenue (Million) Forecast, by Application 2019 & 2032
- Table 51: Global Protective Cultures Industry Revenue Million Forecast, by Form 2019 & 2032
- Table 52: Global Protective Cultures Industry Revenue Million Forecast, by Microorganism Type 2019 & 2032
- Table 53: Global Protective Cultures Industry Revenue Million Forecast, by Application 2019 & 2032
- Table 54: Global Protective Cultures Industry Revenue Million Forecast, by Country 2019 & 2032
- Table 55: China Protective Cultures Industry Revenue (Million) Forecast, by Application 2019 & 2032
- Table 56: Japan Protective Cultures Industry Revenue (Million) Forecast, by Application 2019 & 2032
- Table 57: India Protective Cultures Industry Revenue (Million) Forecast, by Application 2019 & 2032
- Table 58: Australia Protective Cultures Industry Revenue (Million) Forecast, by Application 2019 & 2032
- Table 59: Rest of Asia Pacific Protective Cultures Industry Revenue (Million) Forecast, by Application 2019 & 2032
- Table 60: Global Protective Cultures Industry Revenue Million Forecast, by Form 2019 & 2032
- Table 61: Global Protective Cultures Industry Revenue Million Forecast, by Microorganism Type 2019 & 2032
- Table 62: Global Protective Cultures Industry Revenue Million Forecast, by Application 2019 & 2032
- Table 63: Global Protective Cultures Industry Revenue Million Forecast, by Country 2019 & 2032
- Table 64: Brazil Protective Cultures Industry Revenue (Million) Forecast, by Application 2019 & 2032
- Table 65: Argentina Protective Cultures Industry Revenue (Million) Forecast, by Application 2019 & 2032
- Table 66: Rest of South America Protective Cultures Industry Revenue (Million) Forecast, by Application 2019 & 2032
- Table 67: Global Protective Cultures Industry Revenue Million Forecast, by Form 2019 & 2032
- Table 68: Global Protective Cultures Industry Revenue Million Forecast, by Microorganism Type 2019 & 2032
- Table 69: Global Protective Cultures Industry Revenue Million Forecast, by Application 2019 & 2032
- Table 70: Global Protective Cultures Industry Revenue Million Forecast, by Country 2019 & 2032
- Table 71: Global Protective Cultures Industry Revenue Million Forecast, by Form 2019 & 2032
- Table 72: Global Protective Cultures Industry Revenue Million Forecast, by Microorganism Type 2019 & 2032
- Table 73: Global Protective Cultures Industry Revenue Million Forecast, by Application 2019 & 2032
- Table 74: Global Protective Cultures Industry Revenue Million Forecast, by Country 2019 & 2032
- Table 75: South Africa Protective Cultures Industry Revenue (Million) Forecast, by Application 2019 & 2032
- Table 76: Rest of Middle East Protective Cultures Industry Revenue (Million) Forecast, by Application 2019 & 2032
Frequently Asked Questions
1. What is the projected Compound Annual Growth Rate (CAGR) of the Protective Cultures Industry?
The projected CAGR is approximately 10.11%.
2. Which companies are prominent players in the Protective Cultures Industry?
Key companies in the market include CSK Food Enrichment B V, Dupont, Meat Cracks Technologie GmbH, Bioprox Ingredients, Soyuzsnab Group of Companies*List Not Exhaustive, DSM Nutritional Products, Dalton Biotechnologies S R L, Biochem S R L, Aristomenis D Phikas & Co S A, Sacco S R L, THT S A, Chr Hansen.
3. What are the main segments of the Protective Cultures Industry?
The market segments include Form, Microorganism Type, Application.
4. Can you provide details about the market size?
The market size is estimated to be USD XX Million as of 2022.
5. What are some drivers contributing to market growth?
Rising Health Consciousness among consumer.
6. What are the notable trends driving market growth?
Increasing Consumption of Dairy Products.
7. Are there any restraints impacting market growth?
High Cost of natural Ingredients.
8. Can you provide examples of recent developments in the market?
In November 2018, DSM expanded its Delvo Guard protective cultures to reinforce safety standards for clean label products. The culture is designed to prevent the formation of yeasts & molds in dairy products to extend the shelf life of products without any effect on the taste and texture
9. What pricing options are available for accessing the report?
Pricing options include single-user, multi-user, and enterprise licenses priced at USD 4750, USD 5250, and USD 8750 respectively.
10. Is the market size provided in terms of value or volume?
The market size is provided in terms of value, measured in Million.
11. Are there any specific market keywords associated with the report?
Yes, the market keyword associated with the report is "Protective Cultures Industry," which aids in identifying and referencing the specific market segment covered.
12. How do I determine which pricing option suits my needs best?
The pricing options vary based on user requirements and access needs. Individual users may opt for single-user licenses, while businesses requiring broader access may choose multi-user or enterprise licenses for cost-effective access to the report.
13. Are there any additional resources or data provided in the Protective Cultures Industry report?
While the report offers comprehensive insights, it's advisable to review the specific contents or supplementary materials provided to ascertain if additional resources or data are available.
14. How can I stay updated on further developments or reports in the Protective Cultures Industry?
To stay informed about further developments, trends, and reports in the Protective Cultures Industry, consider subscribing to industry newsletters, following relevant companies and organizations, or regularly checking reputable industry news sources and publications.
Methodology
Step 1 - Identification of Relevant Samples Size from Population Database


Step 2 - Approaches for Defining Global Market Size (Value, Volume* & Price*)

Note*: In applicable scenarios
Step 3 - Data Sources
Primary Research
- Web Analytics
- Survey Reports
- Research Institute
- Latest Research Reports
- Opinion Leaders
Secondary Research
- Annual Reports
- White Paper
- Latest Press Release
- Industry Association
- Paid Database
- Investor Presentations

Step 4 - Data Triangulation
Involves using different sources of information in order to increase the validity of a study
These sources are likely to be stakeholders in a program - participants, other researchers, program staff, other community members, and so on.
Then we put all data in single framework & apply various statistical tools to find out the dynamic on the market.
During the analysis stage, feedback from the stakeholder groups would be compared to determine areas of agreement as well as areas of divergence


