
Key Insights
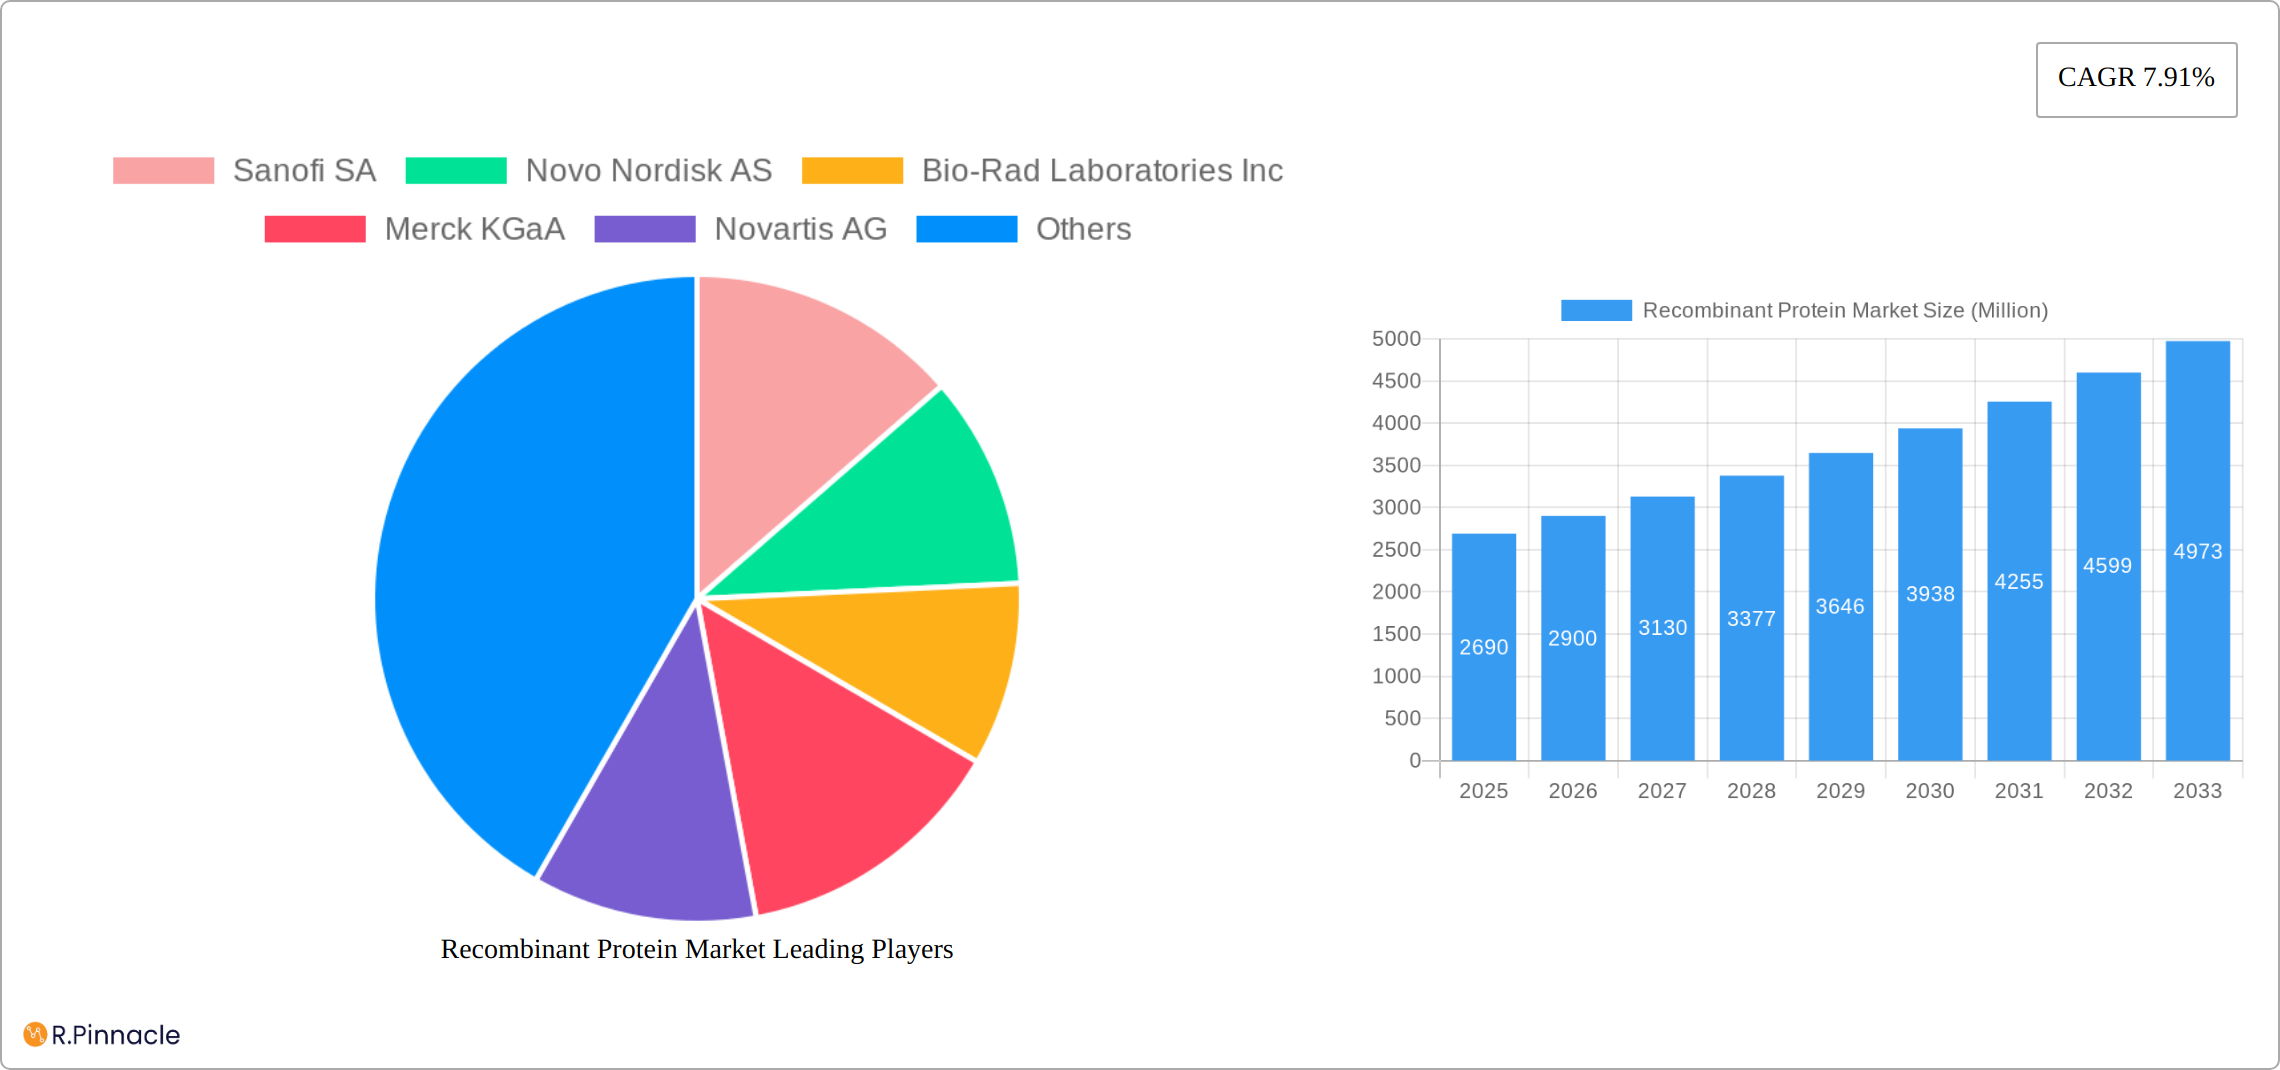
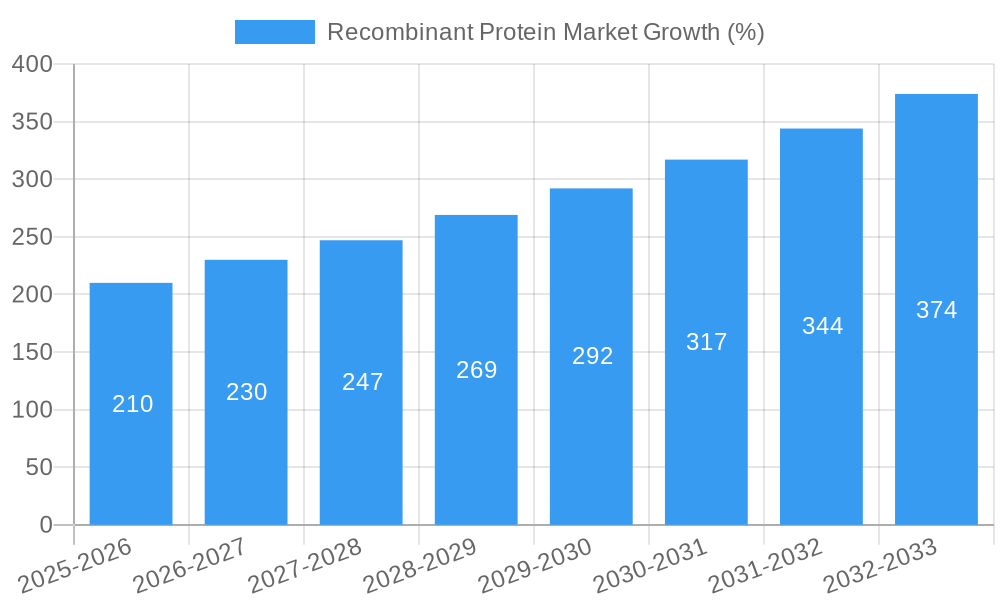
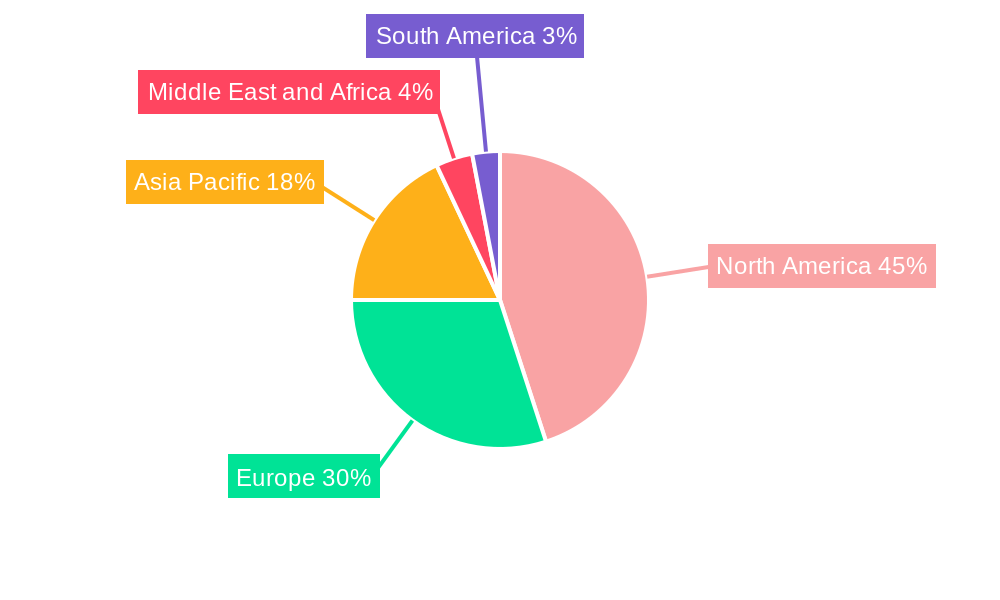
The Recombinant Protein market, valued at $2.69 billion in 2025, is projected to experience robust growth, driven by a Compound Annual Growth Rate (CAGR) of 7.91% from 2025 to 2033. This expansion is fueled by several key factors. The burgeoning biotechnology and pharmaceutical industries are significantly increasing demand for recombinant proteins in research and therapeutic applications. Advances in genetic engineering and protein production technologies are leading to more efficient and cost-effective manufacturing processes, further stimulating market growth. The rising prevalence of chronic diseases like cancer and diabetes, necessitating innovative therapies, is another significant driver. Increased investments in research and development by major pharmaceutical companies are also contributing to market expansion. While challenges such as stringent regulatory approvals and high production costs might pose some restraints, the overall market outlook remains positive, particularly within the therapeutic use segment which is expected to witness significant growth due to increasing adoption of biologics. The market is segmented by product type (hormones, growth factors, antibodies, enzymes, and other products) and application (research, therapeutics, and biotechnology). North America currently holds a significant market share, driven by a well-established biotechnology sector and high healthcare spending, followed by Europe and Asia Pacific.
Growth across different geographical segments will vary. While North America and Europe are likely to maintain their leading positions due to strong regulatory frameworks and established healthcare infrastructure, the Asia Pacific region is poised for significant growth due to rising healthcare expenditure and increasing awareness about advanced therapies. Competition in the market is intense, with major players such as Sanofi SA, Novo Nordisk AS, Bio-Rad Laboratories Inc., Merck KGaA, and others actively involved in research, development, and commercialization of various recombinant proteins. Strategic partnerships, mergers and acquisitions, and technological advancements are anticipated to shape the competitive landscape further in the coming years, potentially leading to increased market consolidation.
This comprehensive report provides a detailed analysis of the Recombinant Protein Market, offering actionable insights for industry professionals and investors. Covering the period from 2019 to 2033, with a focus on 2025, this report dissects market dynamics, competitive landscapes, and future growth potential. The report leverages extensive data analysis to project a robust forecast from 2025 to 2033.
Recombinant Protein Market Market Structure & Innovation Trends
The Recombinant Protein market exhibits a moderately concentrated structure, with key players holding significant market share. The market is driven by continuous innovation in protein engineering, advancements in production technologies (e.g., cell culture, fermentation), and the growing demand for biopharmaceuticals. Regulatory frameworks, such as those set by the FDA and EMA, significantly influence market operations. Product substitutes, primarily based on chemically synthesized alternatives, exert moderate competitive pressure. The end-user demographics are diverse, encompassing research institutions, pharmaceutical companies, and biotechnology firms. Significant M&A activity has shaped the market landscape, with deal values exceeding xx Million in the past five years. For example, the acquisition of Albumedix Ltd. by Sartorius StedimBiotech in September 2022 highlights the strategic importance of recombinant albumin-based solutions.
- Market Concentration: Moderately concentrated, with top 5 players holding approximately xx% market share (2024).
- Innovation Drivers: Advanced protein engineering, novel production technologies, growing biopharmaceutical demand.
- Regulatory Landscape: Stringent regulations from FDA, EMA, and other regulatory bodies.
- M&A Activity: Significant activity with deal values exceeding xx Million in recent years.
Recombinant Protein Market Market Dynamics & Trends
The Recombinant Protein market is experiencing robust growth, fueled by a confluence of factors. The increasing prevalence of chronic diseases globally, coupled with a rising demand for personalized medicine and the expanding therapeutic applications of recombinant proteins across diverse areas, are key drivers. This growth is further accelerated by significant technological advancements, including CRISPR-Cas9 gene editing and sophisticated cell culture techniques, enabling the production of more effective and targeted therapies. Consumer preferences are demonstrably shifting towards safer, more efficacious, and personalized biotherapeutics, creating a strong market pull. While the market is highly competitive, with established players and emerging biotech companies vying for market share, this competition also drives innovation and potentially leads to price pressures. Analysts project a Compound Annual Growth Rate (CAGR) of [Insert Updated CAGR]% from 2025 to 2033, resulting in a market size of [Insert Updated Market Size] Million by 2033. Market penetration is already substantial in developed regions but holds significant growth potential in emerging markets, presenting lucrative opportunities for expansion.
Dominant Regions & Segments in Recombinant Protein Market
North America currently commands the largest market share within the Recombinant Protein market, primarily due to substantial R&D investments, a sophisticated healthcare infrastructure, and a high prevalence of chronic diseases. Analyzing the product segments reveals that Antibodies hold the dominant position, followed by Hormones and Growth Factors. In terms of applications, Therapeutic use constitutes the largest segment, driven by the escalating demand for effective biopharmaceuticals to combat chronic illnesses. This strong demand is further amplified by the aging global population and the increasing incidence of age-related diseases.
Leading Region: North America
Key Drivers for North America: Robust R&D investments, advanced healthcare infrastructure, high prevalence of chronic diseases, and a strong regulatory framework supporting innovation.
Leading Product Segment: Antibodies, owing to their high efficacy, versatility, and established track record in various therapeutic areas.
Leading Application Segment: Therapeutic Use, fueled by the rising prevalence of chronic diseases and the continuous development of novel biopharmaceuticals.
Europe: A significant market with a strong regulatory environment and a considerable presence of major pharmaceutical and biotechnology companies driving innovation and competition.
Asia-Pacific: Demonstrating rapid growth driven by increasing healthcare spending, a burgeoning biopharmaceutical industry, and a growing awareness of the benefits of advanced therapies.
Recombinant Protein Market Product Innovations
The Recombinant Protein market is characterized by continuous innovation. Recent advancements include the development of next-generation biosimilars with enhanced efficacy and safety profiles, and the emergence of novel recombinant protein therapeutics targeting previously intractable diseases. These innovations leverage advancements in protein engineering and production technologies, allowing for the creation of highly specialized and effective treatments. The market fit for these new products is excellent, largely driven by unmet medical needs and the pursuit of improved patient outcomes. Furthermore, the development of more efficient and cost-effective production methods is continually improving the accessibility and affordability of these life-saving therapies.
Report Scope & Segmentation Analysis
This report comprehensively segments the Recombinant Protein Market by product type (Hormone, Growth Factor, Antibody, Enzyme, Other Types of Products) and application (Research Application, Therapeutic Use, Biotechnology Industry). Each segment is analyzed in detail, providing insights into market size, growth projections, and competitive dynamics. The Antibody segment is expected to witness the highest growth rate, driven by the increasing demand for targeted therapies. The Therapeutic Use application segment is poised to dominate the market, owing to the rise in chronic diseases and increased adoption of biopharmaceuticals.
- Product: Each product type is analyzed based on market size, growth projections, and competitive intensity.
- Application: Each application segment provides insights into market drivers, growth potential, and key players.
Key Drivers of Recombinant Protein Market Growth
The Recombinant Protein market's growth is driven by several key factors, including the increasing prevalence of chronic diseases like cancer and diabetes, the growing demand for personalized medicine, advancements in protein engineering and production technologies, and substantial investments in R&D by both large pharmaceutical companies and innovative biotech startups. Favorable regulatory frameworks also support market expansion. The rising adoption of recombinant proteins in biosimilar development further propels market growth.
Challenges in the Recombinant Protein Market Sector
Despite the significant growth potential, the Recombinant Protein market faces several challenges. Stringent regulatory approvals, the high cost of research, development, and manufacturing, and intense competition among market players can all impede growth and profitability. Potential supply chain disruptions and the inherent complexity of manufacturing processes also contribute to increased costs and potential production delays. Overcoming these challenges through strategic partnerships and innovative manufacturing techniques will be crucial for sustainable market expansion.
Emerging Opportunities in Recombinant Protein Market
Emerging opportunities lie in the development of novel recombinant protein therapies targeting orphan diseases and unmet medical needs, expansion into emerging markets with growing healthcare expenditure, and the utilization of advanced technologies like AI and machine learning to accelerate drug discovery and development. The development of biosimilars also presents a significant opportunity for market expansion.
Leading Players in the Recombinant Protein Market Market
- Sanofi SA
- Novo Nordisk AS
- Bio-Rad Laboratories Inc
- Merck KGaA
- Novartis AG
- Amgen Inc
- Thermo Fisher Scientific Inc
- Eli Lilly and Company
- Abbvie Inc
- Novavax Inc
- Pfizer Inc
- GlaxoSmithKline PLC
Key Developments in Recombinant Protein Market Industry
- September 2022: Sartorius StedimBiotech acquired Albumedix Ltd., strengthening its position in recombinant albumin-based solutions. This acquisition expands Sartorius's portfolio and market reach within the recombinant protein market.
- September 2022: Attralus, Inc. released preclinical data for AT-02, a pan-amyloid removal therapeutic candidate showing promising results in reducing cardiac amyloid deposits. This development highlights the ongoing innovation in the therapeutic applications of recombinant proteins.
Future Outlook for Recombinant Protein Market Market
The future outlook for the Recombinant Protein market remains exceptionally positive. Continued technological advancements, a growing global demand for innovative therapies, and increasing investments in research and development are all expected to drive substantial market growth. Strategic partnerships and collaborations between pharmaceutical companies and biotechnology firms will play a crucial role in accelerating this expansion. The focus on personalized medicine and the continued development and adoption of biosimilars will create significant opportunities for market expansion in the years to come. The market's long-term trajectory is predicted to be one of sustained growth, driven by an ongoing commitment to innovation and the urgent need for effective treatments for a wide range of debilitating diseases.
Recombinant Protein Market Segmentation
-
1. Product
- 1.1. Hormone
- 1.2. Growth Factor
- 1.3. Antibody
- 1.4. Enzyme
- 1.5. Other Types of Products
-
2. Application
- 2.1. Research Application
- 2.2. Therapeutic Use
- 2.3. Biotechnology Industry
Recombinant Protein Market Segmentation By Geography
-
1. North America
- 1.1. United States
- 1.2. Canada
- 1.3. Mexico
-
2. Europe
- 2.1. Germany
- 2.2. United Kingdom
- 2.3. France
- 2.4. Italy
- 2.5. Spain
- 2.6. Rest of Europe
-
3. Asia Pacific
- 3.1. China
- 3.2. Japan
- 3.3. India
- 3.4. Australia
- 3.5. South Korea
- 3.6. Rest of Asia Pacific
-
4. Middle East and Africa
- 4.1. GCC
- 4.2. South Africa
- 4.3. Rest of Middle East and Africa
-
5. South America
- 5.1. Brazil
- 5.2. Argentina
- 5.3. Rest of South America
Recombinant Protein Market REPORT HIGHLIGHTS
| Aspects | Details |
|---|---|
| Study Period | 2019-2033 |
| Base Year | 2024 |
| Estimated Year | 2025 |
| Forecast Period | 2025-2033 |
| Historical Period | 2019-2024 |
| Growth Rate | CAGR of 7.91% from 2019-2033 |
| Segmentation |
|
Table of Contents
- 1. Introduction
- 1.1. Research Scope
- 1.2. Market Segmentation
- 1.3. Research Methodology
- 1.4. Definitions and Assumptions
- 2. Executive Summary
- 2.1. Introduction
- 3. Market Dynamics
- 3.1. Introduction
- 3.2. Market Drivers
- 3.2.1. Increasing Expenditure on Research and Development; Growing Burden of Chronic Diseases; Rising Inclination toward Biologics and Biosimilars; Technological Advancements in Recombinant Products
- 3.3. Market Restrains
- 3.3.1. Expensive and Time-consuming Production Process
- 3.4. Market Trends
- 3.4.1. Antibody Segment is Expected to Witness a Significant Growth Over the Forecast Period.
- 4. Market Factor Analysis
- 4.1. Porters Five Forces
- 4.2. Supply/Value Chain
- 4.3. PESTEL analysis
- 4.4. Market Entropy
- 4.5. Patent/Trademark Analysis
- 5. Global Recombinant Protein Market Analysis, Insights and Forecast, 2019-2031
- 5.1. Market Analysis, Insights and Forecast - by Product
- 5.1.1. Hormone
- 5.1.2. Growth Factor
- 5.1.3. Antibody
- 5.1.4. Enzyme
- 5.1.5. Other Types of Products
- 5.2. Market Analysis, Insights and Forecast - by Application
- 5.2.1. Research Application
- 5.2.2. Therapeutic Use
- 5.2.3. Biotechnology Industry
- 5.3. Market Analysis, Insights and Forecast - by Region
- 5.3.1. North America
- 5.3.2. Europe
- 5.3.3. Asia Pacific
- 5.3.4. Middle East and Africa
- 5.3.5. South America
- 5.1. Market Analysis, Insights and Forecast - by Product
- 6. North America Recombinant Protein Market Analysis, Insights and Forecast, 2019-2031
- 6.1. Market Analysis, Insights and Forecast - by Product
- 6.1.1. Hormone
- 6.1.2. Growth Factor
- 6.1.3. Antibody
- 6.1.4. Enzyme
- 6.1.5. Other Types of Products
- 6.2. Market Analysis, Insights and Forecast - by Application
- 6.2.1. Research Application
- 6.2.2. Therapeutic Use
- 6.2.3. Biotechnology Industry
- 6.1. Market Analysis, Insights and Forecast - by Product
- 7. Europe Recombinant Protein Market Analysis, Insights and Forecast, 2019-2031
- 7.1. Market Analysis, Insights and Forecast - by Product
- 7.1.1. Hormone
- 7.1.2. Growth Factor
- 7.1.3. Antibody
- 7.1.4. Enzyme
- 7.1.5. Other Types of Products
- 7.2. Market Analysis, Insights and Forecast - by Application
- 7.2.1. Research Application
- 7.2.2. Therapeutic Use
- 7.2.3. Biotechnology Industry
- 7.1. Market Analysis, Insights and Forecast - by Product
- 8. Asia Pacific Recombinant Protein Market Analysis, Insights and Forecast, 2019-2031
- 8.1. Market Analysis, Insights and Forecast - by Product
- 8.1.1. Hormone
- 8.1.2. Growth Factor
- 8.1.3. Antibody
- 8.1.4. Enzyme
- 8.1.5. Other Types of Products
- 8.2. Market Analysis, Insights and Forecast - by Application
- 8.2.1. Research Application
- 8.2.2. Therapeutic Use
- 8.2.3. Biotechnology Industry
- 8.1. Market Analysis, Insights and Forecast - by Product
- 9. Middle East and Africa Recombinant Protein Market Analysis, Insights and Forecast, 2019-2031
- 9.1. Market Analysis, Insights and Forecast - by Product
- 9.1.1. Hormone
- 9.1.2. Growth Factor
- 9.1.3. Antibody
- 9.1.4. Enzyme
- 9.1.5. Other Types of Products
- 9.2. Market Analysis, Insights and Forecast - by Application
- 9.2.1. Research Application
- 9.2.2. Therapeutic Use
- 9.2.3. Biotechnology Industry
- 9.1. Market Analysis, Insights and Forecast - by Product
- 10. South America Recombinant Protein Market Analysis, Insights and Forecast, 2019-2031
- 10.1. Market Analysis, Insights and Forecast - by Product
- 10.1.1. Hormone
- 10.1.2. Growth Factor
- 10.1.3. Antibody
- 10.1.4. Enzyme
- 10.1.5. Other Types of Products
- 10.2. Market Analysis, Insights and Forecast - by Application
- 10.2.1. Research Application
- 10.2.2. Therapeutic Use
- 10.2.3. Biotechnology Industry
- 10.1. Market Analysis, Insights and Forecast - by Product
- 11. North America Recombinant Protein Market Analysis, Insights and Forecast, 2019-2031
- 11.1. Market Analysis, Insights and Forecast - By Country/Sub-region
- 11.1.1 United States
- 11.1.2 Canada
- 11.1.3 Mexico
- 12. Europe Recombinant Protein Market Analysis, Insights and Forecast, 2019-2031
- 12.1. Market Analysis, Insights and Forecast - By Country/Sub-region
- 12.1.1 Germany
- 12.1.2 United Kingdom
- 12.1.3 France
- 12.1.4 Italy
- 12.1.5 Spain
- 12.1.6 Rest of Europe
- 13. Asia Pacific Recombinant Protein Market Analysis, Insights and Forecast, 2019-2031
- 13.1. Market Analysis, Insights and Forecast - By Country/Sub-region
- 13.1.1 China
- 13.1.2 Japan
- 13.1.3 India
- 13.1.4 Australia
- 13.1.5 South Korea
- 13.1.6 Rest of Asia Pacific
- 14. Middle East and Africa Recombinant Protein Market Analysis, Insights and Forecast, 2019-2031
- 14.1. Market Analysis, Insights and Forecast - By Country/Sub-region
- 14.1.1 GCC
- 14.1.2 South Africa
- 14.1.3 Rest of Middle East and Africa
- 15. South America Recombinant Protein Market Analysis, Insights and Forecast, 2019-2031
- 15.1. Market Analysis, Insights and Forecast - By Country/Sub-region
- 15.1.1 Brazil
- 15.1.2 Argentina
- 15.1.3 Rest of South America
- 16. Competitive Analysis
- 16.1. Global Market Share Analysis 2024
- 16.2. Company Profiles
- 16.2.1 Sanofi SA
- 16.2.1.1. Overview
- 16.2.1.2. Products
- 16.2.1.3. SWOT Analysis
- 16.2.1.4. Recent Developments
- 16.2.1.5. Financials (Based on Availability)
- 16.2.2 Novo Nordisk AS
- 16.2.2.1. Overview
- 16.2.2.2. Products
- 16.2.2.3. SWOT Analysis
- 16.2.2.4. Recent Developments
- 16.2.2.5. Financials (Based on Availability)
- 16.2.3 Bio-Rad Laboratories Inc
- 16.2.3.1. Overview
- 16.2.3.2. Products
- 16.2.3.3. SWOT Analysis
- 16.2.3.4. Recent Developments
- 16.2.3.5. Financials (Based on Availability)
- 16.2.4 Merck KGaA
- 16.2.4.1. Overview
- 16.2.4.2. Products
- 16.2.4.3. SWOT Analysis
- 16.2.4.4. Recent Developments
- 16.2.4.5. Financials (Based on Availability)
- 16.2.5 Novartis AG
- 16.2.5.1. Overview
- 16.2.5.2. Products
- 16.2.5.3. SWOT Analysis
- 16.2.5.4. Recent Developments
- 16.2.5.5. Financials (Based on Availability)
- 16.2.6 Amgen Inc
- 16.2.6.1. Overview
- 16.2.6.2. Products
- 16.2.6.3. SWOT Analysis
- 16.2.6.4. Recent Developments
- 16.2.6.5. Financials (Based on Availability)
- 16.2.7 Thermo Fisher Scientific Inc
- 16.2.7.1. Overview
- 16.2.7.2. Products
- 16.2.7.3. SWOT Analysis
- 16.2.7.4. Recent Developments
- 16.2.7.5. Financials (Based on Availability)
- 16.2.8 Eli Lilly and Company
- 16.2.8.1. Overview
- 16.2.8.2. Products
- 16.2.8.3. SWOT Analysis
- 16.2.8.4. Recent Developments
- 16.2.8.5. Financials (Based on Availability)
- 16.2.9 Abbvie Inc
- 16.2.9.1. Overview
- 16.2.9.2. Products
- 16.2.9.3. SWOT Analysis
- 16.2.9.4. Recent Developments
- 16.2.9.5. Financials (Based on Availability)
- 16.2.10 Novavax Inc
- 16.2.10.1. Overview
- 16.2.10.2. Products
- 16.2.10.3. SWOT Analysis
- 16.2.10.4. Recent Developments
- 16.2.10.5. Financials (Based on Availability)
- 16.2.11 Pfizer Inc
- 16.2.11.1. Overview
- 16.2.11.2. Products
- 16.2.11.3. SWOT Analysis
- 16.2.11.4. Recent Developments
- 16.2.11.5. Financials (Based on Availability)
- 16.2.12 GlaxoSmithKline PLC
- 16.2.12.1. Overview
- 16.2.12.2. Products
- 16.2.12.3. SWOT Analysis
- 16.2.12.4. Recent Developments
- 16.2.12.5. Financials (Based on Availability)
- 16.2.1 Sanofi SA
List of Figures
- Figure 1: Global Recombinant Protein Market Revenue Breakdown (Million, %) by Region 2024 & 2032
- Figure 2: Global Recombinant Protein Market Volume Breakdown (K Unit, %) by Region 2024 & 2032
- Figure 3: North America Recombinant Protein Market Revenue (Million), by Country 2024 & 2032
- Figure 4: North America Recombinant Protein Market Volume (K Unit), by Country 2024 & 2032
- Figure 5: North America Recombinant Protein Market Revenue Share (%), by Country 2024 & 2032
- Figure 6: North America Recombinant Protein Market Volume Share (%), by Country 2024 & 2032
- Figure 7: Europe Recombinant Protein Market Revenue (Million), by Country 2024 & 2032
- Figure 8: Europe Recombinant Protein Market Volume (K Unit), by Country 2024 & 2032
- Figure 9: Europe Recombinant Protein Market Revenue Share (%), by Country 2024 & 2032
- Figure 10: Europe Recombinant Protein Market Volume Share (%), by Country 2024 & 2032
- Figure 11: Asia Pacific Recombinant Protein Market Revenue (Million), by Country 2024 & 2032
- Figure 12: Asia Pacific Recombinant Protein Market Volume (K Unit), by Country 2024 & 2032
- Figure 13: Asia Pacific Recombinant Protein Market Revenue Share (%), by Country 2024 & 2032
- Figure 14: Asia Pacific Recombinant Protein Market Volume Share (%), by Country 2024 & 2032
- Figure 15: Middle East and Africa Recombinant Protein Market Revenue (Million), by Country 2024 & 2032
- Figure 16: Middle East and Africa Recombinant Protein Market Volume (K Unit), by Country 2024 & 2032
- Figure 17: Middle East and Africa Recombinant Protein Market Revenue Share (%), by Country 2024 & 2032
- Figure 18: Middle East and Africa Recombinant Protein Market Volume Share (%), by Country 2024 & 2032
- Figure 19: South America Recombinant Protein Market Revenue (Million), by Country 2024 & 2032
- Figure 20: South America Recombinant Protein Market Volume (K Unit), by Country 2024 & 2032
- Figure 21: South America Recombinant Protein Market Revenue Share (%), by Country 2024 & 2032
- Figure 22: South America Recombinant Protein Market Volume Share (%), by Country 2024 & 2032
- Figure 23: North America Recombinant Protein Market Revenue (Million), by Product 2024 & 2032
- Figure 24: North America Recombinant Protein Market Volume (K Unit), by Product 2024 & 2032
- Figure 25: North America Recombinant Protein Market Revenue Share (%), by Product 2024 & 2032
- Figure 26: North America Recombinant Protein Market Volume Share (%), by Product 2024 & 2032
- Figure 27: North America Recombinant Protein Market Revenue (Million), by Application 2024 & 2032
- Figure 28: North America Recombinant Protein Market Volume (K Unit), by Application 2024 & 2032
- Figure 29: North America Recombinant Protein Market Revenue Share (%), by Application 2024 & 2032
- Figure 30: North America Recombinant Protein Market Volume Share (%), by Application 2024 & 2032
- Figure 31: North America Recombinant Protein Market Revenue (Million), by Country 2024 & 2032
- Figure 32: North America Recombinant Protein Market Volume (K Unit), by Country 2024 & 2032
- Figure 33: North America Recombinant Protein Market Revenue Share (%), by Country 2024 & 2032
- Figure 34: North America Recombinant Protein Market Volume Share (%), by Country 2024 & 2032
- Figure 35: Europe Recombinant Protein Market Revenue (Million), by Product 2024 & 2032
- Figure 36: Europe Recombinant Protein Market Volume (K Unit), by Product 2024 & 2032
- Figure 37: Europe Recombinant Protein Market Revenue Share (%), by Product 2024 & 2032
- Figure 38: Europe Recombinant Protein Market Volume Share (%), by Product 2024 & 2032
- Figure 39: Europe Recombinant Protein Market Revenue (Million), by Application 2024 & 2032
- Figure 40: Europe Recombinant Protein Market Volume (K Unit), by Application 2024 & 2032
- Figure 41: Europe Recombinant Protein Market Revenue Share (%), by Application 2024 & 2032
- Figure 42: Europe Recombinant Protein Market Volume Share (%), by Application 2024 & 2032
- Figure 43: Europe Recombinant Protein Market Revenue (Million), by Country 2024 & 2032
- Figure 44: Europe Recombinant Protein Market Volume (K Unit), by Country 2024 & 2032
- Figure 45: Europe Recombinant Protein Market Revenue Share (%), by Country 2024 & 2032
- Figure 46: Europe Recombinant Protein Market Volume Share (%), by Country 2024 & 2032
- Figure 47: Asia Pacific Recombinant Protein Market Revenue (Million), by Product 2024 & 2032
- Figure 48: Asia Pacific Recombinant Protein Market Volume (K Unit), by Product 2024 & 2032
- Figure 49: Asia Pacific Recombinant Protein Market Revenue Share (%), by Product 2024 & 2032
- Figure 50: Asia Pacific Recombinant Protein Market Volume Share (%), by Product 2024 & 2032
- Figure 51: Asia Pacific Recombinant Protein Market Revenue (Million), by Application 2024 & 2032
- Figure 52: Asia Pacific Recombinant Protein Market Volume (K Unit), by Application 2024 & 2032
- Figure 53: Asia Pacific Recombinant Protein Market Revenue Share (%), by Application 2024 & 2032
- Figure 54: Asia Pacific Recombinant Protein Market Volume Share (%), by Application 2024 & 2032
- Figure 55: Asia Pacific Recombinant Protein Market Revenue (Million), by Country 2024 & 2032
- Figure 56: Asia Pacific Recombinant Protein Market Volume (K Unit), by Country 2024 & 2032
- Figure 57: Asia Pacific Recombinant Protein Market Revenue Share (%), by Country 2024 & 2032
- Figure 58: Asia Pacific Recombinant Protein Market Volume Share (%), by Country 2024 & 2032
- Figure 59: Middle East and Africa Recombinant Protein Market Revenue (Million), by Product 2024 & 2032
- Figure 60: Middle East and Africa Recombinant Protein Market Volume (K Unit), by Product 2024 & 2032
- Figure 61: Middle East and Africa Recombinant Protein Market Revenue Share (%), by Product 2024 & 2032
- Figure 62: Middle East and Africa Recombinant Protein Market Volume Share (%), by Product 2024 & 2032
- Figure 63: Middle East and Africa Recombinant Protein Market Revenue (Million), by Application 2024 & 2032
- Figure 64: Middle East and Africa Recombinant Protein Market Volume (K Unit), by Application 2024 & 2032
- Figure 65: Middle East and Africa Recombinant Protein Market Revenue Share (%), by Application 2024 & 2032
- Figure 66: Middle East and Africa Recombinant Protein Market Volume Share (%), by Application 2024 & 2032
- Figure 67: Middle East and Africa Recombinant Protein Market Revenue (Million), by Country 2024 & 2032
- Figure 68: Middle East and Africa Recombinant Protein Market Volume (K Unit), by Country 2024 & 2032
- Figure 69: Middle East and Africa Recombinant Protein Market Revenue Share (%), by Country 2024 & 2032
- Figure 70: Middle East and Africa Recombinant Protein Market Volume Share (%), by Country 2024 & 2032
- Figure 71: South America Recombinant Protein Market Revenue (Million), by Product 2024 & 2032
- Figure 72: South America Recombinant Protein Market Volume (K Unit), by Product 2024 & 2032
- Figure 73: South America Recombinant Protein Market Revenue Share (%), by Product 2024 & 2032
- Figure 74: South America Recombinant Protein Market Volume Share (%), by Product 2024 & 2032
- Figure 75: South America Recombinant Protein Market Revenue (Million), by Application 2024 & 2032
- Figure 76: South America Recombinant Protein Market Volume (K Unit), by Application 2024 & 2032
- Figure 77: South America Recombinant Protein Market Revenue Share (%), by Application 2024 & 2032
- Figure 78: South America Recombinant Protein Market Volume Share (%), by Application 2024 & 2032
- Figure 79: South America Recombinant Protein Market Revenue (Million), by Country 2024 & 2032
- Figure 80: South America Recombinant Protein Market Volume (K Unit), by Country 2024 & 2032
- Figure 81: South America Recombinant Protein Market Revenue Share (%), by Country 2024 & 2032
- Figure 82: South America Recombinant Protein Market Volume Share (%), by Country 2024 & 2032
List of Tables
- Table 1: Global Recombinant Protein Market Revenue Million Forecast, by Region 2019 & 2032
- Table 2: Global Recombinant Protein Market Volume K Unit Forecast, by Region 2019 & 2032
- Table 3: Global Recombinant Protein Market Revenue Million Forecast, by Product 2019 & 2032
- Table 4: Global Recombinant Protein Market Volume K Unit Forecast, by Product 2019 & 2032
- Table 5: Global Recombinant Protein Market Revenue Million Forecast, by Application 2019 & 2032
- Table 6: Global Recombinant Protein Market Volume K Unit Forecast, by Application 2019 & 2032
- Table 7: Global Recombinant Protein Market Revenue Million Forecast, by Region 2019 & 2032
- Table 8: Global Recombinant Protein Market Volume K Unit Forecast, by Region 2019 & 2032
- Table 9: Global Recombinant Protein Market Revenue Million Forecast, by Country 2019 & 2032
- Table 10: Global Recombinant Protein Market Volume K Unit Forecast, by Country 2019 & 2032
- Table 11: United States Recombinant Protein Market Revenue (Million) Forecast, by Application 2019 & 2032
- Table 12: United States Recombinant Protein Market Volume (K Unit) Forecast, by Application 2019 & 2032
- Table 13: Canada Recombinant Protein Market Revenue (Million) Forecast, by Application 2019 & 2032
- Table 14: Canada Recombinant Protein Market Volume (K Unit) Forecast, by Application 2019 & 2032
- Table 15: Mexico Recombinant Protein Market Revenue (Million) Forecast, by Application 2019 & 2032
- Table 16: Mexico Recombinant Protein Market Volume (K Unit) Forecast, by Application 2019 & 2032
- Table 17: Global Recombinant Protein Market Revenue Million Forecast, by Country 2019 & 2032
- Table 18: Global Recombinant Protein Market Volume K Unit Forecast, by Country 2019 & 2032
- Table 19: Germany Recombinant Protein Market Revenue (Million) Forecast, by Application 2019 & 2032
- Table 20: Germany Recombinant Protein Market Volume (K Unit) Forecast, by Application 2019 & 2032
- Table 21: United Kingdom Recombinant Protein Market Revenue (Million) Forecast, by Application 2019 & 2032
- Table 22: United Kingdom Recombinant Protein Market Volume (K Unit) Forecast, by Application 2019 & 2032
- Table 23: France Recombinant Protein Market Revenue (Million) Forecast, by Application 2019 & 2032
- Table 24: France Recombinant Protein Market Volume (K Unit) Forecast, by Application 2019 & 2032
- Table 25: Italy Recombinant Protein Market Revenue (Million) Forecast, by Application 2019 & 2032
- Table 26: Italy Recombinant Protein Market Volume (K Unit) Forecast, by Application 2019 & 2032
- Table 27: Spain Recombinant Protein Market Revenue (Million) Forecast, by Application 2019 & 2032
- Table 28: Spain Recombinant Protein Market Volume (K Unit) Forecast, by Application 2019 & 2032
- Table 29: Rest of Europe Recombinant Protein Market Revenue (Million) Forecast, by Application 2019 & 2032
- Table 30: Rest of Europe Recombinant Protein Market Volume (K Unit) Forecast, by Application 2019 & 2032
- Table 31: Global Recombinant Protein Market Revenue Million Forecast, by Country 2019 & 2032
- Table 32: Global Recombinant Protein Market Volume K Unit Forecast, by Country 2019 & 2032
- Table 33: China Recombinant Protein Market Revenue (Million) Forecast, by Application 2019 & 2032
- Table 34: China Recombinant Protein Market Volume (K Unit) Forecast, by Application 2019 & 2032
- Table 35: Japan Recombinant Protein Market Revenue (Million) Forecast, by Application 2019 & 2032
- Table 36: Japan Recombinant Protein Market Volume (K Unit) Forecast, by Application 2019 & 2032
- Table 37: India Recombinant Protein Market Revenue (Million) Forecast, by Application 2019 & 2032
- Table 38: India Recombinant Protein Market Volume (K Unit) Forecast, by Application 2019 & 2032
- Table 39: Australia Recombinant Protein Market Revenue (Million) Forecast, by Application 2019 & 2032
- Table 40: Australia Recombinant Protein Market Volume (K Unit) Forecast, by Application 2019 & 2032
- Table 41: South Korea Recombinant Protein Market Revenue (Million) Forecast, by Application 2019 & 2032
- Table 42: South Korea Recombinant Protein Market Volume (K Unit) Forecast, by Application 2019 & 2032
- Table 43: Rest of Asia Pacific Recombinant Protein Market Revenue (Million) Forecast, by Application 2019 & 2032
- Table 44: Rest of Asia Pacific Recombinant Protein Market Volume (K Unit) Forecast, by Application 2019 & 2032
- Table 45: Global Recombinant Protein Market Revenue Million Forecast, by Country 2019 & 2032
- Table 46: Global Recombinant Protein Market Volume K Unit Forecast, by Country 2019 & 2032
- Table 47: GCC Recombinant Protein Market Revenue (Million) Forecast, by Application 2019 & 2032
- Table 48: GCC Recombinant Protein Market Volume (K Unit) Forecast, by Application 2019 & 2032
- Table 49: South Africa Recombinant Protein Market Revenue (Million) Forecast, by Application 2019 & 2032
- Table 50: South Africa Recombinant Protein Market Volume (K Unit) Forecast, by Application 2019 & 2032
- Table 51: Rest of Middle East and Africa Recombinant Protein Market Revenue (Million) Forecast, by Application 2019 & 2032
- Table 52: Rest of Middle East and Africa Recombinant Protein Market Volume (K Unit) Forecast, by Application 2019 & 2032
- Table 53: Global Recombinant Protein Market Revenue Million Forecast, by Country 2019 & 2032
- Table 54: Global Recombinant Protein Market Volume K Unit Forecast, by Country 2019 & 2032
- Table 55: Brazil Recombinant Protein Market Revenue (Million) Forecast, by Application 2019 & 2032
- Table 56: Brazil Recombinant Protein Market Volume (K Unit) Forecast, by Application 2019 & 2032
- Table 57: Argentina Recombinant Protein Market Revenue (Million) Forecast, by Application 2019 & 2032
- Table 58: Argentina Recombinant Protein Market Volume (K Unit) Forecast, by Application 2019 & 2032
- Table 59: Rest of South America Recombinant Protein Market Revenue (Million) Forecast, by Application 2019 & 2032
- Table 60: Rest of South America Recombinant Protein Market Volume (K Unit) Forecast, by Application 2019 & 2032
- Table 61: Global Recombinant Protein Market Revenue Million Forecast, by Product 2019 & 2032
- Table 62: Global Recombinant Protein Market Volume K Unit Forecast, by Product 2019 & 2032
- Table 63: Global Recombinant Protein Market Revenue Million Forecast, by Application 2019 & 2032
- Table 64: Global Recombinant Protein Market Volume K Unit Forecast, by Application 2019 & 2032
- Table 65: Global Recombinant Protein Market Revenue Million Forecast, by Country 2019 & 2032
- Table 66: Global Recombinant Protein Market Volume K Unit Forecast, by Country 2019 & 2032
- Table 67: United States Recombinant Protein Market Revenue (Million) Forecast, by Application 2019 & 2032
- Table 68: United States Recombinant Protein Market Volume (K Unit) Forecast, by Application 2019 & 2032
- Table 69: Canada Recombinant Protein Market Revenue (Million) Forecast, by Application 2019 & 2032
- Table 70: Canada Recombinant Protein Market Volume (K Unit) Forecast, by Application 2019 & 2032
- Table 71: Mexico Recombinant Protein Market Revenue (Million) Forecast, by Application 2019 & 2032
- Table 72: Mexico Recombinant Protein Market Volume (K Unit) Forecast, by Application 2019 & 2032
- Table 73: Global Recombinant Protein Market Revenue Million Forecast, by Product 2019 & 2032
- Table 74: Global Recombinant Protein Market Volume K Unit Forecast, by Product 2019 & 2032
- Table 75: Global Recombinant Protein Market Revenue Million Forecast, by Application 2019 & 2032
- Table 76: Global Recombinant Protein Market Volume K Unit Forecast, by Application 2019 & 2032
- Table 77: Global Recombinant Protein Market Revenue Million Forecast, by Country 2019 & 2032
- Table 78: Global Recombinant Protein Market Volume K Unit Forecast, by Country 2019 & 2032
- Table 79: Germany Recombinant Protein Market Revenue (Million) Forecast, by Application 2019 & 2032
- Table 80: Germany Recombinant Protein Market Volume (K Unit) Forecast, by Application 2019 & 2032
- Table 81: United Kingdom Recombinant Protein Market Revenue (Million) Forecast, by Application 2019 & 2032
- Table 82: United Kingdom Recombinant Protein Market Volume (K Unit) Forecast, by Application 2019 & 2032
- Table 83: France Recombinant Protein Market Revenue (Million) Forecast, by Application 2019 & 2032
- Table 84: France Recombinant Protein Market Volume (K Unit) Forecast, by Application 2019 & 2032
- Table 85: Italy Recombinant Protein Market Revenue (Million) Forecast, by Application 2019 & 2032
- Table 86: Italy Recombinant Protein Market Volume (K Unit) Forecast, by Application 2019 & 2032
- Table 87: Spain Recombinant Protein Market Revenue (Million) Forecast, by Application 2019 & 2032
- Table 88: Spain Recombinant Protein Market Volume (K Unit) Forecast, by Application 2019 & 2032
- Table 89: Rest of Europe Recombinant Protein Market Revenue (Million) Forecast, by Application 2019 & 2032
- Table 90: Rest of Europe Recombinant Protein Market Volume (K Unit) Forecast, by Application 2019 & 2032
- Table 91: Global Recombinant Protein Market Revenue Million Forecast, by Product 2019 & 2032
- Table 92: Global Recombinant Protein Market Volume K Unit Forecast, by Product 2019 & 2032
- Table 93: Global Recombinant Protein Market Revenue Million Forecast, by Application 2019 & 2032
- Table 94: Global Recombinant Protein Market Volume K Unit Forecast, by Application 2019 & 2032
- Table 95: Global Recombinant Protein Market Revenue Million Forecast, by Country 2019 & 2032
- Table 96: Global Recombinant Protein Market Volume K Unit Forecast, by Country 2019 & 2032
- Table 97: China Recombinant Protein Market Revenue (Million) Forecast, by Application 2019 & 2032
- Table 98: China Recombinant Protein Market Volume (K Unit) Forecast, by Application 2019 & 2032
- Table 99: Japan Recombinant Protein Market Revenue (Million) Forecast, by Application 2019 & 2032
- Table 100: Japan Recombinant Protein Market Volume (K Unit) Forecast, by Application 2019 & 2032
- Table 101: India Recombinant Protein Market Revenue (Million) Forecast, by Application 2019 & 2032
- Table 102: India Recombinant Protein Market Volume (K Unit) Forecast, by Application 2019 & 2032
- Table 103: Australia Recombinant Protein Market Revenue (Million) Forecast, by Application 2019 & 2032
- Table 104: Australia Recombinant Protein Market Volume (K Unit) Forecast, by Application 2019 & 2032
- Table 105: South Korea Recombinant Protein Market Revenue (Million) Forecast, by Application 2019 & 2032
- Table 106: South Korea Recombinant Protein Market Volume (K Unit) Forecast, by Application 2019 & 2032
- Table 107: Rest of Asia Pacific Recombinant Protein Market Revenue (Million) Forecast, by Application 2019 & 2032
- Table 108: Rest of Asia Pacific Recombinant Protein Market Volume (K Unit) Forecast, by Application 2019 & 2032
- Table 109: Global Recombinant Protein Market Revenue Million Forecast, by Product 2019 & 2032
- Table 110: Global Recombinant Protein Market Volume K Unit Forecast, by Product 2019 & 2032
- Table 111: Global Recombinant Protein Market Revenue Million Forecast, by Application 2019 & 2032
- Table 112: Global Recombinant Protein Market Volume K Unit Forecast, by Application 2019 & 2032
- Table 113: Global Recombinant Protein Market Revenue Million Forecast, by Country 2019 & 2032
- Table 114: Global Recombinant Protein Market Volume K Unit Forecast, by Country 2019 & 2032
- Table 115: GCC Recombinant Protein Market Revenue (Million) Forecast, by Application 2019 & 2032
- Table 116: GCC Recombinant Protein Market Volume (K Unit) Forecast, by Application 2019 & 2032
- Table 117: South Africa Recombinant Protein Market Revenue (Million) Forecast, by Application 2019 & 2032
- Table 118: South Africa Recombinant Protein Market Volume (K Unit) Forecast, by Application 2019 & 2032
- Table 119: Rest of Middle East and Africa Recombinant Protein Market Revenue (Million) Forecast, by Application 2019 & 2032
- Table 120: Rest of Middle East and Africa Recombinant Protein Market Volume (K Unit) Forecast, by Application 2019 & 2032
- Table 121: Global Recombinant Protein Market Revenue Million Forecast, by Product 2019 & 2032
- Table 122: Global Recombinant Protein Market Volume K Unit Forecast, by Product 2019 & 2032
- Table 123: Global Recombinant Protein Market Revenue Million Forecast, by Application 2019 & 2032
- Table 124: Global Recombinant Protein Market Volume K Unit Forecast, by Application 2019 & 2032
- Table 125: Global Recombinant Protein Market Revenue Million Forecast, by Country 2019 & 2032
- Table 126: Global Recombinant Protein Market Volume K Unit Forecast, by Country 2019 & 2032
- Table 127: Brazil Recombinant Protein Market Revenue (Million) Forecast, by Application 2019 & 2032
- Table 128: Brazil Recombinant Protein Market Volume (K Unit) Forecast, by Application 2019 & 2032
- Table 129: Argentina Recombinant Protein Market Revenue (Million) Forecast, by Application 2019 & 2032
- Table 130: Argentina Recombinant Protein Market Volume (K Unit) Forecast, by Application 2019 & 2032
- Table 131: Rest of South America Recombinant Protein Market Revenue (Million) Forecast, by Application 2019 & 2032
- Table 132: Rest of South America Recombinant Protein Market Volume (K Unit) Forecast, by Application 2019 & 2032
Frequently Asked Questions
1. What is the projected Compound Annual Growth Rate (CAGR) of the Recombinant Protein Market?
The projected CAGR is approximately 7.91%.
2. Which companies are prominent players in the Recombinant Protein Market?
Key companies in the market include Sanofi SA, Novo Nordisk AS, Bio-Rad Laboratories Inc, Merck KGaA, Novartis AG, Amgen Inc, Thermo Fisher Scientific Inc, Eli Lilly and Company, Abbvie Inc, Novavax Inc, Pfizer Inc , GlaxoSmithKline PLC.
3. What are the main segments of the Recombinant Protein Market?
The market segments include Product, Application.
4. Can you provide details about the market size?
The market size is estimated to be USD 2.69 Million as of 2022.
5. What are some drivers contributing to market growth?
Increasing Expenditure on Research and Development; Growing Burden of Chronic Diseases; Rising Inclination toward Biologics and Biosimilars; Technological Advancements in Recombinant Products.
6. What are the notable trends driving market growth?
Antibody Segment is Expected to Witness a Significant Growth Over the Forecast Period..
7. Are there any restraints impacting market growth?
Expensive and Time-consuming Production Process.
8. Can you provide examples of recent developments in the market?
September 2022: the life science group Sartorius, through its French-listed subgroup Sartorius StedimBiotech, acquired AlbumedixLtd. Albumedix is one of the key players in the field of recombinant albumin-based solutions and is based in Nottingham, UK.
9. What pricing options are available for accessing the report?
Pricing options include single-user, multi-user, and enterprise licenses priced at USD 4750, USD 5250, and USD 8750 respectively.
10. Is the market size provided in terms of value or volume?
The market size is provided in terms of value, measured in Million and volume, measured in K Unit.
11. Are there any specific market keywords associated with the report?
Yes, the market keyword associated with the report is "Recombinant Protein Market," which aids in identifying and referencing the specific market segment covered.
12. How do I determine which pricing option suits my needs best?
The pricing options vary based on user requirements and access needs. Individual users may opt for single-user licenses, while businesses requiring broader access may choose multi-user or enterprise licenses for cost-effective access to the report.
13. Are there any additional resources or data provided in the Recombinant Protein Market report?
While the report offers comprehensive insights, it's advisable to review the specific contents or supplementary materials provided to ascertain if additional resources or data are available.
14. How can I stay updated on further developments or reports in the Recombinant Protein Market?
To stay informed about further developments, trends, and reports in the Recombinant Protein Market, consider subscribing to industry newsletters, following relevant companies and organizations, or regularly checking reputable industry news sources and publications.
Methodology
Step 1 - Identification of Relevant Samples Size from Population Database


Step 2 - Approaches for Defining Global Market Size (Value, Volume* & Price*)

Note*: In applicable scenarios
Step 3 - Data Sources
Primary Research
- Web Analytics
- Survey Reports
- Research Institute
- Latest Research Reports
- Opinion Leaders
Secondary Research
- Annual Reports
- White Paper
- Latest Press Release
- Industry Association
- Paid Database
- Investor Presentations

Step 4 - Data Triangulation
Involves using different sources of information in order to increase the validity of a study
These sources are likely to be stakeholders in a program - participants, other researchers, program staff, other community members, and so on.
Then we put all data in single framework & apply various statistical tools to find out the dynamic on the market.
During the analysis stage, feedback from the stakeholder groups would be compared to determine areas of agreement as well as areas of divergence


