
Key Insights
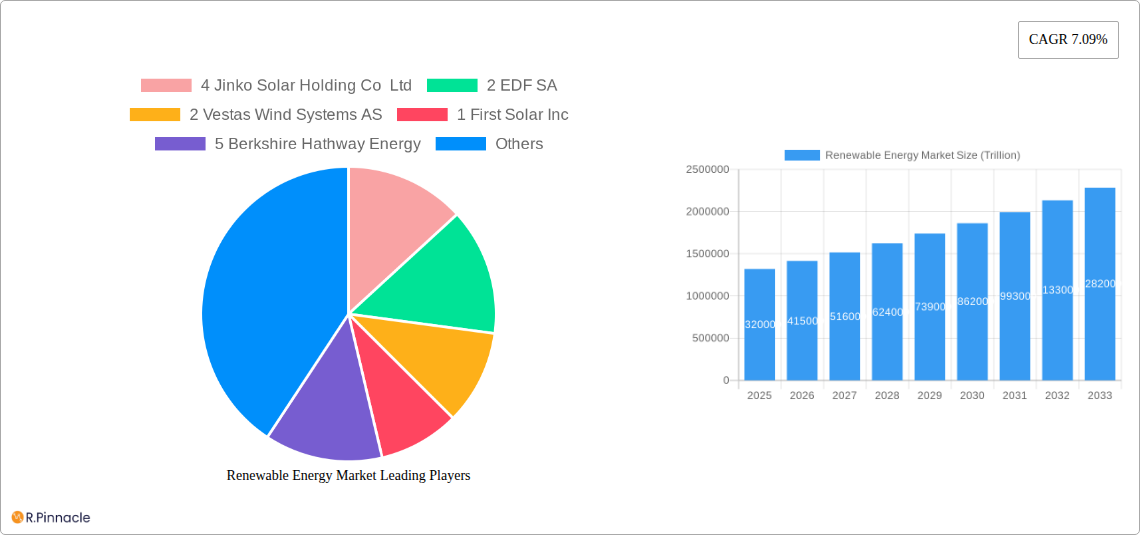
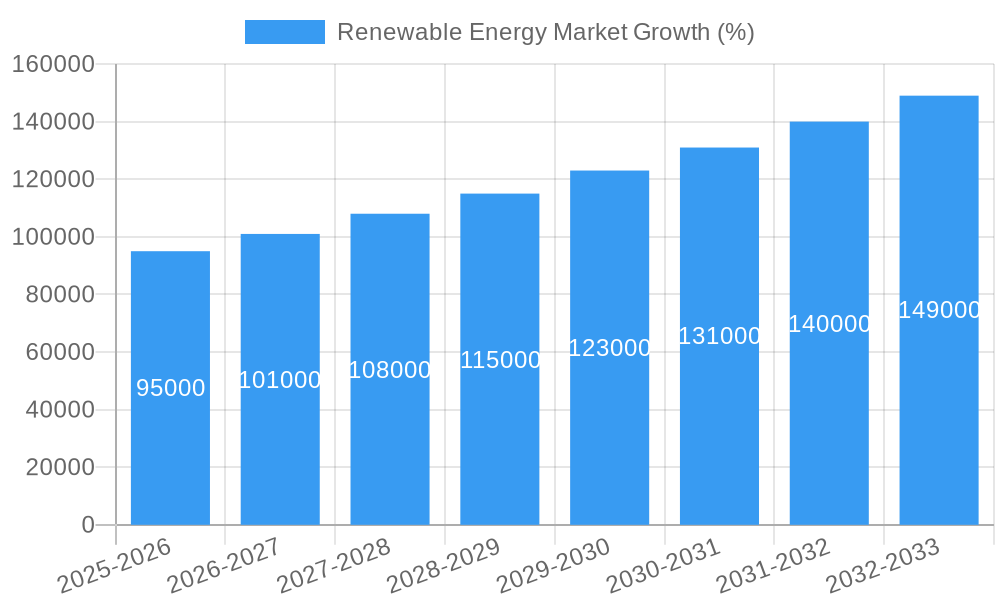
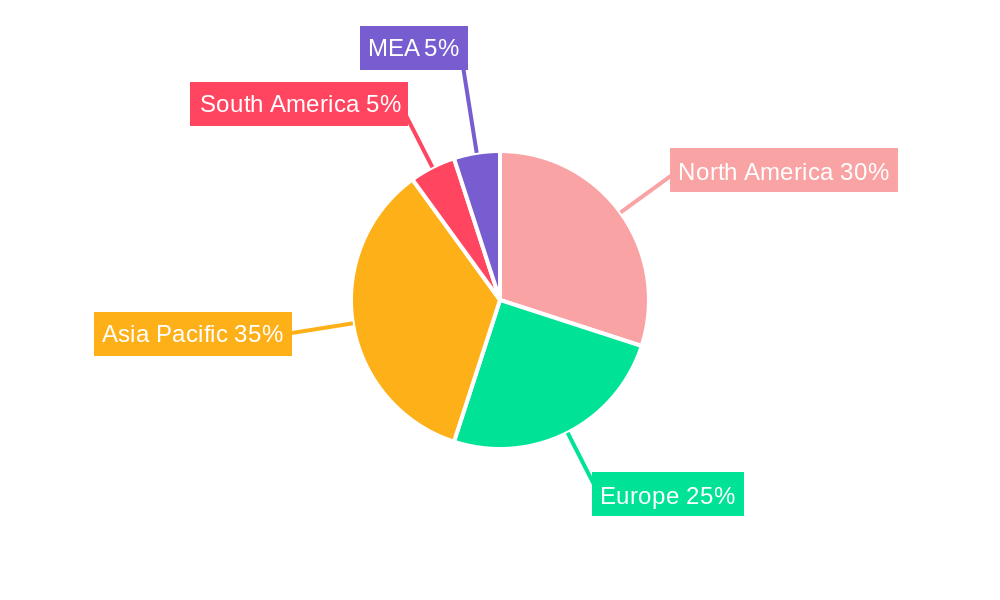
The global renewable energy market, valued at $1.32 trillion in 2025, is projected to experience robust growth, driven by increasing concerns about climate change, depleting fossil fuel reserves, and supportive government policies promoting clean energy transition. A compound annual growth rate (CAGR) of 7.09% from 2025 to 2033 indicates a significant expansion of this market, reaching an estimated value exceeding $2.5 trillion by 2033. Key drivers include the decreasing costs of renewable energy technologies, particularly solar and wind power, making them increasingly competitive with conventional energy sources. Furthermore, technological advancements leading to higher efficiency and improved energy storage solutions are accelerating market adoption. Growth is further fueled by rising energy demand in developing economies and the increasing integration of renewable energy sources into smart grids. While regulatory frameworks and grid infrastructure limitations present some challenges, ongoing investments in research and development, coupled with international collaborations, are mitigating these restraints. The market is segmented by technology type, with solar, wind, and hydro dominating, while bioenergy and other emerging technologies like geothermal and tidal are also contributing to the overall growth. Major players, including JinkoSolar, EDF, Vestas, First Solar, Berkshire Hathaway Energy, Orsted, Canadian Solar, Duke Energy, Acciona Energia, NextEra Energy, General Electric, and Siemens Gamesa, are actively shaping market dynamics through technological innovation, project development, and strategic partnerships. Regional variations exist, with North America, Europe, and Asia-Pacific currently representing the largest markets, but growth is expected across all regions, including South America and the Middle East and Africa, driven by respective government initiatives and local energy needs.
The renewable energy market’s diverse segments offer varied investment opportunities. Solar, benefiting from falling production costs and technological leaps in efficiency, shows particularly strong potential. Wind energy, especially offshore wind farms, is also poised for substantial growth due to increased capacity and improved turbine technology. Hydropower, while geographically constrained, remains a significant contributor, particularly in regions with abundant water resources. Bioenergy, utilizing biomass for electricity generation, is gaining traction as a sustainable alternative. Emerging technologies such as geothermal and tidal power, while presently smaller contributors, are attracting increasing investment due to their potential for long-term sustainable energy supply. The competitive landscape is marked by both established energy giants and specialized renewable energy companies, leading to continuous innovation and market consolidation. This dynamic environment necessitates agile strategies and adaptation to evolving technological landscapes and regulatory changes for all stakeholders.
Renewable Energy Market: A Trillion-Dollar Growth Opportunity - Comprehensive Report 2019-2033
This comprehensive report provides an in-depth analysis of the global renewable energy market, projecting a massive growth trajectory reaching trillions of dollars by 2033. This report is essential for industry professionals, investors, and policymakers seeking actionable insights into this rapidly evolving sector. The study covers the period 2019-2033, with a base year of 2025 and a forecast period of 2025-2033.
Renewable Energy Market Market Structure & Innovation Trends
The renewable energy market is characterized by a dynamic interplay of established players and emerging innovators. Market concentration is moderate, with several key players holding significant market share but not dominating the market entirely. Innovation is driven by technological advancements in solar PV, wind turbine efficiency, and energy storage solutions. Stringent regulatory frameworks, such as renewable portfolio standards (RPS) and carbon emission reduction targets, are crucial catalysts. Product substitutes, such as fossil fuels, face increasing competitive pressure due to declining costs and improved efficiency of renewable energy technologies. The end-user demographics span residential, commercial, and industrial sectors, with significant growth anticipated across all segments. M&A activity is robust, with deal values reaching billions of USD annually, driven by consolidation efforts and expansion into new geographical markets.
- Market Concentration: Moderate, with no single company holding a dominant share.
- Innovation Drivers: Technological advancements in solar PV, wind turbines, and energy storage.
- Regulatory Frameworks: Stringent RPS and carbon reduction targets drive market growth.
- M&A Activity: Significant deal flow, with values in the billions of USD annually.
- Market Share Analysis (2025): JinkoSolar (4%), EDF (2%), Vestas (2%), First Solar (1%), Berkshire Hathaway Energy (5%), Orsted (1%), Canadian Solar (3%), Duke Energy (4%), Acciona Energia (6%), NextEra Energy (3%), General Electric (5%), Siemens Gamesa (6%). (Note: These are estimated market share percentages. Actual figures may vary.)
Renewable Energy Market Market Dynamics & Trends
The renewable energy market is experiencing explosive growth, fueled by a confluence of factors. Government incentives, falling technology costs, increasing environmental awareness, and growing energy demand are key growth drivers. Technological disruptions, such as advancements in battery storage and grid integration technologies, are transforming the landscape. Consumer preferences are shifting towards cleaner energy sources, driving increased demand for renewable energy products and services. Competitive dynamics are intense, with companies vying for market share through technological innovation, cost reductions, and strategic partnerships. The compound annual growth rate (CAGR) for the renewable energy market is projected to be xx% during the forecast period (2025-2033), with significant market penetration expected in emerging economies.
Dominant Regions & Segments in Renewable Energy Market
The renewable energy market is geographically diverse, with notable regional dominance varying across different segments.
Dominant Segments and Regions (2025, estimated):
Solar: Asia-Pacific holds the leading position, driven by massive investments in solar PV projects and supportive government policies in China, India, and other countries. Key drivers include decreasing solar panel prices and increasing energy demand.
Wind: Europe and North America remain dominant due to established wind energy infrastructure and favorable regulatory environments. Offshore wind is a rapidly expanding sub-segment.
Hydro: Asia-Pacific is a major player in hydropower, although the sector is facing growing concerns about environmental impact.
Bioenergy: North America and Europe maintain a strong presence in bioenergy, although the sector’s growth is tied to sustainable sourcing and technological advancements.
Other Types (Geothermal, Tidal, etc.): These segments are still relatively small compared to solar and wind but exhibit potential for future growth, particularly in countries with geographically advantageous locations.
Renewable Energy Market Product Innovations
Recent product innovations are focused on improving efficiency, reducing costs, and enhancing the reliability of renewable energy technologies. This includes advancements in higher-efficiency solar panels, larger wind turbine designs, and more effective energy storage solutions. These innovations are improving the market fit of renewable energy by making it more competitive with traditional energy sources.
Report Scope & Segmentation Analysis
This report segments the renewable energy market by type: Solar, Wind, Hydro, Bioenergy, and Other (Geothermal, Tidal, etc.). Each segment's growth projections, market size, and competitive dynamics are analyzed in detail. For example, the solar segment is projected to witness robust growth due to decreasing costs, while the wind energy sector will be driven by offshore wind farms and improved turbine technology. The hydro segment is likely to remain relatively stable while facing sustainability issues, while bioenergy will depend on technological innovations and raw material availability. Other renewable sources will witness moderate growth, limited by their specific geographic suitability.
Key Drivers of Renewable Energy Market Growth
The renewable energy market's growth is driven by several key factors: Firstly, supportive government policies, including subsidies, tax incentives, and renewable portfolio standards, are crucial in stimulating market growth. Secondly, declining technology costs, especially in solar and wind power, make renewable energy increasingly competitive with traditional fossil fuels. Thirdly, rising environmental awareness and concerns about climate change are pushing consumers and businesses towards sustainable energy choices. Lastly, increasing energy demand, especially in developing economies, further fuels the adoption of renewable energy technologies.
Challenges in the Renewable Energy Market Sector
Challenges include intermittency issues of solar and wind power, requiring substantial investment in energy storage solutions. Grid infrastructure limitations in some regions hinder the integration of renewable energy sources. Supply chain disruptions, especially in the production of key components, can significantly impact market growth. Furthermore, competition from established fossil fuel industries, and securing financing for large-scale projects, remain significant barriers.
Emerging Opportunities in Renewable Energy Market
Emerging opportunities include the growth of hybrid renewable energy systems, combining different technologies to enhance reliability and efficiency. The rise of floating offshore wind farms opens up new geographical areas for wind power generation. Increased investment in smart grids and energy management systems enables optimal utilization of renewable energy resources. Finally, expanding into new markets, especially in developing countries, offers substantial growth potential.
Leading Players in the Renewable Energy Market Market
- JinkoSolar Holding Co Ltd
- EDF SA
- Vestas Wind Systems AS
- First Solar Inc
- Berkshire Hathaway Energy
- Orsted AS
- Canadian Solar Inc
- Duke Energy Corporation
- Acciona Energia SA
- NextEra Energy Inc
- General Electric Company
- Siemens Gamesa Renewable Energy SA (List Not Exhaustive)
Key Developments in Renewable Energy Market Industry
- April 2023: ArcelorMittal Brazil and Casa dos Ventos formed a joint venture to develop the 554 MW Babilonia wind power project in Bahia, Brazil, representing a USD 800 million investment.
- January 2023: Cepsa announced plans to build three new solar power projects in Castilla-La Mancha, Spain, totaling 400 MW and involving a USD 305 million investment.
- May 2022: NJR Clean Energy Ventures (CEV) commenced construction of an 8.9-MW floating solar installation in Millburn, New Jersey, representing the largest such project in the United States.
Future Outlook for Renewable Energy Market Market
The renewable energy market is poised for continued robust growth, driven by technological advancements, supportive government policies, and increasing environmental consciousness. Strategic opportunities lie in the development of innovative energy storage solutions, expansion into emerging markets, and the optimization of grid infrastructure to seamlessly integrate renewable energy sources. The market is expected to continue its upward trajectory, reaching trillions of dollars in value over the next decade.
Renewable Energy Market Segmentation
-
1. Type
- 1.1. Solar
- 1.2. Wind
- 1.3. Hydro
- 1.4. Bioenergy
- 1.5. Other Types (Geothermal, Tidal, etc.)
Renewable Energy Market Segmentation By Geography
-
1. North America
- 1.1. United States of America
- 1.2. Canada
- 1.3. Rest of the North America
-
2. Europe
- 2.1. United Kingdom
- 2.2. Germany
- 2.3. France
- 2.4. Spain
- 2.5. NORDIC
- 2.6. Turkey
- 2.7. Russia
- 2.8. Rest of the Europe
-
3. Asia Pacific
- 3.1. China
- 3.2. India
- 3.3. Japan
- 3.4. Malaysia
- 3.5. Thailand
- 3.6. Indonesia
- 3.7. Vietnam
- 3.8. Rest of Asia Pacific
-
4. Middle East and Africa
- 4.1. United Arab Emirates
- 4.2. Saudi Arabia
- 4.3. Egypt
- 4.4. Nigeria
- 4.5. South Africa
- 4.6. Qatar
- 4.7. Rest of the Middle East and Africa
-
5. South America
- 5.1. Brazil
- 5.2. Argentina
- 5.3. Colombia
- 5.4. Rest of the South America
Renewable Energy Market REPORT HIGHLIGHTS
| Aspects | Details |
|---|---|
| Study Period | 2019-2033 |
| Base Year | 2024 |
| Estimated Year | 2025 |
| Forecast Period | 2025-2033 |
| Historical Period | 2019-2024 |
| Growth Rate | CAGR of 7.09% from 2019-2033 |
| Segmentation |
|
Table of Contents
- 1. Introduction
- 1.1. Research Scope
- 1.2. Market Segmentation
- 1.3. Research Methodology
- 1.4. Definitions and Assumptions
- 2. Executive Summary
- 2.1. Introduction
- 3. Market Dynamics
- 3.1. Introduction
- 3.2. Market Drivers
- 3.2.1. 4.; Favorable Government Policies for Renewable Energy4.; The Declining Price of Solar Panels and Wind Turbine Installations4.; Increasing Investments in Hydropower and Pumped Storage Hydropower Projects4.; Growing Emphasis on Geothermal Energy
- 3.3. Market Restrains
- 3.3.1. 4.; Increasing Penetration of Natural Gas for Power Generation
- 3.4. Market Trends
- 3.4.1. Hydropower Segment is Expected to Dominate the Market during the Forecast Period
- 4. Market Factor Analysis
- 4.1. Porters Five Forces
- 4.2. Supply/Value Chain
- 4.3. PESTEL analysis
- 4.4. Market Entropy
- 4.5. Patent/Trademark Analysis
- 5. Global Renewable Energy Market Analysis, Insights and Forecast, 2019-2031
- 5.1. Market Analysis, Insights and Forecast - by Type
- 5.1.1. Solar
- 5.1.2. Wind
- 5.1.3. Hydro
- 5.1.4. Bioenergy
- 5.1.5. Other Types (Geothermal, Tidal, etc.)
- 5.2. Market Analysis, Insights and Forecast - by Region
- 5.2.1. North America
- 5.2.2. Europe
- 5.2.3. Asia Pacific
- 5.2.4. Middle East and Africa
- 5.2.5. South America
- 5.1. Market Analysis, Insights and Forecast - by Type
- 6. North America Renewable Energy Market Analysis, Insights and Forecast, 2019-2031
- 6.1. Market Analysis, Insights and Forecast - by Type
- 6.1.1. Solar
- 6.1.2. Wind
- 6.1.3. Hydro
- 6.1.4. Bioenergy
- 6.1.5. Other Types (Geothermal, Tidal, etc.)
- 6.1. Market Analysis, Insights and Forecast - by Type
- 7. Europe Renewable Energy Market Analysis, Insights and Forecast, 2019-2031
- 7.1. Market Analysis, Insights and Forecast - by Type
- 7.1.1. Solar
- 7.1.2. Wind
- 7.1.3. Hydro
- 7.1.4. Bioenergy
- 7.1.5. Other Types (Geothermal, Tidal, etc.)
- 7.1. Market Analysis, Insights and Forecast - by Type
- 8. Asia Pacific Renewable Energy Market Analysis, Insights and Forecast, 2019-2031
- 8.1. Market Analysis, Insights and Forecast - by Type
- 8.1.1. Solar
- 8.1.2. Wind
- 8.1.3. Hydro
- 8.1.4. Bioenergy
- 8.1.5. Other Types (Geothermal, Tidal, etc.)
- 8.1. Market Analysis, Insights and Forecast - by Type
- 9. Middle East and Africa Renewable Energy Market Analysis, Insights and Forecast, 2019-2031
- 9.1. Market Analysis, Insights and Forecast - by Type
- 9.1.1. Solar
- 9.1.2. Wind
- 9.1.3. Hydro
- 9.1.4. Bioenergy
- 9.1.5. Other Types (Geothermal, Tidal, etc.)
- 9.1. Market Analysis, Insights and Forecast - by Type
- 10. South America Renewable Energy Market Analysis, Insights and Forecast, 2019-2031
- 10.1. Market Analysis, Insights and Forecast - by Type
- 10.1.1. Solar
- 10.1.2. Wind
- 10.1.3. Hydro
- 10.1.4. Bioenergy
- 10.1.5. Other Types (Geothermal, Tidal, etc.)
- 10.1. Market Analysis, Insights and Forecast - by Type
- 11. North America Renewable Energy Market Analysis, Insights and Forecast, 2019-2031
- 11.1. Market Analysis, Insights and Forecast - By Country/Sub-region
- 11.1.1 United States
- 11.1.2 Canada
- 11.1.3 Mexico
- 12. Europe Renewable Energy Market Analysis, Insights and Forecast, 2019-2031
- 12.1. Market Analysis, Insights and Forecast - By Country/Sub-region
- 12.1.1 Germany
- 12.1.2 United Kingdom
- 12.1.3 France
- 12.1.4 Spain
- 12.1.5 Italy
- 12.1.6 Spain
- 12.1.7 Belgium
- 12.1.8 Netherland
- 12.1.9 Nordics
- 12.1.10 Rest of Europe
- 13. Asia Pacific Renewable Energy Market Analysis, Insights and Forecast, 2019-2031
- 13.1. Market Analysis, Insights and Forecast - By Country/Sub-region
- 13.1.1 China
- 13.1.2 Japan
- 13.1.3 India
- 13.1.4 South Korea
- 13.1.5 Southeast Asia
- 13.1.6 Australia
- 13.1.7 Indonesia
- 13.1.8 Phillipes
- 13.1.9 Singapore
- 13.1.10 Thailandc
- 13.1.11 Rest of Asia Pacific
- 14. South America Renewable Energy Market Analysis, Insights and Forecast, 2019-2031
- 14.1. Market Analysis, Insights and Forecast - By Country/Sub-region
- 14.1.1 Brazil
- 14.1.2 Argentina
- 14.1.3 Peru
- 14.1.4 Chile
- 14.1.5 Colombia
- 14.1.6 Ecuador
- 14.1.7 Venezuela
- 14.1.8 Rest of South America
- 15. North America Renewable Energy Market Analysis, Insights and Forecast, 2019-2031
- 15.1. Market Analysis, Insights and Forecast - By Country/Sub-region
- 15.1.1 United States
- 15.1.2 Canada
- 15.1.3 Mexico
- 16. MEA Renewable Energy Market Analysis, Insights and Forecast, 2019-2031
- 16.1. Market Analysis, Insights and Forecast - By Country/Sub-region
- 16.1.1 United Arab Emirates
- 16.1.2 Saudi Arabia
- 16.1.3 South Africa
- 16.1.4 Rest of Middle East and Africa
- 17. Competitive Analysis
- 17.1. Global Market Share Analysis 2024
- 17.2. Company Profiles
- 17.2.1 4 Jinko Solar Holding Co Ltd
- 17.2.1.1. Overview
- 17.2.1.2. Products
- 17.2.1.3. SWOT Analysis
- 17.2.1.4. Recent Developments
- 17.2.1.5. Financials (Based on Availability)
- 17.2.2 2 EDF SA
- 17.2.2.1. Overview
- 17.2.2.2. Products
- 17.2.2.3. SWOT Analysis
- 17.2.2.4. Recent Developments
- 17.2.2.5. Financials (Based on Availability)
- 17.2.3 2 Vestas Wind Systems AS
- 17.2.3.1. Overview
- 17.2.3.2. Products
- 17.2.3.3. SWOT Analysis
- 17.2.3.4. Recent Developments
- 17.2.3.5. Financials (Based on Availability)
- 17.2.4 1 First Solar Inc
- 17.2.4.1. Overview
- 17.2.4.2. Products
- 17.2.4.3. SWOT Analysis
- 17.2.4.4. Recent Developments
- 17.2.4.5. Financials (Based on Availability)
- 17.2.5 5 Berkshire Hathway Energy
- 17.2.5.1. Overview
- 17.2.5.2. Products
- 17.2.5.3. SWOT Analysis
- 17.2.5.4. Recent Developments
- 17.2.5.5. Financials (Based on Availability)
- 17.2.6 Equipment Suppliers
- 17.2.6.1. Overview
- 17.2.6.2. Products
- 17.2.6.3. SWOT Analysis
- 17.2.6.4. Recent Developments
- 17.2.6.5. Financials (Based on Availability)
- 17.2.7 1 Orsted AS
- 17.2.7.1. Overview
- 17.2.7.2. Products
- 17.2.7.3. SWOT Analysis
- 17.2.7.4. Recent Developments
- 17.2.7.5. Financials (Based on Availability)
- 17.2.8 EPC Developers/Operators/Owners
- 17.2.8.1. Overview
- 17.2.8.2. Products
- 17.2.8.3. SWOT Analysis
- 17.2.8.4. Recent Developments
- 17.2.8.5. Financials (Based on Availability)
- 17.2.9 3 Canadian Solar Inc
- 17.2.9.1. Overview
- 17.2.9.2. Products
- 17.2.9.3. SWOT Analysis
- 17.2.9.4. Recent Developments
- 17.2.9.5. Financials (Based on Availability)
- 17.2.10 4 Duke Energy Corporation
- 17.2.10.1. Overview
- 17.2.10.2. Products
- 17.2.10.3. SWOT Analysis
- 17.2.10.4. Recent Developments
- 17.2.10.5. Financials (Based on Availability)
- 17.2.11 6 Acciona Energia SA
- 17.2.11.1. Overview
- 17.2.11.2. Products
- 17.2.11.3. SWOT Analysis
- 17.2.11.4. Recent Developments
- 17.2.11.5. Financials (Based on Availability)
- 17.2.12 3 NextEra Energy Inc
- 17.2.12.1. Overview
- 17.2.12.2. Products
- 17.2.12.3. SWOT Analysis
- 17.2.12.4. Recent Developments
- 17.2.12.5. Financials (Based on Availability)
- 17.2.13 5 General Electric Company
- 17.2.13.1. Overview
- 17.2.13.2. Products
- 17.2.13.3. SWOT Analysis
- 17.2.13.4. Recent Developments
- 17.2.13.5. Financials (Based on Availability)
- 17.2.14 6 Siemens Gamesa Renewable Energy SA*List Not Exhaustive 6 4 Market Ranking/Share (%) Analysi
- 17.2.14.1. Overview
- 17.2.14.2. Products
- 17.2.14.3. SWOT Analysis
- 17.2.14.4. Recent Developments
- 17.2.14.5. Financials (Based on Availability)
- 17.2.1 4 Jinko Solar Holding Co Ltd
List of Figures
- Figure 1: Global Renewable Energy Market Revenue Breakdown (Trillion, %) by Region 2024 & 2032
- Figure 2: Global Renewable Energy Market Volume Breakdown (TW, %) by Region 2024 & 2032
- Figure 3: North America Renewable Energy Market Revenue (Trillion), by Country 2024 & 2032
- Figure 4: North America Renewable Energy Market Volume (TW), by Country 2024 & 2032
- Figure 5: North America Renewable Energy Market Revenue Share (%), by Country 2024 & 2032
- Figure 6: North America Renewable Energy Market Volume Share (%), by Country 2024 & 2032
- Figure 7: Europe Renewable Energy Market Revenue (Trillion), by Country 2024 & 2032
- Figure 8: Europe Renewable Energy Market Volume (TW), by Country 2024 & 2032
- Figure 9: Europe Renewable Energy Market Revenue Share (%), by Country 2024 & 2032
- Figure 10: Europe Renewable Energy Market Volume Share (%), by Country 2024 & 2032
- Figure 11: Asia Pacific Renewable Energy Market Revenue (Trillion), by Country 2024 & 2032
- Figure 12: Asia Pacific Renewable Energy Market Volume (TW), by Country 2024 & 2032
- Figure 13: Asia Pacific Renewable Energy Market Revenue Share (%), by Country 2024 & 2032
- Figure 14: Asia Pacific Renewable Energy Market Volume Share (%), by Country 2024 & 2032
- Figure 15: South America Renewable Energy Market Revenue (Trillion), by Country 2024 & 2032
- Figure 16: South America Renewable Energy Market Volume (TW), by Country 2024 & 2032
- Figure 17: South America Renewable Energy Market Revenue Share (%), by Country 2024 & 2032
- Figure 18: South America Renewable Energy Market Volume Share (%), by Country 2024 & 2032
- Figure 19: North America Renewable Energy Market Revenue (Trillion), by Country 2024 & 2032
- Figure 20: North America Renewable Energy Market Volume (TW), by Country 2024 & 2032
- Figure 21: North America Renewable Energy Market Revenue Share (%), by Country 2024 & 2032
- Figure 22: North America Renewable Energy Market Volume Share (%), by Country 2024 & 2032
- Figure 23: MEA Renewable Energy Market Revenue (Trillion), by Country 2024 & 2032
- Figure 24: MEA Renewable Energy Market Volume (TW), by Country 2024 & 2032
- Figure 25: MEA Renewable Energy Market Revenue Share (%), by Country 2024 & 2032
- Figure 26: MEA Renewable Energy Market Volume Share (%), by Country 2024 & 2032
- Figure 27: North America Renewable Energy Market Revenue (Trillion), by Type 2024 & 2032
- Figure 28: North America Renewable Energy Market Volume (TW), by Type 2024 & 2032
- Figure 29: North America Renewable Energy Market Revenue Share (%), by Type 2024 & 2032
- Figure 30: North America Renewable Energy Market Volume Share (%), by Type 2024 & 2032
- Figure 31: North America Renewable Energy Market Revenue (Trillion), by Country 2024 & 2032
- Figure 32: North America Renewable Energy Market Volume (TW), by Country 2024 & 2032
- Figure 33: North America Renewable Energy Market Revenue Share (%), by Country 2024 & 2032
- Figure 34: North America Renewable Energy Market Volume Share (%), by Country 2024 & 2032
- Figure 35: Europe Renewable Energy Market Revenue (Trillion), by Type 2024 & 2032
- Figure 36: Europe Renewable Energy Market Volume (TW), by Type 2024 & 2032
- Figure 37: Europe Renewable Energy Market Revenue Share (%), by Type 2024 & 2032
- Figure 38: Europe Renewable Energy Market Volume Share (%), by Type 2024 & 2032
- Figure 39: Europe Renewable Energy Market Revenue (Trillion), by Country 2024 & 2032
- Figure 40: Europe Renewable Energy Market Volume (TW), by Country 2024 & 2032
- Figure 41: Europe Renewable Energy Market Revenue Share (%), by Country 2024 & 2032
- Figure 42: Europe Renewable Energy Market Volume Share (%), by Country 2024 & 2032
- Figure 43: Asia Pacific Renewable Energy Market Revenue (Trillion), by Type 2024 & 2032
- Figure 44: Asia Pacific Renewable Energy Market Volume (TW), by Type 2024 & 2032
- Figure 45: Asia Pacific Renewable Energy Market Revenue Share (%), by Type 2024 & 2032
- Figure 46: Asia Pacific Renewable Energy Market Volume Share (%), by Type 2024 & 2032
- Figure 47: Asia Pacific Renewable Energy Market Revenue (Trillion), by Country 2024 & 2032
- Figure 48: Asia Pacific Renewable Energy Market Volume (TW), by Country 2024 & 2032
- Figure 49: Asia Pacific Renewable Energy Market Revenue Share (%), by Country 2024 & 2032
- Figure 50: Asia Pacific Renewable Energy Market Volume Share (%), by Country 2024 & 2032
- Figure 51: Middle East and Africa Renewable Energy Market Revenue (Trillion), by Type 2024 & 2032
- Figure 52: Middle East and Africa Renewable Energy Market Volume (TW), by Type 2024 & 2032
- Figure 53: Middle East and Africa Renewable Energy Market Revenue Share (%), by Type 2024 & 2032
- Figure 54: Middle East and Africa Renewable Energy Market Volume Share (%), by Type 2024 & 2032
- Figure 55: Middle East and Africa Renewable Energy Market Revenue (Trillion), by Country 2024 & 2032
- Figure 56: Middle East and Africa Renewable Energy Market Volume (TW), by Country 2024 & 2032
- Figure 57: Middle East and Africa Renewable Energy Market Revenue Share (%), by Country 2024 & 2032
- Figure 58: Middle East and Africa Renewable Energy Market Volume Share (%), by Country 2024 & 2032
- Figure 59: South America Renewable Energy Market Revenue (Trillion), by Type 2024 & 2032
- Figure 60: South America Renewable Energy Market Volume (TW), by Type 2024 & 2032
- Figure 61: South America Renewable Energy Market Revenue Share (%), by Type 2024 & 2032
- Figure 62: South America Renewable Energy Market Volume Share (%), by Type 2024 & 2032
- Figure 63: South America Renewable Energy Market Revenue (Trillion), by Country 2024 & 2032
- Figure 64: South America Renewable Energy Market Volume (TW), by Country 2024 & 2032
- Figure 65: South America Renewable Energy Market Revenue Share (%), by Country 2024 & 2032
- Figure 66: South America Renewable Energy Market Volume Share (%), by Country 2024 & 2032
List of Tables
- Table 1: Global Renewable Energy Market Revenue Trillion Forecast, by Region 2019 & 2032
- Table 2: Global Renewable Energy Market Volume TW Forecast, by Region 2019 & 2032
- Table 3: Global Renewable Energy Market Revenue Trillion Forecast, by Type 2019 & 2032
- Table 4: Global Renewable Energy Market Volume TW Forecast, by Type 2019 & 2032
- Table 5: Global Renewable Energy Market Revenue Trillion Forecast, by Region 2019 & 2032
- Table 6: Global Renewable Energy Market Volume TW Forecast, by Region 2019 & 2032
- Table 7: Global Renewable Energy Market Revenue Trillion Forecast, by Country 2019 & 2032
- Table 8: Global Renewable Energy Market Volume TW Forecast, by Country 2019 & 2032
- Table 9: United States Renewable Energy Market Revenue (Trillion) Forecast, by Application 2019 & 2032
- Table 10: United States Renewable Energy Market Volume (TW) Forecast, by Application 2019 & 2032
- Table 11: Canada Renewable Energy Market Revenue (Trillion) Forecast, by Application 2019 & 2032
- Table 12: Canada Renewable Energy Market Volume (TW) Forecast, by Application 2019 & 2032
- Table 13: Mexico Renewable Energy Market Revenue (Trillion) Forecast, by Application 2019 & 2032
- Table 14: Mexico Renewable Energy Market Volume (TW) Forecast, by Application 2019 & 2032
- Table 15: Global Renewable Energy Market Revenue Trillion Forecast, by Country 2019 & 2032
- Table 16: Global Renewable Energy Market Volume TW Forecast, by Country 2019 & 2032
- Table 17: Germany Renewable Energy Market Revenue (Trillion) Forecast, by Application 2019 & 2032
- Table 18: Germany Renewable Energy Market Volume (TW) Forecast, by Application 2019 & 2032
- Table 19: United Kingdom Renewable Energy Market Revenue (Trillion) Forecast, by Application 2019 & 2032
- Table 20: United Kingdom Renewable Energy Market Volume (TW) Forecast, by Application 2019 & 2032
- Table 21: France Renewable Energy Market Revenue (Trillion) Forecast, by Application 2019 & 2032
- Table 22: France Renewable Energy Market Volume (TW) Forecast, by Application 2019 & 2032
- Table 23: Spain Renewable Energy Market Revenue (Trillion) Forecast, by Application 2019 & 2032
- Table 24: Spain Renewable Energy Market Volume (TW) Forecast, by Application 2019 & 2032
- Table 25: Italy Renewable Energy Market Revenue (Trillion) Forecast, by Application 2019 & 2032
- Table 26: Italy Renewable Energy Market Volume (TW) Forecast, by Application 2019 & 2032
- Table 27: Spain Renewable Energy Market Revenue (Trillion) Forecast, by Application 2019 & 2032
- Table 28: Spain Renewable Energy Market Volume (TW) Forecast, by Application 2019 & 2032
- Table 29: Belgium Renewable Energy Market Revenue (Trillion) Forecast, by Application 2019 & 2032
- Table 30: Belgium Renewable Energy Market Volume (TW) Forecast, by Application 2019 & 2032
- Table 31: Netherland Renewable Energy Market Revenue (Trillion) Forecast, by Application 2019 & 2032
- Table 32: Netherland Renewable Energy Market Volume (TW) Forecast, by Application 2019 & 2032
- Table 33: Nordics Renewable Energy Market Revenue (Trillion) Forecast, by Application 2019 & 2032
- Table 34: Nordics Renewable Energy Market Volume (TW) Forecast, by Application 2019 & 2032
- Table 35: Rest of Europe Renewable Energy Market Revenue (Trillion) Forecast, by Application 2019 & 2032
- Table 36: Rest of Europe Renewable Energy Market Volume (TW) Forecast, by Application 2019 & 2032
- Table 37: Global Renewable Energy Market Revenue Trillion Forecast, by Country 2019 & 2032
- Table 38: Global Renewable Energy Market Volume TW Forecast, by Country 2019 & 2032
- Table 39: China Renewable Energy Market Revenue (Trillion) Forecast, by Application 2019 & 2032
- Table 40: China Renewable Energy Market Volume (TW) Forecast, by Application 2019 & 2032
- Table 41: Japan Renewable Energy Market Revenue (Trillion) Forecast, by Application 2019 & 2032
- Table 42: Japan Renewable Energy Market Volume (TW) Forecast, by Application 2019 & 2032
- Table 43: India Renewable Energy Market Revenue (Trillion) Forecast, by Application 2019 & 2032
- Table 44: India Renewable Energy Market Volume (TW) Forecast, by Application 2019 & 2032
- Table 45: South Korea Renewable Energy Market Revenue (Trillion) Forecast, by Application 2019 & 2032
- Table 46: South Korea Renewable Energy Market Volume (TW) Forecast, by Application 2019 & 2032
- Table 47: Southeast Asia Renewable Energy Market Revenue (Trillion) Forecast, by Application 2019 & 2032
- Table 48: Southeast Asia Renewable Energy Market Volume (TW) Forecast, by Application 2019 & 2032
- Table 49: Australia Renewable Energy Market Revenue (Trillion) Forecast, by Application 2019 & 2032
- Table 50: Australia Renewable Energy Market Volume (TW) Forecast, by Application 2019 & 2032
- Table 51: Indonesia Renewable Energy Market Revenue (Trillion) Forecast, by Application 2019 & 2032
- Table 52: Indonesia Renewable Energy Market Volume (TW) Forecast, by Application 2019 & 2032
- Table 53: Phillipes Renewable Energy Market Revenue (Trillion) Forecast, by Application 2019 & 2032
- Table 54: Phillipes Renewable Energy Market Volume (TW) Forecast, by Application 2019 & 2032
- Table 55: Singapore Renewable Energy Market Revenue (Trillion) Forecast, by Application 2019 & 2032
- Table 56: Singapore Renewable Energy Market Volume (TW) Forecast, by Application 2019 & 2032
- Table 57: Thailandc Renewable Energy Market Revenue (Trillion) Forecast, by Application 2019 & 2032
- Table 58: Thailandc Renewable Energy Market Volume (TW) Forecast, by Application 2019 & 2032
- Table 59: Rest of Asia Pacific Renewable Energy Market Revenue (Trillion) Forecast, by Application 2019 & 2032
- Table 60: Rest of Asia Pacific Renewable Energy Market Volume (TW) Forecast, by Application 2019 & 2032
- Table 61: Global Renewable Energy Market Revenue Trillion Forecast, by Country 2019 & 2032
- Table 62: Global Renewable Energy Market Volume TW Forecast, by Country 2019 & 2032
- Table 63: Brazil Renewable Energy Market Revenue (Trillion) Forecast, by Application 2019 & 2032
- Table 64: Brazil Renewable Energy Market Volume (TW) Forecast, by Application 2019 & 2032
- Table 65: Argentina Renewable Energy Market Revenue (Trillion) Forecast, by Application 2019 & 2032
- Table 66: Argentina Renewable Energy Market Volume (TW) Forecast, by Application 2019 & 2032
- Table 67: Peru Renewable Energy Market Revenue (Trillion) Forecast, by Application 2019 & 2032
- Table 68: Peru Renewable Energy Market Volume (TW) Forecast, by Application 2019 & 2032
- Table 69: Chile Renewable Energy Market Revenue (Trillion) Forecast, by Application 2019 & 2032
- Table 70: Chile Renewable Energy Market Volume (TW) Forecast, by Application 2019 & 2032
- Table 71: Colombia Renewable Energy Market Revenue (Trillion) Forecast, by Application 2019 & 2032
- Table 72: Colombia Renewable Energy Market Volume (TW) Forecast, by Application 2019 & 2032
- Table 73: Ecuador Renewable Energy Market Revenue (Trillion) Forecast, by Application 2019 & 2032
- Table 74: Ecuador Renewable Energy Market Volume (TW) Forecast, by Application 2019 & 2032
- Table 75: Venezuela Renewable Energy Market Revenue (Trillion) Forecast, by Application 2019 & 2032
- Table 76: Venezuela Renewable Energy Market Volume (TW) Forecast, by Application 2019 & 2032
- Table 77: Rest of South America Renewable Energy Market Revenue (Trillion) Forecast, by Application 2019 & 2032
- Table 78: Rest of South America Renewable Energy Market Volume (TW) Forecast, by Application 2019 & 2032
- Table 79: Global Renewable Energy Market Revenue Trillion Forecast, by Country 2019 & 2032
- Table 80: Global Renewable Energy Market Volume TW Forecast, by Country 2019 & 2032
- Table 81: United States Renewable Energy Market Revenue (Trillion) Forecast, by Application 2019 & 2032
- Table 82: United States Renewable Energy Market Volume (TW) Forecast, by Application 2019 & 2032
- Table 83: Canada Renewable Energy Market Revenue (Trillion) Forecast, by Application 2019 & 2032
- Table 84: Canada Renewable Energy Market Volume (TW) Forecast, by Application 2019 & 2032
- Table 85: Mexico Renewable Energy Market Revenue (Trillion) Forecast, by Application 2019 & 2032
- Table 86: Mexico Renewable Energy Market Volume (TW) Forecast, by Application 2019 & 2032
- Table 87: Global Renewable Energy Market Revenue Trillion Forecast, by Country 2019 & 2032
- Table 88: Global Renewable Energy Market Volume TW Forecast, by Country 2019 & 2032
- Table 89: United Arab Emirates Renewable Energy Market Revenue (Trillion) Forecast, by Application 2019 & 2032
- Table 90: United Arab Emirates Renewable Energy Market Volume (TW) Forecast, by Application 2019 & 2032
- Table 91: Saudi Arabia Renewable Energy Market Revenue (Trillion) Forecast, by Application 2019 & 2032
- Table 92: Saudi Arabia Renewable Energy Market Volume (TW) Forecast, by Application 2019 & 2032
- Table 93: South Africa Renewable Energy Market Revenue (Trillion) Forecast, by Application 2019 & 2032
- Table 94: South Africa Renewable Energy Market Volume (TW) Forecast, by Application 2019 & 2032
- Table 95: Rest of Middle East and Africa Renewable Energy Market Revenue (Trillion) Forecast, by Application 2019 & 2032
- Table 96: Rest of Middle East and Africa Renewable Energy Market Volume (TW) Forecast, by Application 2019 & 2032
- Table 97: Global Renewable Energy Market Revenue Trillion Forecast, by Type 2019 & 2032
- Table 98: Global Renewable Energy Market Volume TW Forecast, by Type 2019 & 2032
- Table 99: Global Renewable Energy Market Revenue Trillion Forecast, by Country 2019 & 2032
- Table 100: Global Renewable Energy Market Volume TW Forecast, by Country 2019 & 2032
- Table 101: United States of America Renewable Energy Market Revenue (Trillion) Forecast, by Application 2019 & 2032
- Table 102: United States of America Renewable Energy Market Volume (TW) Forecast, by Application 2019 & 2032
- Table 103: Canada Renewable Energy Market Revenue (Trillion) Forecast, by Application 2019 & 2032
- Table 104: Canada Renewable Energy Market Volume (TW) Forecast, by Application 2019 & 2032
- Table 105: Rest of the North America Renewable Energy Market Revenue (Trillion) Forecast, by Application 2019 & 2032
- Table 106: Rest of the North America Renewable Energy Market Volume (TW) Forecast, by Application 2019 & 2032
- Table 107: Global Renewable Energy Market Revenue Trillion Forecast, by Type 2019 & 2032
- Table 108: Global Renewable Energy Market Volume TW Forecast, by Type 2019 & 2032
- Table 109: Global Renewable Energy Market Revenue Trillion Forecast, by Country 2019 & 2032
- Table 110: Global Renewable Energy Market Volume TW Forecast, by Country 2019 & 2032
- Table 111: United Kingdom Renewable Energy Market Revenue (Trillion) Forecast, by Application 2019 & 2032
- Table 112: United Kingdom Renewable Energy Market Volume (TW) Forecast, by Application 2019 & 2032
- Table 113: Germany Renewable Energy Market Revenue (Trillion) Forecast, by Application 2019 & 2032
- Table 114: Germany Renewable Energy Market Volume (TW) Forecast, by Application 2019 & 2032
- Table 115: France Renewable Energy Market Revenue (Trillion) Forecast, by Application 2019 & 2032
- Table 116: France Renewable Energy Market Volume (TW) Forecast, by Application 2019 & 2032
- Table 117: Spain Renewable Energy Market Revenue (Trillion) Forecast, by Application 2019 & 2032
- Table 118: Spain Renewable Energy Market Volume (TW) Forecast, by Application 2019 & 2032
- Table 119: NORDIC Renewable Energy Market Revenue (Trillion) Forecast, by Application 2019 & 2032
- Table 120: NORDIC Renewable Energy Market Volume (TW) Forecast, by Application 2019 & 2032
- Table 121: Turkey Renewable Energy Market Revenue (Trillion) Forecast, by Application 2019 & 2032
- Table 122: Turkey Renewable Energy Market Volume (TW) Forecast, by Application 2019 & 2032
- Table 123: Russia Renewable Energy Market Revenue (Trillion) Forecast, by Application 2019 & 2032
- Table 124: Russia Renewable Energy Market Volume (TW) Forecast, by Application 2019 & 2032
- Table 125: Rest of the Europe Renewable Energy Market Revenue (Trillion) Forecast, by Application 2019 & 2032
- Table 126: Rest of the Europe Renewable Energy Market Volume (TW) Forecast, by Application 2019 & 2032
- Table 127: Global Renewable Energy Market Revenue Trillion Forecast, by Type 2019 & 2032
- Table 128: Global Renewable Energy Market Volume TW Forecast, by Type 2019 & 2032
- Table 129: Global Renewable Energy Market Revenue Trillion Forecast, by Country 2019 & 2032
- Table 130: Global Renewable Energy Market Volume TW Forecast, by Country 2019 & 2032
- Table 131: China Renewable Energy Market Revenue (Trillion) Forecast, by Application 2019 & 2032
- Table 132: China Renewable Energy Market Volume (TW) Forecast, by Application 2019 & 2032
- Table 133: India Renewable Energy Market Revenue (Trillion) Forecast, by Application 2019 & 2032
- Table 134: India Renewable Energy Market Volume (TW) Forecast, by Application 2019 & 2032
- Table 135: Japan Renewable Energy Market Revenue (Trillion) Forecast, by Application 2019 & 2032
- Table 136: Japan Renewable Energy Market Volume (TW) Forecast, by Application 2019 & 2032
- Table 137: Malaysia Renewable Energy Market Revenue (Trillion) Forecast, by Application 2019 & 2032
- Table 138: Malaysia Renewable Energy Market Volume (TW) Forecast, by Application 2019 & 2032
- Table 139: Thailand Renewable Energy Market Revenue (Trillion) Forecast, by Application 2019 & 2032
- Table 140: Thailand Renewable Energy Market Volume (TW) Forecast, by Application 2019 & 2032
- Table 141: Indonesia Renewable Energy Market Revenue (Trillion) Forecast, by Application 2019 & 2032
- Table 142: Indonesia Renewable Energy Market Volume (TW) Forecast, by Application 2019 & 2032
- Table 143: Vietnam Renewable Energy Market Revenue (Trillion) Forecast, by Application 2019 & 2032
- Table 144: Vietnam Renewable Energy Market Volume (TW) Forecast, by Application 2019 & 2032
- Table 145: Rest of Asia Pacific Renewable Energy Market Revenue (Trillion) Forecast, by Application 2019 & 2032
- Table 146: Rest of Asia Pacific Renewable Energy Market Volume (TW) Forecast, by Application 2019 & 2032
- Table 147: Global Renewable Energy Market Revenue Trillion Forecast, by Type 2019 & 2032
- Table 148: Global Renewable Energy Market Volume TW Forecast, by Type 2019 & 2032
- Table 149: Global Renewable Energy Market Revenue Trillion Forecast, by Country 2019 & 2032
- Table 150: Global Renewable Energy Market Volume TW Forecast, by Country 2019 & 2032
- Table 151: United Arab Emirates Renewable Energy Market Revenue (Trillion) Forecast, by Application 2019 & 2032
- Table 152: United Arab Emirates Renewable Energy Market Volume (TW) Forecast, by Application 2019 & 2032
- Table 153: Saudi Arabia Renewable Energy Market Revenue (Trillion) Forecast, by Application 2019 & 2032
- Table 154: Saudi Arabia Renewable Energy Market Volume (TW) Forecast, by Application 2019 & 2032
- Table 155: Egypt Renewable Energy Market Revenue (Trillion) Forecast, by Application 2019 & 2032
- Table 156: Egypt Renewable Energy Market Volume (TW) Forecast, by Application 2019 & 2032
- Table 157: Nigeria Renewable Energy Market Revenue (Trillion) Forecast, by Application 2019 & 2032
- Table 158: Nigeria Renewable Energy Market Volume (TW) Forecast, by Application 2019 & 2032
- Table 159: South Africa Renewable Energy Market Revenue (Trillion) Forecast, by Application 2019 & 2032
- Table 160: South Africa Renewable Energy Market Volume (TW) Forecast, by Application 2019 & 2032
- Table 161: Qatar Renewable Energy Market Revenue (Trillion) Forecast, by Application 2019 & 2032
- Table 162: Qatar Renewable Energy Market Volume (TW) Forecast, by Application 2019 & 2032
- Table 163: Rest of the Middle East and Africa Renewable Energy Market Revenue (Trillion) Forecast, by Application 2019 & 2032
- Table 164: Rest of the Middle East and Africa Renewable Energy Market Volume (TW) Forecast, by Application 2019 & 2032
- Table 165: Global Renewable Energy Market Revenue Trillion Forecast, by Type 2019 & 2032
- Table 166: Global Renewable Energy Market Volume TW Forecast, by Type 2019 & 2032
- Table 167: Global Renewable Energy Market Revenue Trillion Forecast, by Country 2019 & 2032
- Table 168: Global Renewable Energy Market Volume TW Forecast, by Country 2019 & 2032
- Table 169: Brazil Renewable Energy Market Revenue (Trillion) Forecast, by Application 2019 & 2032
- Table 170: Brazil Renewable Energy Market Volume (TW) Forecast, by Application 2019 & 2032
- Table 171: Argentina Renewable Energy Market Revenue (Trillion) Forecast, by Application 2019 & 2032
- Table 172: Argentina Renewable Energy Market Volume (TW) Forecast, by Application 2019 & 2032
- Table 173: Colombia Renewable Energy Market Revenue (Trillion) Forecast, by Application 2019 & 2032
- Table 174: Colombia Renewable Energy Market Volume (TW) Forecast, by Application 2019 & 2032
- Table 175: Rest of the South America Renewable Energy Market Revenue (Trillion) Forecast, by Application 2019 & 2032
- Table 176: Rest of the South America Renewable Energy Market Volume (TW) Forecast, by Application 2019 & 2032
Frequently Asked Questions
1. What is the projected Compound Annual Growth Rate (CAGR) of the Renewable Energy Market?
The projected CAGR is approximately 7.09%.
2. Which companies are prominent players in the Renewable Energy Market?
Key companies in the market include 4 Jinko Solar Holding Co Ltd, 2 EDF SA, 2 Vestas Wind Systems AS, 1 First Solar Inc, 5 Berkshire Hathway Energy, Equipment Suppliers, 1 Orsted AS, EPC Developers/Operators/Owners, 3 Canadian Solar Inc, 4 Duke Energy Corporation, 6 Acciona Energia SA, 3 NextEra Energy Inc, 5 General Electric Company, 6 Siemens Gamesa Renewable Energy SA*List Not Exhaustive 6 4 Market Ranking/Share (%) Analysi.
3. What are the main segments of the Renewable Energy Market?
The market segments include Type.
4. Can you provide details about the market size?
The market size is estimated to be USD 1.32 Trillion as of 2022.
5. What are some drivers contributing to market growth?
4.; Favorable Government Policies for Renewable Energy4.; The Declining Price of Solar Panels and Wind Turbine Installations4.; Increasing Investments in Hydropower and Pumped Storage Hydropower Projects4.; Growing Emphasis on Geothermal Energy.
6. What are the notable trends driving market growth?
Hydropower Segment is Expected to Dominate the Market during the Forecast Period.
7. Are there any restraints impacting market growth?
4.; Increasing Penetration of Natural Gas for Power Generation.
8. Can you provide examples of recent developments in the market?
April 2023: ArcelorMittal announced that the company's Brazilian entity, ArcelorMittal Brazil, formed a joint venture with the Brazilian renewable energy company Casa dos Ventos to develop the 554 MW Babilonia wind power project. The project is expected to be developed at a cost of USD 800 million and will be located in the central region of Bahia, northeast Brazil. ArcelorMittal is anticipated to hold a 55% share in the joint venture, and the remaining share will be held by Casa dos Ventos.
9. What pricing options are available for accessing the report?
Pricing options include single-user, multi-user, and enterprise licenses priced at USD 4750, USD 5250, and USD 8750 respectively.
10. Is the market size provided in terms of value or volume?
The market size is provided in terms of value, measured in Trillion and volume, measured in TW.
11. Are there any specific market keywords associated with the report?
Yes, the market keyword associated with the report is "Renewable Energy Market," which aids in identifying and referencing the specific market segment covered.
12. How do I determine which pricing option suits my needs best?
The pricing options vary based on user requirements and access needs. Individual users may opt for single-user licenses, while businesses requiring broader access may choose multi-user or enterprise licenses for cost-effective access to the report.
13. Are there any additional resources or data provided in the Renewable Energy Market report?
While the report offers comprehensive insights, it's advisable to review the specific contents or supplementary materials provided to ascertain if additional resources or data are available.
14. How can I stay updated on further developments or reports in the Renewable Energy Market?
To stay informed about further developments, trends, and reports in the Renewable Energy Market, consider subscribing to industry newsletters, following relevant companies and organizations, or regularly checking reputable industry news sources and publications.
Methodology
Step 1 - Identification of Relevant Samples Size from Population Database


Step 2 - Approaches for Defining Global Market Size (Value, Volume* & Price*)

Note*: In applicable scenarios
Step 3 - Data Sources
Primary Research
- Web Analytics
- Survey Reports
- Research Institute
- Latest Research Reports
- Opinion Leaders
Secondary Research
- Annual Reports
- White Paper
- Latest Press Release
- Industry Association
- Paid Database
- Investor Presentations

Step 4 - Data Triangulation
Involves using different sources of information in order to increase the validity of a study
These sources are likely to be stakeholders in a program - participants, other researchers, program staff, other community members, and so on.
Then we put all data in single framework & apply various statistical tools to find out the dynamic on the market.
During the analysis stage, feedback from the stakeholder groups would be compared to determine areas of agreement as well as areas of divergence


