
Key Insights
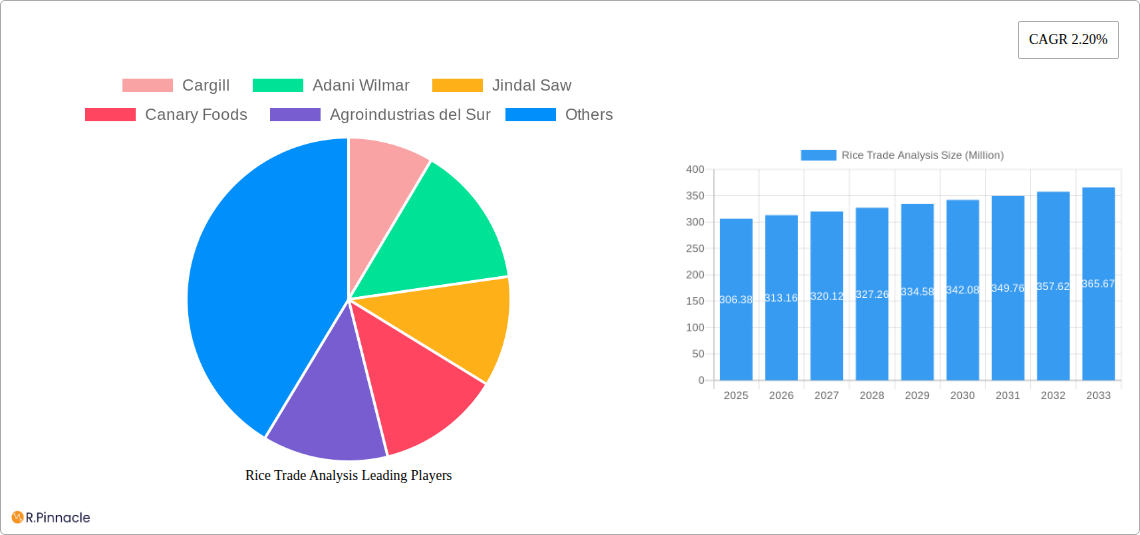
The global rice trade, valued at $306.38 billion in 2025, is projected to experience steady growth, exhibiting a Compound Annual Growth Rate (CAGR) of 2.20% from 2025 to 2033. This growth is driven by several factors. Rising global populations and increasing demand for staple foods, particularly in developing nations, fuel significant consumption. The burgeoning food processing industry, which utilizes rice in a wide range of products, contributes substantially to market expansion. Furthermore, the growing preference for convenient and readily available processed food products further bolsters demand. While the market enjoys positive momentum, certain constraints exist. Fluctuations in agricultural yields due to climatic changes and the increasing price volatility of rice are challenges to consistent growth. Moreover, evolving consumer preferences towards healthier and more diverse dietary options might subtly impact the market share of conventional rice varieties. The market is segmented by type (Hybrid Rice, Non-Basmati Rice, Specialty Rice – including organic and aromatic varieties) and application (Food Processing, Household Consumption, Livestock Feed). Major players such as Cargill, Adani Wilmar, and KRBL Ltd., along with regional producers, actively compete in this dynamic market. Geographical variations in consumption patterns and production capabilities result in differing regional market sizes and growth trajectories, with Asia-Pacific expected to maintain a significant market share due to its high production and consumption levels.
The competitive landscape includes both large multinational corporations and smaller regional players. Successful companies are likely to adopt strategies focused on sustainable and efficient production methods, innovation in product offerings (e.g., fortified or functional rice), and diversification across regions to mitigate risk. Market penetration strategies in developing economies, coupled with investment in research and development to enhance yield and quality, will be crucial for companies aiming to secure a larger market share in the long term. Growth within the specialty rice segment, specifically organic and aromatic varieties, presents a particularly promising avenue for future expansion, driven by increasing health consciousness and consumer willingness to pay a premium for higher quality and sustainably produced products. Understanding regional nuances and adapting strategies accordingly will be vital to navigating the complexities of the global rice trade and maximizing returns.
Rice Trade Analysis: A Comprehensive Market Report (2019-2033)
This in-depth Rice Trade Analysis report provides a comprehensive overview of the global rice market, covering historical data (2019-2024), current market dynamics (2025), and future projections (2025-2033). The report analyzes key market segments, dominant players, and emerging trends, offering actionable insights for industry professionals. With a focus on market size (in Millions), market share, CAGR, and major industry developments, this report is an invaluable resource for strategic decision-making. Base Year: 2025; Estimated Year: 2025; Forecast Period: 2025-2033.
Rice Trade Analysis Market Structure & Innovation Trends
This section analyzes the competitive landscape of the rice market, encompassing market concentration, innovation drivers, regulatory frameworks, product substitutes, end-user demographics, and mergers and acquisitions (M&A) activities. The global rice market exhibits a moderately concentrated structure, with a few major players holding significant market share. Cargill, Adani Wilmar, and KRBL Ltd. are among the leading companies, collectively accounting for an estimated xx% of the global market share in 2025. Innovation in rice production is driven by factors such as technological advancements in seed technology (hybrid rice development), precision agriculture techniques, and improved processing technologies. Regulatory frameworks, varying across different countries, significantly influence trade patterns and pricing. Key substitutes for rice include other grains like wheat, maize, and millets, impacting market demand. End-user demographics show a substantial preference for specialty rice varieties (organic, aromatic) among higher-income consumer groups. M&A activity in the rice industry has been moderate in recent years, with deal values averaging approximately xx Million annually. The following list details additional factors influencing the market structure:
- Market Concentration: High concentration in certain regions, with fragmented markets in others.
- Innovation Drivers: Technological advancements in cultivation, processing, and packaging.
- Regulatory Frameworks: Export restrictions, tariffs, and food safety regulations.
- Product Substitutes: Wheat, maize, and other grains.
- End-User Demographics: Growing demand for specialty rice and value-added products.
- M&A Activities: Consolidation among large players, with several notable acquisitions in recent years, totaling xx Million.
Rice Trade Analysis Market Dynamics & Trends
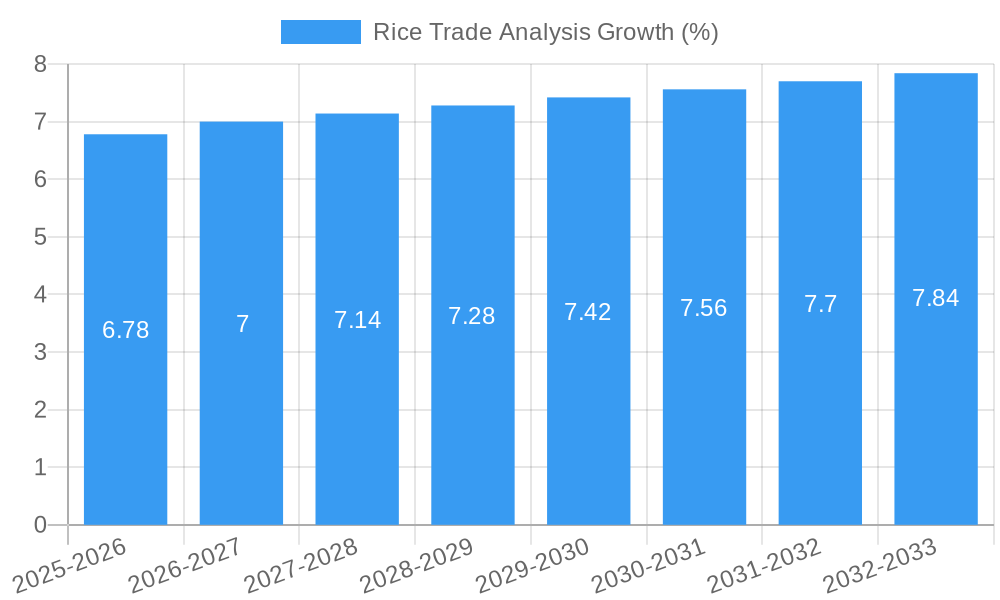
This section delves into the factors driving market growth, technological disruptions, consumer preferences, and competitive dynamics in the rice trade market. The global rice market is expected to witness a CAGR of xx% during the forecast period (2025-2033). Key growth drivers include increasing global population, rising disposable incomes, particularly in developing economies, and a shift toward healthier and convenient food choices. Technological advancements in rice cultivation and processing are leading to increased yields, reduced production costs, and enhanced product quality. Consumer preferences are increasingly focusing on specialty rice varieties like organic, aromatic, and hybrid rice, driving segment-specific growth. Competitive dynamics are characterized by intense rivalry among major players, focusing on product differentiation, branding, and geographical expansion. Market penetration of specialty rice varieties is growing, with an estimated xx% market share in 2025. Significant factors influencing the market include:
- Growth Drivers: Rising population, increasing disposable incomes, and changing dietary habits.
- Technological Disruptions: Advancements in seed technology, precision agriculture, and processing.
- Consumer Preferences: Growing demand for specialty rice varieties, organic rice, and value-added products.
- Competitive Dynamics: Intense competition among major players, focused on innovation, marketing, and distribution.
Dominant Regions & Segments in Rice Trade Analysis
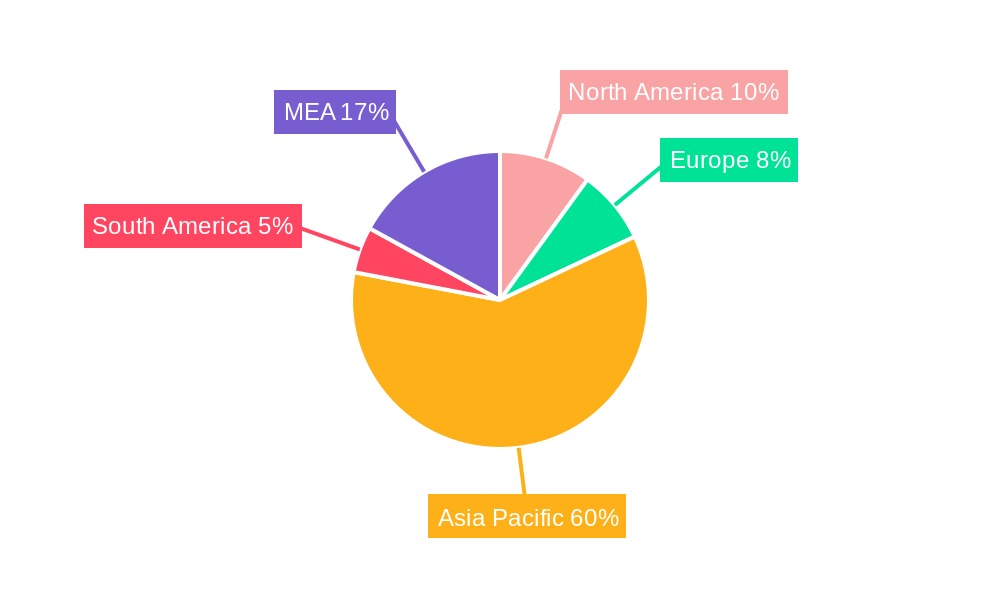
This section identifies the leading regions and segments within the rice market, categorized by type (Hybrid Rice, Non-Basmati Rice, Specialty Rice) and application (Food Processing, Household Consumption, Livestock Feed). Asia remains the dominant region, accounting for over xx% of global rice production and consumption. Within Asia, India and China are the leading producers and consumers. The high population density, large agricultural land area, and favorable climatic conditions contribute to this dominance. Key drivers for specific segments:
- By Type:
- Hybrid Rice: High yield potential, disease resistance, and improved quality are driving growth.
- Non-Basmati Rice: Cost-effectiveness and wide availability contribute to high volume consumption.
- Specialty Rice (Organic, Aromatic): Growing consumer demand for premium quality and health benefits fuels high growth.
- By Application:
- Food Processing: Large-scale industrial processing fuels demand.
- Household Consumption: Primary end-use segment, driven by population growth and dietary habits.
- Livestock Feed: Significant use in animal feed, especially in regions with high livestock populations.
The dominance of Asia is further bolstered by supportive government policies, robust infrastructure, and established supply chains. Other regions show increasing production, but Asia's existing infrastructure provides a competitive edge. Specific details on market shares for each region and segment will be provided in the full report.
Rice Trade Analysis Product Innovations
Recent years have witnessed significant innovations in rice production and processing, focusing on developing high-yielding hybrid varieties, improving grain quality, and enhancing the nutritional content of rice. Technological advancements such as precision agriculture, drone technology for monitoring crops, and automated harvesting systems are increasing efficiency and productivity. These innovations are tailored to meet evolving consumer preferences for specialty rice varieties, functional foods, and convenient packaging formats. The market is witnessing a trend toward fortified rice, aiming to address micronutrient deficiencies.
Report Scope & Segmentation Analysis
This report comprehensively analyzes the rice market, segmented by type (Hybrid Rice, Non-Basmati Rice, Specialty Rice – including Organic and Aromatic) and application (Food Processing, Household Consumption, Livestock Feed). Each segment is analyzed based on historical data, current market size, future growth projections, and competitive dynamics. The growth rate of each segment varies, with specialty rice experiencing the highest growth due to increasing consumer preference for premium and value-added products. Competitive dynamics are influenced by factors such as brand reputation, distribution channels, and pricing strategies.
Key Drivers of Rice Trade Analysis Growth
The growth of the rice trade market is driven by several factors, including the rising global population, particularly in developing countries, leading to increased demand. Furthermore, increasing disposable incomes in many regions fuel the demand for higher-quality and specialty rice varieties. Government policies, such as subsidies and trade agreements, also play a crucial role in shaping market dynamics. Technological advancements in agriculture and processing contribute to higher yields and improved product quality, boosting production and overall market growth.
Challenges in the Rice Trade Analysis Sector
The rice trade sector faces several challenges, including climate change impacting yields and unpredictable weather patterns. Supply chain disruptions, particularly during times of geopolitical instability, contribute to price volatility and shortages. Furthermore, intense competition among numerous players can result in price wars and reduced profit margins. Stricter regulations on food safety and quality standards increase production costs for many producers.
Emerging Opportunities in Rice Trade Analysis
Emerging opportunities lie in the growing demand for organic and specialty rice varieties, as consumers are increasingly health-conscious and willing to pay a premium for higher-quality products. Furthermore, innovations in food processing technology are creating opportunities for value-added rice products, such as ready-to-eat meals and convenience foods. Expanding into new markets, particularly in developing countries with a rapidly growing middle class, presents significant potential for growth.
Leading Players in the Rice Trade Analysis Market
- Cargill Cargill
- Adani Wilmar Adani Wilmar
- Jindal Saw
- Canary Foods
- Agroindustrias del Sur
- Saurer
- KRBL Ltd KRBL Ltd
- Vigoro
- Thai Binh Rice
- Agroindustrial Rueda
Key Developments in Rice Trade Analysis Industry
- September 2022: India banned the export of broken rice and imposed a 20% export duty on non-basmati rice, significantly impacting global supply and prices.
- August 2022: The Indian government's decision to procure 51.8 Million tons of rice influenced domestic prices and market stability.
- February 2022: China's minimum pricing policy for rice impacted international trade flows and pricing dynamics for certain rice varieties.
Future Outlook for Rice Trade Analysis Market
The future of the rice trade market is promising, driven by sustained population growth, rising incomes, and increasing demand for high-quality rice products. The market will continue to see significant growth in the demand for specialty rice varieties, organic rice, and functional foods. Technological innovations and strategic partnerships will play a vital role in shaping future market dynamics, with a focus on sustainability and efficiency.
Rice Trade Analysis Segmentation
- 1. Production Analysis
- 2. Consumption Analysis
- 3. Import Market Analysis (Value & Volume)
- 4. Export Market Analysis (Value & Volume)
- 5. Price Trend Analysis
Rice Trade Analysis Segmentation By Geography
-
1. North America
- 1.1. United States
- 1.2. Canada
-
2. Europe
- 2.1. France
- 2.2. United Kingdom
- 2.3. Germany
- 2.4. Italy
- 2.5. Spain
-
3. Asia Pacific
- 3.1. China
- 3.2. India
- 3.3. Thailand
- 3.4. Vietnam
- 3.5. Pakistan
-
4. South America
- 4.1. Brazil
- 4.2. Argentina
-
5. Africa
- 5.1. South Africa
Rice Trade Analysis REPORT HIGHLIGHTS
| Aspects | Details |
|---|---|
| Study Period | 2019-2033 |
| Base Year | 2024 |
| Estimated Year | 2025 |
| Forecast Period | 2025-2033 |
| Historical Period | 2019-2024 |
| Growth Rate | CAGR of 2.20% from 2019-2033 |
| Segmentation |
|
Table of Contents
- 1. Introduction
- 1.1. Research Scope
- 1.2. Market Segmentation
- 1.3. Research Methodology
- 1.4. Definitions and Assumptions
- 2. Executive Summary
- 2.1. Introduction
- 3. Market Dynamics
- 3.1. Introduction
- 3.2. Market Drivers
- 3.3. Market Restrains
- 3.4. Market Trends
- 3.4.1. Favorable Trade Policies
- 4. Market Factor Analysis
- 4.1. Porters Five Forces
- 4.2. Supply/Value Chain
- 4.3. PESTEL analysis
- 4.4. Market Entropy
- 4.5. Patent/Trademark Analysis
- 5. Global Rice Trade Analysis Analysis, Insights and Forecast, 2019-2031
- 5.1. Market Analysis, Insights and Forecast - by Production Analysis
- 5.2. Market Analysis, Insights and Forecast - by Consumption Analysis
- 5.3. Market Analysis, Insights and Forecast - by Import Market Analysis (Value & Volume)
- 5.4. Market Analysis, Insights and Forecast - by Export Market Analysis (Value & Volume)
- 5.5. Market Analysis, Insights and Forecast - by Price Trend Analysis
- 5.6. Market Analysis, Insights and Forecast - by Region
- 5.6.1. North America
- 5.6.2. Europe
- 5.6.3. Asia Pacific
- 5.6.4. South America
- 5.6.5. Africa
- 5.1. Market Analysis, Insights and Forecast - by Production Analysis
- 6. North America Rice Trade Analysis Analysis, Insights and Forecast, 2019-2031
- 6.1. Market Analysis, Insights and Forecast - by Production Analysis
- 6.2. Market Analysis, Insights and Forecast - by Consumption Analysis
- 6.3. Market Analysis, Insights and Forecast - by Import Market Analysis (Value & Volume)
- 6.4. Market Analysis, Insights and Forecast - by Export Market Analysis (Value & Volume)
- 6.5. Market Analysis, Insights and Forecast - by Price Trend Analysis
- 6.1. Market Analysis, Insights and Forecast - by Production Analysis
- 7. Europe Rice Trade Analysis Analysis, Insights and Forecast, 2019-2031
- 7.1. Market Analysis, Insights and Forecast - by Production Analysis
- 7.2. Market Analysis, Insights and Forecast - by Consumption Analysis
- 7.3. Market Analysis, Insights and Forecast - by Import Market Analysis (Value & Volume)
- 7.4. Market Analysis, Insights and Forecast - by Export Market Analysis (Value & Volume)
- 7.5. Market Analysis, Insights and Forecast - by Price Trend Analysis
- 7.1. Market Analysis, Insights and Forecast - by Production Analysis
- 8. Asia Pacific Rice Trade Analysis Analysis, Insights and Forecast, 2019-2031
- 8.1. Market Analysis, Insights and Forecast - by Production Analysis
- 8.2. Market Analysis, Insights and Forecast - by Consumption Analysis
- 8.3. Market Analysis, Insights and Forecast - by Import Market Analysis (Value & Volume)
- 8.4. Market Analysis, Insights and Forecast - by Export Market Analysis (Value & Volume)
- 8.5. Market Analysis, Insights and Forecast - by Price Trend Analysis
- 8.1. Market Analysis, Insights and Forecast - by Production Analysis
- 9. South America Rice Trade Analysis Analysis, Insights and Forecast, 2019-2031
- 9.1. Market Analysis, Insights and Forecast - by Production Analysis
- 9.2. Market Analysis, Insights and Forecast - by Consumption Analysis
- 9.3. Market Analysis, Insights and Forecast - by Import Market Analysis (Value & Volume)
- 9.4. Market Analysis, Insights and Forecast - by Export Market Analysis (Value & Volume)
- 9.5. Market Analysis, Insights and Forecast - by Price Trend Analysis
- 9.1. Market Analysis, Insights and Forecast - by Production Analysis
- 10. Africa Rice Trade Analysis Analysis, Insights and Forecast, 2019-2031
- 10.1. Market Analysis, Insights and Forecast - by Production Analysis
- 10.2. Market Analysis, Insights and Forecast - by Consumption Analysis
- 10.3. Market Analysis, Insights and Forecast - by Import Market Analysis (Value & Volume)
- 10.4. Market Analysis, Insights and Forecast - by Export Market Analysis (Value & Volume)
- 10.5. Market Analysis, Insights and Forecast - by Price Trend Analysis
- 10.1. Market Analysis, Insights and Forecast - by Production Analysis
- 11. South America Rice Trade Analysis Analysis, Insights and Forecast, 2019-2031
- 11.1. Market Analysis, Insights and Forecast - By Country/Sub-region
- 11.1.1 Brazil
- 11.1.2 Argentina
- 11.1.3 Rest of South America
- 12. North America Rice Trade Analysis Analysis, Insights and Forecast, 2019-2031
- 12.1. Market Analysis, Insights and Forecast - By Country/Sub-region
- 12.1.1 United States
- 12.1.2 Canada
- 12.1.3 Mexico
- 13. Asia Pacific Rice Trade Analysis Analysis, Insights and Forecast, 2019-2031
- 13.1. Market Analysis, Insights and Forecast - By Country/Sub-region
- 13.1.1 China
- 13.1.2 Japan
- 13.1.3 India
- 13.1.4 South Korea
- 13.1.5 Taiwan
- 13.1.6 Australia
- 13.1.7 Rest of Asia-Pacific
- 14. Europe Rice Trade Analysis Analysis, Insights and Forecast, 2019-2031
- 14.1. Market Analysis, Insights and Forecast - By Country/Sub-region
- 14.1.1 Germany
- 14.1.2 France
- 14.1.3 Italy
- 14.1.4 United Kingdom
- 14.1.5 Netherlands
- 14.1.6 Rest of Europe
- 15. MEA Rice Trade Analysis Analysis, Insights and Forecast, 2019-2031
- 15.1. Market Analysis, Insights and Forecast - By Country/Sub-region
- 15.1.1 Middle East
- 15.1.2 Africa
- 16. Competitive Analysis
- 16.1. Global Market Share Analysis 2024
- 16.2. Company Profiles
- 16.2.1 Cargill
- 16.2.1.1. Overview
- 16.2.1.2. Products
- 16.2.1.3. SWOT Analysis
- 16.2.1.4. Recent Developments
- 16.2.1.5. Financials (Based on Availability)
- 16.2.2 Adani Wilmar
- 16.2.2.1. Overview
- 16.2.2.2. Products
- 16.2.2.3. SWOT Analysis
- 16.2.2.4. Recent Developments
- 16.2.2.5. Financials (Based on Availability)
- 16.2.3 Jindal Saw
- 16.2.3.1. Overview
- 16.2.3.2. Products
- 16.2.3.3. SWOT Analysis
- 16.2.3.4. Recent Developments
- 16.2.3.5. Financials (Based on Availability)
- 16.2.4 Canary Foods
- 16.2.4.1. Overview
- 16.2.4.2. Products
- 16.2.4.3. SWOT Analysis
- 16.2.4.4. Recent Developments
- 16.2.4.5. Financials (Based on Availability)
- 16.2.5 Agroindustrias del Sur
- 16.2.5.1. Overview
- 16.2.5.2. Products
- 16.2.5.3. SWOT Analysis
- 16.2.5.4. Recent Developments
- 16.2.5.5. Financials (Based on Availability)
- 16.2.6 Saurer
- 16.2.6.1. Overview
- 16.2.6.2. Products
- 16.2.6.3. SWOT Analysis
- 16.2.6.4. Recent Developments
- 16.2.6.5. Financials (Based on Availability)
- 16.2.7 KRBL Ltd
- 16.2.7.1. Overview
- 16.2.7.2. Products
- 16.2.7.3. SWOT Analysis
- 16.2.7.4. Recent Developments
- 16.2.7.5. Financials (Based on Availability)
- 16.2.8 Vigoro
- 16.2.8.1. Overview
- 16.2.8.2. Products
- 16.2.8.3. SWOT Analysis
- 16.2.8.4. Recent Developments
- 16.2.8.5. Financials (Based on Availability)
- 16.2.9 Thai Binh Rice
- 16.2.9.1. Overview
- 16.2.9.2. Products
- 16.2.9.3. SWOT Analysis
- 16.2.9.4. Recent Developments
- 16.2.9.5. Financials (Based on Availability)
- 16.2.10 Agroindustrial Rueda
- 16.2.10.1. Overview
- 16.2.10.2. Products
- 16.2.10.3. SWOT Analysis
- 16.2.10.4. Recent Developments
- 16.2.10.5. Financials (Based on Availability)
- 16.2.1 Cargill
List of Figures
- Figure 1: Global Rice Trade Analysis Revenue Breakdown (Million, %) by Region 2024 & 2032
- Figure 2: Global Rice Trade Analysis Volume Breakdown (Kiloton, %) by Region 2024 & 2032
- Figure 3: South America Rice Trade Analysis Revenue (Million), by Country 2024 & 2032
- Figure 4: South America Rice Trade Analysis Volume (Kiloton), by Country 2024 & 2032
- Figure 5: South America Rice Trade Analysis Revenue Share (%), by Country 2024 & 2032
- Figure 6: South America Rice Trade Analysis Volume Share (%), by Country 2024 & 2032
- Figure 7: North America Rice Trade Analysis Revenue (Million), by Country 2024 & 2032
- Figure 8: North America Rice Trade Analysis Volume (Kiloton), by Country 2024 & 2032
- Figure 9: North America Rice Trade Analysis Revenue Share (%), by Country 2024 & 2032
- Figure 10: North America Rice Trade Analysis Volume Share (%), by Country 2024 & 2032
- Figure 11: Asia Pacific Rice Trade Analysis Revenue (Million), by Country 2024 & 2032
- Figure 12: Asia Pacific Rice Trade Analysis Volume (Kiloton), by Country 2024 & 2032
- Figure 13: Asia Pacific Rice Trade Analysis Revenue Share (%), by Country 2024 & 2032
- Figure 14: Asia Pacific Rice Trade Analysis Volume Share (%), by Country 2024 & 2032
- Figure 15: Europe Rice Trade Analysis Revenue (Million), by Country 2024 & 2032
- Figure 16: Europe Rice Trade Analysis Volume (Kiloton), by Country 2024 & 2032
- Figure 17: Europe Rice Trade Analysis Revenue Share (%), by Country 2024 & 2032
- Figure 18: Europe Rice Trade Analysis Volume Share (%), by Country 2024 & 2032
- Figure 19: MEA Rice Trade Analysis Revenue (Million), by Country 2024 & 2032
- Figure 20: MEA Rice Trade Analysis Volume (Kiloton), by Country 2024 & 2032
- Figure 21: MEA Rice Trade Analysis Revenue Share (%), by Country 2024 & 2032
- Figure 22: MEA Rice Trade Analysis Volume Share (%), by Country 2024 & 2032
- Figure 23: North America Rice Trade Analysis Revenue (Million), by Production Analysis 2024 & 2032
- Figure 24: North America Rice Trade Analysis Volume (Kiloton), by Production Analysis 2024 & 2032
- Figure 25: North America Rice Trade Analysis Revenue Share (%), by Production Analysis 2024 & 2032
- Figure 26: North America Rice Trade Analysis Volume Share (%), by Production Analysis 2024 & 2032
- Figure 27: North America Rice Trade Analysis Revenue (Million), by Consumption Analysis 2024 & 2032
- Figure 28: North America Rice Trade Analysis Volume (Kiloton), by Consumption Analysis 2024 & 2032
- Figure 29: North America Rice Trade Analysis Revenue Share (%), by Consumption Analysis 2024 & 2032
- Figure 30: North America Rice Trade Analysis Volume Share (%), by Consumption Analysis 2024 & 2032
- Figure 31: North America Rice Trade Analysis Revenue (Million), by Import Market Analysis (Value & Volume) 2024 & 2032
- Figure 32: North America Rice Trade Analysis Volume (Kiloton), by Import Market Analysis (Value & Volume) 2024 & 2032
- Figure 33: North America Rice Trade Analysis Revenue Share (%), by Import Market Analysis (Value & Volume) 2024 & 2032
- Figure 34: North America Rice Trade Analysis Volume Share (%), by Import Market Analysis (Value & Volume) 2024 & 2032
- Figure 35: North America Rice Trade Analysis Revenue (Million), by Export Market Analysis (Value & Volume) 2024 & 2032
- Figure 36: North America Rice Trade Analysis Volume (Kiloton), by Export Market Analysis (Value & Volume) 2024 & 2032
- Figure 37: North America Rice Trade Analysis Revenue Share (%), by Export Market Analysis (Value & Volume) 2024 & 2032
- Figure 38: North America Rice Trade Analysis Volume Share (%), by Export Market Analysis (Value & Volume) 2024 & 2032
- Figure 39: North America Rice Trade Analysis Revenue (Million), by Price Trend Analysis 2024 & 2032
- Figure 40: North America Rice Trade Analysis Volume (Kiloton), by Price Trend Analysis 2024 & 2032
- Figure 41: North America Rice Trade Analysis Revenue Share (%), by Price Trend Analysis 2024 & 2032
- Figure 42: North America Rice Trade Analysis Volume Share (%), by Price Trend Analysis 2024 & 2032
- Figure 43: North America Rice Trade Analysis Revenue (Million), by Country 2024 & 2032
- Figure 44: North America Rice Trade Analysis Volume (Kiloton), by Country 2024 & 2032
- Figure 45: North America Rice Trade Analysis Revenue Share (%), by Country 2024 & 2032
- Figure 46: North America Rice Trade Analysis Volume Share (%), by Country 2024 & 2032
- Figure 47: Europe Rice Trade Analysis Revenue (Million), by Production Analysis 2024 & 2032
- Figure 48: Europe Rice Trade Analysis Volume (Kiloton), by Production Analysis 2024 & 2032
- Figure 49: Europe Rice Trade Analysis Revenue Share (%), by Production Analysis 2024 & 2032
- Figure 50: Europe Rice Trade Analysis Volume Share (%), by Production Analysis 2024 & 2032
- Figure 51: Europe Rice Trade Analysis Revenue (Million), by Consumption Analysis 2024 & 2032
- Figure 52: Europe Rice Trade Analysis Volume (Kiloton), by Consumption Analysis 2024 & 2032
- Figure 53: Europe Rice Trade Analysis Revenue Share (%), by Consumption Analysis 2024 & 2032
- Figure 54: Europe Rice Trade Analysis Volume Share (%), by Consumption Analysis 2024 & 2032
- Figure 55: Europe Rice Trade Analysis Revenue (Million), by Import Market Analysis (Value & Volume) 2024 & 2032
- Figure 56: Europe Rice Trade Analysis Volume (Kiloton), by Import Market Analysis (Value & Volume) 2024 & 2032
- Figure 57: Europe Rice Trade Analysis Revenue Share (%), by Import Market Analysis (Value & Volume) 2024 & 2032
- Figure 58: Europe Rice Trade Analysis Volume Share (%), by Import Market Analysis (Value & Volume) 2024 & 2032
- Figure 59: Europe Rice Trade Analysis Revenue (Million), by Export Market Analysis (Value & Volume) 2024 & 2032
- Figure 60: Europe Rice Trade Analysis Volume (Kiloton), by Export Market Analysis (Value & Volume) 2024 & 2032
- Figure 61: Europe Rice Trade Analysis Revenue Share (%), by Export Market Analysis (Value & Volume) 2024 & 2032
- Figure 62: Europe Rice Trade Analysis Volume Share (%), by Export Market Analysis (Value & Volume) 2024 & 2032
- Figure 63: Europe Rice Trade Analysis Revenue (Million), by Price Trend Analysis 2024 & 2032
- Figure 64: Europe Rice Trade Analysis Volume (Kiloton), by Price Trend Analysis 2024 & 2032
- Figure 65: Europe Rice Trade Analysis Revenue Share (%), by Price Trend Analysis 2024 & 2032
- Figure 66: Europe Rice Trade Analysis Volume Share (%), by Price Trend Analysis 2024 & 2032
- Figure 67: Europe Rice Trade Analysis Revenue (Million), by Country 2024 & 2032
- Figure 68: Europe Rice Trade Analysis Volume (Kiloton), by Country 2024 & 2032
- Figure 69: Europe Rice Trade Analysis Revenue Share (%), by Country 2024 & 2032
- Figure 70: Europe Rice Trade Analysis Volume Share (%), by Country 2024 & 2032
- Figure 71: Asia Pacific Rice Trade Analysis Revenue (Million), by Production Analysis 2024 & 2032
- Figure 72: Asia Pacific Rice Trade Analysis Volume (Kiloton), by Production Analysis 2024 & 2032
- Figure 73: Asia Pacific Rice Trade Analysis Revenue Share (%), by Production Analysis 2024 & 2032
- Figure 74: Asia Pacific Rice Trade Analysis Volume Share (%), by Production Analysis 2024 & 2032
- Figure 75: Asia Pacific Rice Trade Analysis Revenue (Million), by Consumption Analysis 2024 & 2032
- Figure 76: Asia Pacific Rice Trade Analysis Volume (Kiloton), by Consumption Analysis 2024 & 2032
- Figure 77: Asia Pacific Rice Trade Analysis Revenue Share (%), by Consumption Analysis 2024 & 2032
- Figure 78: Asia Pacific Rice Trade Analysis Volume Share (%), by Consumption Analysis 2024 & 2032
- Figure 79: Asia Pacific Rice Trade Analysis Revenue (Million), by Import Market Analysis (Value & Volume) 2024 & 2032
- Figure 80: Asia Pacific Rice Trade Analysis Volume (Kiloton), by Import Market Analysis (Value & Volume) 2024 & 2032
- Figure 81: Asia Pacific Rice Trade Analysis Revenue Share (%), by Import Market Analysis (Value & Volume) 2024 & 2032
- Figure 82: Asia Pacific Rice Trade Analysis Volume Share (%), by Import Market Analysis (Value & Volume) 2024 & 2032
- Figure 83: Asia Pacific Rice Trade Analysis Revenue (Million), by Export Market Analysis (Value & Volume) 2024 & 2032
- Figure 84: Asia Pacific Rice Trade Analysis Volume (Kiloton), by Export Market Analysis (Value & Volume) 2024 & 2032
- Figure 85: Asia Pacific Rice Trade Analysis Revenue Share (%), by Export Market Analysis (Value & Volume) 2024 & 2032
- Figure 86: Asia Pacific Rice Trade Analysis Volume Share (%), by Export Market Analysis (Value & Volume) 2024 & 2032
- Figure 87: Asia Pacific Rice Trade Analysis Revenue (Million), by Price Trend Analysis 2024 & 2032
- Figure 88: Asia Pacific Rice Trade Analysis Volume (Kiloton), by Price Trend Analysis 2024 & 2032
- Figure 89: Asia Pacific Rice Trade Analysis Revenue Share (%), by Price Trend Analysis 2024 & 2032
- Figure 90: Asia Pacific Rice Trade Analysis Volume Share (%), by Price Trend Analysis 2024 & 2032
- Figure 91: Asia Pacific Rice Trade Analysis Revenue (Million), by Country 2024 & 2032
- Figure 92: Asia Pacific Rice Trade Analysis Volume (Kiloton), by Country 2024 & 2032
- Figure 93: Asia Pacific Rice Trade Analysis Revenue Share (%), by Country 2024 & 2032
- Figure 94: Asia Pacific Rice Trade Analysis Volume Share (%), by Country 2024 & 2032
- Figure 95: South America Rice Trade Analysis Revenue (Million), by Production Analysis 2024 & 2032
- Figure 96: South America Rice Trade Analysis Volume (Kiloton), by Production Analysis 2024 & 2032
- Figure 97: South America Rice Trade Analysis Revenue Share (%), by Production Analysis 2024 & 2032
- Figure 98: South America Rice Trade Analysis Volume Share (%), by Production Analysis 2024 & 2032
- Figure 99: South America Rice Trade Analysis Revenue (Million), by Consumption Analysis 2024 & 2032
- Figure 100: South America Rice Trade Analysis Volume (Kiloton), by Consumption Analysis 2024 & 2032
- Figure 101: South America Rice Trade Analysis Revenue Share (%), by Consumption Analysis 2024 & 2032
- Figure 102: South America Rice Trade Analysis Volume Share (%), by Consumption Analysis 2024 & 2032
- Figure 103: South America Rice Trade Analysis Revenue (Million), by Import Market Analysis (Value & Volume) 2024 & 2032
- Figure 104: South America Rice Trade Analysis Volume (Kiloton), by Import Market Analysis (Value & Volume) 2024 & 2032
- Figure 105: South America Rice Trade Analysis Revenue Share (%), by Import Market Analysis (Value & Volume) 2024 & 2032
- Figure 106: South America Rice Trade Analysis Volume Share (%), by Import Market Analysis (Value & Volume) 2024 & 2032
- Figure 107: South America Rice Trade Analysis Revenue (Million), by Export Market Analysis (Value & Volume) 2024 & 2032
- Figure 108: South America Rice Trade Analysis Volume (Kiloton), by Export Market Analysis (Value & Volume) 2024 & 2032
- Figure 109: South America Rice Trade Analysis Revenue Share (%), by Export Market Analysis (Value & Volume) 2024 & 2032
- Figure 110: South America Rice Trade Analysis Volume Share (%), by Export Market Analysis (Value & Volume) 2024 & 2032
- Figure 111: South America Rice Trade Analysis Revenue (Million), by Price Trend Analysis 2024 & 2032
- Figure 112: South America Rice Trade Analysis Volume (Kiloton), by Price Trend Analysis 2024 & 2032
- Figure 113: South America Rice Trade Analysis Revenue Share (%), by Price Trend Analysis 2024 & 2032
- Figure 114: South America Rice Trade Analysis Volume Share (%), by Price Trend Analysis 2024 & 2032
- Figure 115: South America Rice Trade Analysis Revenue (Million), by Country 2024 & 2032
- Figure 116: South America Rice Trade Analysis Volume (Kiloton), by Country 2024 & 2032
- Figure 117: South America Rice Trade Analysis Revenue Share (%), by Country 2024 & 2032
- Figure 118: South America Rice Trade Analysis Volume Share (%), by Country 2024 & 2032
- Figure 119: Africa Rice Trade Analysis Revenue (Million), by Production Analysis 2024 & 2032
- Figure 120: Africa Rice Trade Analysis Volume (Kiloton), by Production Analysis 2024 & 2032
- Figure 121: Africa Rice Trade Analysis Revenue Share (%), by Production Analysis 2024 & 2032
- Figure 122: Africa Rice Trade Analysis Volume Share (%), by Production Analysis 2024 & 2032
- Figure 123: Africa Rice Trade Analysis Revenue (Million), by Consumption Analysis 2024 & 2032
- Figure 124: Africa Rice Trade Analysis Volume (Kiloton), by Consumption Analysis 2024 & 2032
- Figure 125: Africa Rice Trade Analysis Revenue Share (%), by Consumption Analysis 2024 & 2032
- Figure 126: Africa Rice Trade Analysis Volume Share (%), by Consumption Analysis 2024 & 2032
- Figure 127: Africa Rice Trade Analysis Revenue (Million), by Import Market Analysis (Value & Volume) 2024 & 2032
- Figure 128: Africa Rice Trade Analysis Volume (Kiloton), by Import Market Analysis (Value & Volume) 2024 & 2032
- Figure 129: Africa Rice Trade Analysis Revenue Share (%), by Import Market Analysis (Value & Volume) 2024 & 2032
- Figure 130: Africa Rice Trade Analysis Volume Share (%), by Import Market Analysis (Value & Volume) 2024 & 2032
- Figure 131: Africa Rice Trade Analysis Revenue (Million), by Export Market Analysis (Value & Volume) 2024 & 2032
- Figure 132: Africa Rice Trade Analysis Volume (Kiloton), by Export Market Analysis (Value & Volume) 2024 & 2032
- Figure 133: Africa Rice Trade Analysis Revenue Share (%), by Export Market Analysis (Value & Volume) 2024 & 2032
- Figure 134: Africa Rice Trade Analysis Volume Share (%), by Export Market Analysis (Value & Volume) 2024 & 2032
- Figure 135: Africa Rice Trade Analysis Revenue (Million), by Price Trend Analysis 2024 & 2032
- Figure 136: Africa Rice Trade Analysis Volume (Kiloton), by Price Trend Analysis 2024 & 2032
- Figure 137: Africa Rice Trade Analysis Revenue Share (%), by Price Trend Analysis 2024 & 2032
- Figure 138: Africa Rice Trade Analysis Volume Share (%), by Price Trend Analysis 2024 & 2032
- Figure 139: Africa Rice Trade Analysis Revenue (Million), by Country 2024 & 2032
- Figure 140: Africa Rice Trade Analysis Volume (Kiloton), by Country 2024 & 2032
- Figure 141: Africa Rice Trade Analysis Revenue Share (%), by Country 2024 & 2032
- Figure 142: Africa Rice Trade Analysis Volume Share (%), by Country 2024 & 2032
List of Tables
- Table 1: Global Rice Trade Analysis Revenue Million Forecast, by Region 2019 & 2032
- Table 2: Global Rice Trade Analysis Volume Kiloton Forecast, by Region 2019 & 2032
- Table 3: Global Rice Trade Analysis Revenue Million Forecast, by Production Analysis 2019 & 2032
- Table 4: Global Rice Trade Analysis Volume Kiloton Forecast, by Production Analysis 2019 & 2032
- Table 5: Global Rice Trade Analysis Revenue Million Forecast, by Consumption Analysis 2019 & 2032
- Table 6: Global Rice Trade Analysis Volume Kiloton Forecast, by Consumption Analysis 2019 & 2032
- Table 7: Global Rice Trade Analysis Revenue Million Forecast, by Import Market Analysis (Value & Volume) 2019 & 2032
- Table 8: Global Rice Trade Analysis Volume Kiloton Forecast, by Import Market Analysis (Value & Volume) 2019 & 2032
- Table 9: Global Rice Trade Analysis Revenue Million Forecast, by Export Market Analysis (Value & Volume) 2019 & 2032
- Table 10: Global Rice Trade Analysis Volume Kiloton Forecast, by Export Market Analysis (Value & Volume) 2019 & 2032
- Table 11: Global Rice Trade Analysis Revenue Million Forecast, by Price Trend Analysis 2019 & 2032
- Table 12: Global Rice Trade Analysis Volume Kiloton Forecast, by Price Trend Analysis 2019 & 2032
- Table 13: Global Rice Trade Analysis Revenue Million Forecast, by Region 2019 & 2032
- Table 14: Global Rice Trade Analysis Volume Kiloton Forecast, by Region 2019 & 2032
- Table 15: Global Rice Trade Analysis Revenue Million Forecast, by Country 2019 & 2032
- Table 16: Global Rice Trade Analysis Volume Kiloton Forecast, by Country 2019 & 2032
- Table 17: Brazil Rice Trade Analysis Revenue (Million) Forecast, by Application 2019 & 2032
- Table 18: Brazil Rice Trade Analysis Volume (Kiloton) Forecast, by Application 2019 & 2032
- Table 19: Argentina Rice Trade Analysis Revenue (Million) Forecast, by Application 2019 & 2032
- Table 20: Argentina Rice Trade Analysis Volume (Kiloton) Forecast, by Application 2019 & 2032
- Table 21: Rest of South America Rice Trade Analysis Revenue (Million) Forecast, by Application 2019 & 2032
- Table 22: Rest of South America Rice Trade Analysis Volume (Kiloton) Forecast, by Application 2019 & 2032
- Table 23: Global Rice Trade Analysis Revenue Million Forecast, by Country 2019 & 2032
- Table 24: Global Rice Trade Analysis Volume Kiloton Forecast, by Country 2019 & 2032
- Table 25: United States Rice Trade Analysis Revenue (Million) Forecast, by Application 2019 & 2032
- Table 26: United States Rice Trade Analysis Volume (Kiloton) Forecast, by Application 2019 & 2032
- Table 27: Canada Rice Trade Analysis Revenue (Million) Forecast, by Application 2019 & 2032
- Table 28: Canada Rice Trade Analysis Volume (Kiloton) Forecast, by Application 2019 & 2032
- Table 29: Mexico Rice Trade Analysis Revenue (Million) Forecast, by Application 2019 & 2032
- Table 30: Mexico Rice Trade Analysis Volume (Kiloton) Forecast, by Application 2019 & 2032
- Table 31: Global Rice Trade Analysis Revenue Million Forecast, by Country 2019 & 2032
- Table 32: Global Rice Trade Analysis Volume Kiloton Forecast, by Country 2019 & 2032
- Table 33: China Rice Trade Analysis Revenue (Million) Forecast, by Application 2019 & 2032
- Table 34: China Rice Trade Analysis Volume (Kiloton) Forecast, by Application 2019 & 2032
- Table 35: Japan Rice Trade Analysis Revenue (Million) Forecast, by Application 2019 & 2032
- Table 36: Japan Rice Trade Analysis Volume (Kiloton) Forecast, by Application 2019 & 2032
- Table 37: India Rice Trade Analysis Revenue (Million) Forecast, by Application 2019 & 2032
- Table 38: India Rice Trade Analysis Volume (Kiloton) Forecast, by Application 2019 & 2032
- Table 39: South Korea Rice Trade Analysis Revenue (Million) Forecast, by Application 2019 & 2032
- Table 40: South Korea Rice Trade Analysis Volume (Kiloton) Forecast, by Application 2019 & 2032
- Table 41: Taiwan Rice Trade Analysis Revenue (Million) Forecast, by Application 2019 & 2032
- Table 42: Taiwan Rice Trade Analysis Volume (Kiloton) Forecast, by Application 2019 & 2032
- Table 43: Australia Rice Trade Analysis Revenue (Million) Forecast, by Application 2019 & 2032
- Table 44: Australia Rice Trade Analysis Volume (Kiloton) Forecast, by Application 2019 & 2032
- Table 45: Rest of Asia-Pacific Rice Trade Analysis Revenue (Million) Forecast, by Application 2019 & 2032
- Table 46: Rest of Asia-Pacific Rice Trade Analysis Volume (Kiloton) Forecast, by Application 2019 & 2032
- Table 47: Global Rice Trade Analysis Revenue Million Forecast, by Country 2019 & 2032
- Table 48: Global Rice Trade Analysis Volume Kiloton Forecast, by Country 2019 & 2032
- Table 49: Germany Rice Trade Analysis Revenue (Million) Forecast, by Application 2019 & 2032
- Table 50: Germany Rice Trade Analysis Volume (Kiloton) Forecast, by Application 2019 & 2032
- Table 51: France Rice Trade Analysis Revenue (Million) Forecast, by Application 2019 & 2032
- Table 52: France Rice Trade Analysis Volume (Kiloton) Forecast, by Application 2019 & 2032
- Table 53: Italy Rice Trade Analysis Revenue (Million) Forecast, by Application 2019 & 2032
- Table 54: Italy Rice Trade Analysis Volume (Kiloton) Forecast, by Application 2019 & 2032
- Table 55: United Kingdom Rice Trade Analysis Revenue (Million) Forecast, by Application 2019 & 2032
- Table 56: United Kingdom Rice Trade Analysis Volume (Kiloton) Forecast, by Application 2019 & 2032
- Table 57: Netherlands Rice Trade Analysis Revenue (Million) Forecast, by Application 2019 & 2032
- Table 58: Netherlands Rice Trade Analysis Volume (Kiloton) Forecast, by Application 2019 & 2032
- Table 59: Rest of Europe Rice Trade Analysis Revenue (Million) Forecast, by Application 2019 & 2032
- Table 60: Rest of Europe Rice Trade Analysis Volume (Kiloton) Forecast, by Application 2019 & 2032
- Table 61: Global Rice Trade Analysis Revenue Million Forecast, by Country 2019 & 2032
- Table 62: Global Rice Trade Analysis Volume Kiloton Forecast, by Country 2019 & 2032
- Table 63: Middle East Rice Trade Analysis Revenue (Million) Forecast, by Application 2019 & 2032
- Table 64: Middle East Rice Trade Analysis Volume (Kiloton) Forecast, by Application 2019 & 2032
- Table 65: Africa Rice Trade Analysis Revenue (Million) Forecast, by Application 2019 & 2032
- Table 66: Africa Rice Trade Analysis Volume (Kiloton) Forecast, by Application 2019 & 2032
- Table 67: Global Rice Trade Analysis Revenue Million Forecast, by Production Analysis 2019 & 2032
- Table 68: Global Rice Trade Analysis Volume Kiloton Forecast, by Production Analysis 2019 & 2032
- Table 69: Global Rice Trade Analysis Revenue Million Forecast, by Consumption Analysis 2019 & 2032
- Table 70: Global Rice Trade Analysis Volume Kiloton Forecast, by Consumption Analysis 2019 & 2032
- Table 71: Global Rice Trade Analysis Revenue Million Forecast, by Import Market Analysis (Value & Volume) 2019 & 2032
- Table 72: Global Rice Trade Analysis Volume Kiloton Forecast, by Import Market Analysis (Value & Volume) 2019 & 2032
- Table 73: Global Rice Trade Analysis Revenue Million Forecast, by Export Market Analysis (Value & Volume) 2019 & 2032
- Table 74: Global Rice Trade Analysis Volume Kiloton Forecast, by Export Market Analysis (Value & Volume) 2019 & 2032
- Table 75: Global Rice Trade Analysis Revenue Million Forecast, by Price Trend Analysis 2019 & 2032
- Table 76: Global Rice Trade Analysis Volume Kiloton Forecast, by Price Trend Analysis 2019 & 2032
- Table 77: Global Rice Trade Analysis Revenue Million Forecast, by Country 2019 & 2032
- Table 78: Global Rice Trade Analysis Volume Kiloton Forecast, by Country 2019 & 2032
- Table 79: United States Rice Trade Analysis Revenue (Million) Forecast, by Application 2019 & 2032
- Table 80: United States Rice Trade Analysis Volume (Kiloton) Forecast, by Application 2019 & 2032
- Table 81: Canada Rice Trade Analysis Revenue (Million) Forecast, by Application 2019 & 2032
- Table 82: Canada Rice Trade Analysis Volume (Kiloton) Forecast, by Application 2019 & 2032
- Table 83: Global Rice Trade Analysis Revenue Million Forecast, by Production Analysis 2019 & 2032
- Table 84: Global Rice Trade Analysis Volume Kiloton Forecast, by Production Analysis 2019 & 2032
- Table 85: Global Rice Trade Analysis Revenue Million Forecast, by Consumption Analysis 2019 & 2032
- Table 86: Global Rice Trade Analysis Volume Kiloton Forecast, by Consumption Analysis 2019 & 2032
- Table 87: Global Rice Trade Analysis Revenue Million Forecast, by Import Market Analysis (Value & Volume) 2019 & 2032
- Table 88: Global Rice Trade Analysis Volume Kiloton Forecast, by Import Market Analysis (Value & Volume) 2019 & 2032
- Table 89: Global Rice Trade Analysis Revenue Million Forecast, by Export Market Analysis (Value & Volume) 2019 & 2032
- Table 90: Global Rice Trade Analysis Volume Kiloton Forecast, by Export Market Analysis (Value & Volume) 2019 & 2032
- Table 91: Global Rice Trade Analysis Revenue Million Forecast, by Price Trend Analysis 2019 & 2032
- Table 92: Global Rice Trade Analysis Volume Kiloton Forecast, by Price Trend Analysis 2019 & 2032
- Table 93: Global Rice Trade Analysis Revenue Million Forecast, by Country 2019 & 2032
- Table 94: Global Rice Trade Analysis Volume Kiloton Forecast, by Country 2019 & 2032
- Table 95: France Rice Trade Analysis Revenue (Million) Forecast, by Application 2019 & 2032
- Table 96: France Rice Trade Analysis Volume (Kiloton) Forecast, by Application 2019 & 2032
- Table 97: United Kingdom Rice Trade Analysis Revenue (Million) Forecast, by Application 2019 & 2032
- Table 98: United Kingdom Rice Trade Analysis Volume (Kiloton) Forecast, by Application 2019 & 2032
- Table 99: Germany Rice Trade Analysis Revenue (Million) Forecast, by Application 2019 & 2032
- Table 100: Germany Rice Trade Analysis Volume (Kiloton) Forecast, by Application 2019 & 2032
- Table 101: Italy Rice Trade Analysis Revenue (Million) Forecast, by Application 2019 & 2032
- Table 102: Italy Rice Trade Analysis Volume (Kiloton) Forecast, by Application 2019 & 2032
- Table 103: Spain Rice Trade Analysis Revenue (Million) Forecast, by Application 2019 & 2032
- Table 104: Spain Rice Trade Analysis Volume (Kiloton) Forecast, by Application 2019 & 2032
- Table 105: Global Rice Trade Analysis Revenue Million Forecast, by Production Analysis 2019 & 2032
- Table 106: Global Rice Trade Analysis Volume Kiloton Forecast, by Production Analysis 2019 & 2032
- Table 107: Global Rice Trade Analysis Revenue Million Forecast, by Consumption Analysis 2019 & 2032
- Table 108: Global Rice Trade Analysis Volume Kiloton Forecast, by Consumption Analysis 2019 & 2032
- Table 109: Global Rice Trade Analysis Revenue Million Forecast, by Import Market Analysis (Value & Volume) 2019 & 2032
- Table 110: Global Rice Trade Analysis Volume Kiloton Forecast, by Import Market Analysis (Value & Volume) 2019 & 2032
- Table 111: Global Rice Trade Analysis Revenue Million Forecast, by Export Market Analysis (Value & Volume) 2019 & 2032
- Table 112: Global Rice Trade Analysis Volume Kiloton Forecast, by Export Market Analysis (Value & Volume) 2019 & 2032
- Table 113: Global Rice Trade Analysis Revenue Million Forecast, by Price Trend Analysis 2019 & 2032
- Table 114: Global Rice Trade Analysis Volume Kiloton Forecast, by Price Trend Analysis 2019 & 2032
- Table 115: Global Rice Trade Analysis Revenue Million Forecast, by Country 2019 & 2032
- Table 116: Global Rice Trade Analysis Volume Kiloton Forecast, by Country 2019 & 2032
- Table 117: China Rice Trade Analysis Revenue (Million) Forecast, by Application 2019 & 2032
- Table 118: China Rice Trade Analysis Volume (Kiloton) Forecast, by Application 2019 & 2032
- Table 119: India Rice Trade Analysis Revenue (Million) Forecast, by Application 2019 & 2032
- Table 120: India Rice Trade Analysis Volume (Kiloton) Forecast, by Application 2019 & 2032
- Table 121: Thailand Rice Trade Analysis Revenue (Million) Forecast, by Application 2019 & 2032
- Table 122: Thailand Rice Trade Analysis Volume (Kiloton) Forecast, by Application 2019 & 2032
- Table 123: Vietnam Rice Trade Analysis Revenue (Million) Forecast, by Application 2019 & 2032
- Table 124: Vietnam Rice Trade Analysis Volume (Kiloton) Forecast, by Application 2019 & 2032
- Table 125: Pakistan Rice Trade Analysis Revenue (Million) Forecast, by Application 2019 & 2032
- Table 126: Pakistan Rice Trade Analysis Volume (Kiloton) Forecast, by Application 2019 & 2032
- Table 127: Global Rice Trade Analysis Revenue Million Forecast, by Production Analysis 2019 & 2032
- Table 128: Global Rice Trade Analysis Volume Kiloton Forecast, by Production Analysis 2019 & 2032
- Table 129: Global Rice Trade Analysis Revenue Million Forecast, by Consumption Analysis 2019 & 2032
- Table 130: Global Rice Trade Analysis Volume Kiloton Forecast, by Consumption Analysis 2019 & 2032
- Table 131: Global Rice Trade Analysis Revenue Million Forecast, by Import Market Analysis (Value & Volume) 2019 & 2032
- Table 132: Global Rice Trade Analysis Volume Kiloton Forecast, by Import Market Analysis (Value & Volume) 2019 & 2032
- Table 133: Global Rice Trade Analysis Revenue Million Forecast, by Export Market Analysis (Value & Volume) 2019 & 2032
- Table 134: Global Rice Trade Analysis Volume Kiloton Forecast, by Export Market Analysis (Value & Volume) 2019 & 2032
- Table 135: Global Rice Trade Analysis Revenue Million Forecast, by Price Trend Analysis 2019 & 2032
- Table 136: Global Rice Trade Analysis Volume Kiloton Forecast, by Price Trend Analysis 2019 & 2032
- Table 137: Global Rice Trade Analysis Revenue Million Forecast, by Country 2019 & 2032
- Table 138: Global Rice Trade Analysis Volume Kiloton Forecast, by Country 2019 & 2032
- Table 139: Brazil Rice Trade Analysis Revenue (Million) Forecast, by Application 2019 & 2032
- Table 140: Brazil Rice Trade Analysis Volume (Kiloton) Forecast, by Application 2019 & 2032
- Table 141: Argentina Rice Trade Analysis Revenue (Million) Forecast, by Application 2019 & 2032
- Table 142: Argentina Rice Trade Analysis Volume (Kiloton) Forecast, by Application 2019 & 2032
- Table 143: Global Rice Trade Analysis Revenue Million Forecast, by Production Analysis 2019 & 2032
- Table 144: Global Rice Trade Analysis Volume Kiloton Forecast, by Production Analysis 2019 & 2032
- Table 145: Global Rice Trade Analysis Revenue Million Forecast, by Consumption Analysis 2019 & 2032
- Table 146: Global Rice Trade Analysis Volume Kiloton Forecast, by Consumption Analysis 2019 & 2032
- Table 147: Global Rice Trade Analysis Revenue Million Forecast, by Import Market Analysis (Value & Volume) 2019 & 2032
- Table 148: Global Rice Trade Analysis Volume Kiloton Forecast, by Import Market Analysis (Value & Volume) 2019 & 2032
- Table 149: Global Rice Trade Analysis Revenue Million Forecast, by Export Market Analysis (Value & Volume) 2019 & 2032
- Table 150: Global Rice Trade Analysis Volume Kiloton Forecast, by Export Market Analysis (Value & Volume) 2019 & 2032
- Table 151: Global Rice Trade Analysis Revenue Million Forecast, by Price Trend Analysis 2019 & 2032
- Table 152: Global Rice Trade Analysis Volume Kiloton Forecast, by Price Trend Analysis 2019 & 2032
- Table 153: Global Rice Trade Analysis Revenue Million Forecast, by Country 2019 & 2032
- Table 154: Global Rice Trade Analysis Volume Kiloton Forecast, by Country 2019 & 2032
- Table 155: South Africa Rice Trade Analysis Revenue (Million) Forecast, by Application 2019 & 2032
- Table 156: South Africa Rice Trade Analysis Volume (Kiloton) Forecast, by Application 2019 & 2032
Frequently Asked Questions
1. What is the projected Compound Annual Growth Rate (CAGR) of the Rice Trade Analysis?
The projected CAGR is approximately 2.20%.
2. Which companies are prominent players in the Rice Trade Analysis?
Key companies in the market include Cargill , Adani Wilmar , Jindal Saw , Canary Foods , Agroindustrias del Sur, Saurer , KRBL Ltd , Vigoro , Thai Binh Rice , Agroindustrial Rueda .
3. What are the main segments of the Rice Trade Analysis?
The market segments include Production Analysis, Consumption Analysis, Import Market Analysis (Value & Volume), Export Market Analysis (Value & Volume), Price Trend Analysis.
4. Can you provide details about the market size?
The market size is estimated to be USD 306.38 Million as of 2022.
5. What are some drivers contributing to market growth?
N/A
6. What are the notable trends driving market growth?
Favorable Trade Policies.
7. Are there any restraints impacting market growth?
N/A
8. Can you provide examples of recent developments in the market?
September 2022: India banned the export of broken rice, and a 20% export duty was imposed on non-basmati rice. This is the first ban by India after the 2011 ban on non-basmati rice for three years.
9. What pricing options are available for accessing the report?
Pricing options include single-user, multi-user, and enterprise licenses priced at USD 4750, USD 5250, and USD 8750 respectively.
10. Is the market size provided in terms of value or volume?
The market size is provided in terms of value, measured in Million and volume, measured in Kiloton.
11. Are there any specific market keywords associated with the report?
Yes, the market keyword associated with the report is "Rice Trade Analysis," which aids in identifying and referencing the specific market segment covered.
12. How do I determine which pricing option suits my needs best?
The pricing options vary based on user requirements and access needs. Individual users may opt for single-user licenses, while businesses requiring broader access may choose multi-user or enterprise licenses for cost-effective access to the report.
13. Are there any additional resources or data provided in the Rice Trade Analysis report?
While the report offers comprehensive insights, it's advisable to review the specific contents or supplementary materials provided to ascertain if additional resources or data are available.
14. How can I stay updated on further developments or reports in the Rice Trade Analysis?
To stay informed about further developments, trends, and reports in the Rice Trade Analysis, consider subscribing to industry newsletters, following relevant companies and organizations, or regularly checking reputable industry news sources and publications.
Methodology
Step 1 - Identification of Relevant Samples Size from Population Database


Step 2 - Approaches for Defining Global Market Size (Value, Volume* & Price*)

Note*: In applicable scenarios
Step 3 - Data Sources
Primary Research
- Web Analytics
- Survey Reports
- Research Institute
- Latest Research Reports
- Opinion Leaders
Secondary Research
- Annual Reports
- White Paper
- Latest Press Release
- Industry Association
- Paid Database
- Investor Presentations

Step 4 - Data Triangulation
Involves using different sources of information in order to increase the validity of a study
These sources are likely to be stakeholders in a program - participants, other researchers, program staff, other community members, and so on.
Then we put all data in single framework & apply various statistical tools to find out the dynamic on the market.
During the analysis stage, feedback from the stakeholder groups would be compared to determine areas of agreement as well as areas of divergence


