
Key Insights
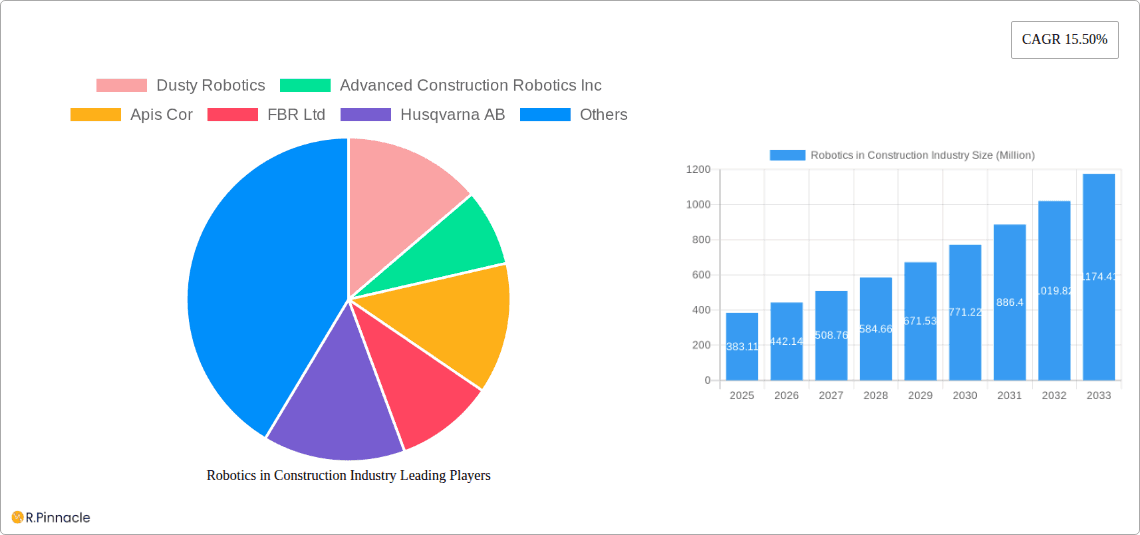
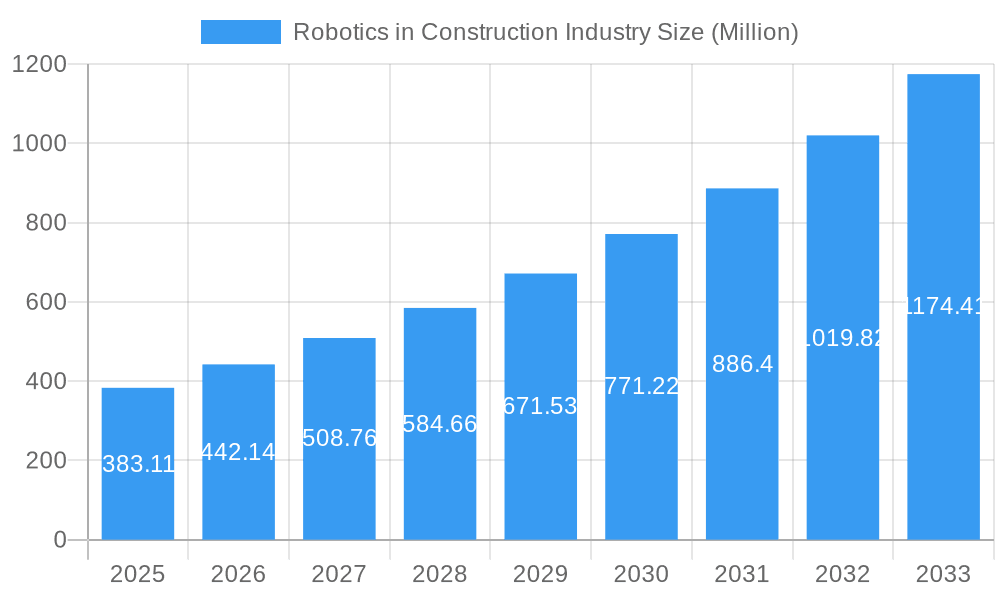
The global Robotics in Construction industry is experiencing robust growth, projected to reach \$383.11 million in 2025 and expanding at a Compound Annual Growth Rate (CAGR) of 15.50% from 2025 to 2033. This expansion is fueled by several key drivers. Increasing labor shortages and rising labor costs in the construction sector are compelling companies to adopt robotic solutions for increased efficiency and productivity. Furthermore, the growing demand for infrastructure development globally, particularly in rapidly urbanizing regions, is significantly boosting market demand. Advancements in robotics technology, including improved sensors, AI-powered automation, and enhanced precision capabilities, are further accelerating adoption. The diverse applications of construction robotics, encompassing demolition, bricklaying, 3D printing, and other specialized tasks across public infrastructure, commercial, and residential building projects, contribute to this market's dynamism. While initial investment costs can be a restraint, the long-term return on investment (ROI) through reduced labor costs, improved safety, and enhanced project timelines is proving increasingly attractive. The market is segmented by type (Demolition, Bricklaying, 3D Printing, Other) and application (Public Infrastructure, Commercial and Residential Buildings, Other). Key players such as Dusty Robotics, Advanced Construction Robotics Inc, and others are driving innovation and competition within this expanding market.
Robotics in Construction Industry Market Size (In Million)

Looking ahead, the future of Robotics in Construction is bright. The integration of Building Information Modeling (BIM) with robotic systems promises to further enhance efficiency and precision. Moreover, the ongoing development of more versatile and adaptable robots capable of handling a wider range of construction tasks will be crucial for sustaining this growth trajectory. The increasing focus on sustainability and minimizing environmental impact in the construction industry also aligns perfectly with the potential of robotics to reduce waste and improve resource utilization. Regional variations in market penetration exist, with North America and Europe expected to maintain strong growth, while Asia-Pacific holds significant potential due to its rapid infrastructure development. The continued investment in research and development, coupled with supportive government policies promoting technological adoption in the construction sector, will propel the industry towards even greater heights in the coming years.
Robotics in Construction Industry Company Market Share
Robotics in Construction Industry: A Comprehensive Market Report (2019-2033)
This in-depth report provides a comprehensive analysis of the Robotics in Construction Industry market, projecting a market value exceeding $XX Million by 2033. The study covers the period from 2019 to 2033, with a focus on the 2025-2033 forecast period. This report is essential for industry professionals, investors, and strategists seeking actionable insights into this rapidly evolving sector.
Robotics in Construction Industry Market Structure & Innovation Trends
The global robotics in construction market is experiencing significant growth, driven by increasing automation needs and technological advancements. Market concentration is moderate, with several key players holding substantial market share, but a significant number of smaller companies are also emerging. Major players include Dusty Robotics, Advanced Construction Robotics Inc., Apis Cor, FBR Ltd., Husqvarna AB, Construction Robotics LLC, BROKK AB (Lifco publ AB), Ekso Bionics, COBOD International AS. The market share of the top 5 companies is estimated at xx%, with a continued trend toward consolidation through mergers and acquisitions (M&A). Recent M&A activity has involved deals valued at over $XX Million, primarily focused on acquiring companies with specialized technologies or expanding geographic reach.
- Innovation Drivers: Increased demand for efficiency, improved safety standards, labor shortages, and advancements in AI, robotics, and 3D printing are key drivers.
- Regulatory Frameworks: Regulations regarding safety, data privacy, and liability are evolving, impacting market growth. Harmonization of international standards is crucial for broader adoption.
- Product Substitutes: Traditional construction methods still dominate, but the increasing cost-effectiveness of robotic solutions is driving substitution.
- End-User Demographics: Large construction firms and government agencies are leading adopters, followed by medium-sized companies. Small firms face higher barriers to entry.
- Market Concentration: The Herfindahl-Hirschman Index (HHI) for the market is estimated to be xx, indicating a moderately concentrated market.
Robotics in Construction Industry Market Dynamics & Trends
The global robotics in construction market is characterized by a Compound Annual Growth Rate (CAGR) of xx% during the forecast period (2025-2033). Several factors contribute to this robust growth: increasing investments in infrastructure projects globally, a rising demand for automation to improve productivity and safety, and continuous technological advancements leading to greater efficiency and cost-effectiveness. Market penetration is currently estimated at xx%, projected to reach xx% by 2033. Technological disruptions, such as the integration of AI and advanced sensors, are accelerating innovation. Consumer preferences are shifting towards faster construction timelines, higher quality, and improved sustainability, aligning well with the capabilities of robotic solutions. Competitive dynamics are intensifying, with companies focusing on product differentiation, strategic partnerships, and geographic expansion.
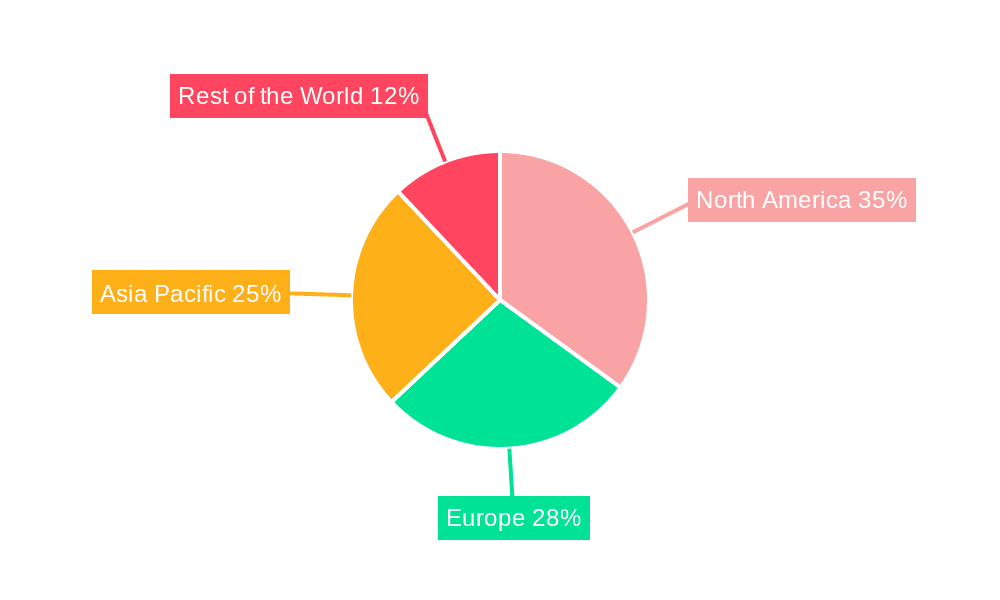
Dominant Regions & Segments in Robotics in Construction Industry
North America currently dominates the robotics in construction market, driven by high infrastructure spending, supportive government policies, and a concentration of key players. However, the Asia-Pacific region is exhibiting rapid growth, propelled by significant infrastructure development and increasing adoption of advanced technologies.
Key Drivers:
- North America: High adoption rates driven by technological advancements and strong government support for infrastructure projects.
- Asia-Pacific: Rapid growth fueled by significant infrastructure development and increasing labor costs.
- Europe: Steady growth due to investments in sustainable construction and technological innovation.
Dominant Segments:
- Type: 3D printing is witnessing high growth, followed by demolition and bricklaying robotics. Other types of robotic solutions are also gaining traction.
- Application: Commercial and residential building construction currently accounts for the largest segment, followed by public infrastructure projects.
Robotics in Construction Industry Product Innovations
Recent product innovations focus on increased autonomy, improved precision, and enhanced safety features. Advanced sensors, AI-powered decision-making, and collaborative robotics are transforming construction workflows. Companies are also focusing on modular designs and easier integration with existing construction equipment. This is improving market fit by reducing deployment costs and streamlining integration into existing processes.
Report Scope & Segmentation Analysis
This report segments the market by type (Demolition, Bricklaying, 3D Printing, Other Types) and application (Public Infrastructure, Commercial and Residential Buildings, Other Applications). Each segment is analyzed in detail, including growth projections, market size, and competitive dynamics. The 3D printing segment is expected to exhibit the highest CAGR, driven by increasing demand for sustainable and efficient building techniques. The commercial and residential building segment will continue to be the largest application area, driven by ongoing construction activities.
Key Drivers of Robotics in Construction Industry Growth
Several key factors are driving the growth of the robotics in construction industry:
- Technological Advancements: AI, 3D printing, and advanced sensor technologies are creating more efficient and precise robotic solutions.
- Economic Factors: Rising labor costs and increased demand for faster construction timelines are driving adoption.
- Regulatory Support: Government initiatives promoting sustainable and efficient construction are creating a favorable environment.
Challenges in the Robotics in Construction Industry Sector
Despite its growth potential, the robotics in construction industry faces challenges:
- High Initial Investment Costs: The high cost of robotic systems can be a barrier for smaller companies.
- Supply Chain Disruptions: Global supply chain issues can affect the availability of components and materials.
- Skill Gaps: A shortage of skilled labor to operate and maintain robotic systems poses a constraint.
Emerging Opportunities in Robotics in Construction Industry
Significant opportunities exist in the robotics in construction industry, including:
- New Materials and Processes: The adoption of new construction materials optimized for robotic construction will increase efficiency.
- Expanding Applications: Robotic solutions are extending into new areas such as maintenance and repair.
- Integration with other Technologies: The integration of robotics with Building Information Modeling (BIM) and other technologies further optimizes construction processes.
Leading Players in the Robotics in Construction Industry Market
- Dusty Robotics
- Advanced Construction Robotics Inc
- Apis Cor
- FBR Ltd
- Husqvarna AB
- Construction Robotics LLC
- BROKK AB (Lifco publ AB)
- Ekso Bionics
- COBOD International AS
Key Developments in Robotics in Construction Industry Industry
- March 2023: FBR Ltd. announced a strategic agreement to fund the production and deployment of three additional Hadrian X robots in the United States, expanding its "Wall as a Service" offering.
- March 2023: Advanced Construction Robotics Inc. launched IronBOT, a rebar-handling robot, enhancing its robotic construction solutions.
Future Outlook for Robotics in Construction Industry Market
The future of the robotics in construction industry looks promising. Continued technological advancements, increased investments in infrastructure, and growing demand for efficient and safe construction practices will fuel market expansion. Strategic partnerships, focused innovation, and addressing existing challenges will be key to unlocking the full potential of this rapidly growing sector. The market is poised for significant expansion driven by further technological breakthroughs and increasing acceptance within the industry.
Robotics in Construction Industry Segmentation
-
1. Type
- 1.1. Demolition
- 1.2. Bricklaying
- 1.3. 3D Printing
- 1.4. Other Types
-
2. Application
- 2.1. Public Infrastructure
- 2.2. Commercial and Residential Buildings
- 2.3. Other Applications
Robotics in Construction Industry Segmentation By Geography
- 1. North America
- 2. Europe
- 3. Asia Pacific
- 4. Rest of the World
Robotics in Construction Industry Regional Market Share
Geographic Coverage of Robotics in Construction Industry
Robotics in Construction Industry REPORT HIGHLIGHTS
| Aspects | Details |
|---|---|
| Study Period | 2020-2034 |
| Base Year | 2025 |
| Estimated Year | 2026 |
| Forecast Period | 2026-2034 |
| Historical Period | 2020-2025 |
| Growth Rate | CAGR of 15.50% from 2020-2034 |
| Segmentation |
|
Table of Contents
- 1. Introduction
- 1.1. Research Scope
- 1.2. Market Segmentation
- 1.3. Research Methodology
- 1.4. Definitions and Assumptions
- 2. Executive Summary
- 2.1. Introduction
- 3. Market Dynamics
- 3.1. Introduction
- 3.2. Market Drivers
- 3.2.1. Rapid Urbanization; Stringent Government Regulations for Worker's Safety
- 3.3. Market Restrains
- 3.3.1. High Equipment and Setup Costs
- 3.4. Market Trends
- 3.4.1. Commercial and Residential Buildings to be the Largest Application for Construction Robots
- 4. Market Factor Analysis
- 4.1. Porters Five Forces
- 4.2. Supply/Value Chain
- 4.3. PESTEL analysis
- 4.4. Market Entropy
- 4.5. Patent/Trademark Analysis
- 5. Global Robotics in Construction Industry Analysis, Insights and Forecast, 2020-2032
- 5.1. Market Analysis, Insights and Forecast - by Type
- 5.1.1. Demolition
- 5.1.2. Bricklaying
- 5.1.3. 3D Printing
- 5.1.4. Other Types
- 5.2. Market Analysis, Insights and Forecast - by Application
- 5.2.1. Public Infrastructure
- 5.2.2. Commercial and Residential Buildings
- 5.2.3. Other Applications
- 5.3. Market Analysis, Insights and Forecast - by Region
- 5.3.1. North America
- 5.3.2. Europe
- 5.3.3. Asia Pacific
- 5.3.4. Rest of the World
- 5.1. Market Analysis, Insights and Forecast - by Type
- 6. North America Robotics in Construction Industry Analysis, Insights and Forecast, 2020-2032
- 6.1. Market Analysis, Insights and Forecast - by Type
- 6.1.1. Demolition
- 6.1.2. Bricklaying
- 6.1.3. 3D Printing
- 6.1.4. Other Types
- 6.2. Market Analysis, Insights and Forecast - by Application
- 6.2.1. Public Infrastructure
- 6.2.2. Commercial and Residential Buildings
- 6.2.3. Other Applications
- 6.1. Market Analysis, Insights and Forecast - by Type
- 7. Europe Robotics in Construction Industry Analysis, Insights and Forecast, 2020-2032
- 7.1. Market Analysis, Insights and Forecast - by Type
- 7.1.1. Demolition
- 7.1.2. Bricklaying
- 7.1.3. 3D Printing
- 7.1.4. Other Types
- 7.2. Market Analysis, Insights and Forecast - by Application
- 7.2.1. Public Infrastructure
- 7.2.2. Commercial and Residential Buildings
- 7.2.3. Other Applications
- 7.1. Market Analysis, Insights and Forecast - by Type
- 8. Asia Pacific Robotics in Construction Industry Analysis, Insights and Forecast, 2020-2032
- 8.1. Market Analysis, Insights and Forecast - by Type
- 8.1.1. Demolition
- 8.1.2. Bricklaying
- 8.1.3. 3D Printing
- 8.1.4. Other Types
- 8.2. Market Analysis, Insights and Forecast - by Application
- 8.2.1. Public Infrastructure
- 8.2.2. Commercial and Residential Buildings
- 8.2.3. Other Applications
- 8.1. Market Analysis, Insights and Forecast - by Type
- 9. Rest of the World Robotics in Construction Industry Analysis, Insights and Forecast, 2020-2032
- 9.1. Market Analysis, Insights and Forecast - by Type
- 9.1.1. Demolition
- 9.1.2. Bricklaying
- 9.1.3. 3D Printing
- 9.1.4. Other Types
- 9.2. Market Analysis, Insights and Forecast - by Application
- 9.2.1. Public Infrastructure
- 9.2.2. Commercial and Residential Buildings
- 9.2.3. Other Applications
- 9.1. Market Analysis, Insights and Forecast - by Type
- 10. Competitive Analysis
- 10.1. Global Market Share Analysis 2025
- 10.2. Company Profiles
- 10.2.1 Dusty Robotics
- 10.2.1.1. Overview
- 10.2.1.2. Products
- 10.2.1.3. SWOT Analysis
- 10.2.1.4. Recent Developments
- 10.2.1.5. Financials (Based on Availability)
- 10.2.2 Advanced Construction Robotics Inc
- 10.2.2.1. Overview
- 10.2.2.2. Products
- 10.2.2.3. SWOT Analysis
- 10.2.2.4. Recent Developments
- 10.2.2.5. Financials (Based on Availability)
- 10.2.3 Apis Cor
- 10.2.3.1. Overview
- 10.2.3.2. Products
- 10.2.3.3. SWOT Analysis
- 10.2.3.4. Recent Developments
- 10.2.3.5. Financials (Based on Availability)
- 10.2.4 FBR Ltd
- 10.2.4.1. Overview
- 10.2.4.2. Products
- 10.2.4.3. SWOT Analysis
- 10.2.4.4. Recent Developments
- 10.2.4.5. Financials (Based on Availability)
- 10.2.5 Husqvarna AB
- 10.2.5.1. Overview
- 10.2.5.2. Products
- 10.2.5.3. SWOT Analysis
- 10.2.5.4. Recent Developments
- 10.2.5.5. Financials (Based on Availability)
- 10.2.6 Construction Robotics LLC
- 10.2.6.1. Overview
- 10.2.6.2. Products
- 10.2.6.3. SWOT Analysis
- 10.2.6.4. Recent Developments
- 10.2.6.5. Financials (Based on Availability)
- 10.2.7 BROKK AB (Lifco publ AB)
- 10.2.7.1. Overview
- 10.2.7.2. Products
- 10.2.7.3. SWOT Analysis
- 10.2.7.4. Recent Developments
- 10.2.7.5. Financials (Based on Availability)
- 10.2.8 Ekso Bionics
- 10.2.8.1. Overview
- 10.2.8.2. Products
- 10.2.8.3. SWOT Analysis
- 10.2.8.4. Recent Developments
- 10.2.8.5. Financials (Based on Availability)
- 10.2.9 COBOD International AS
- 10.2.9.1. Overview
- 10.2.9.2. Products
- 10.2.9.3. SWOT Analysis
- 10.2.9.4. Recent Developments
- 10.2.9.5. Financials (Based on Availability)
- 10.2.1 Dusty Robotics
List of Figures
- Figure 1: Global Robotics in Construction Industry Revenue Breakdown (Million, %) by Region 2025 & 2033
- Figure 2: Global Robotics in Construction Industry Volume Breakdown (cubic meters, %) by Region 2025 & 2033
- Figure 3: North America Robotics in Construction Industry Revenue (Million), by Type 2025 & 2033
- Figure 4: North America Robotics in Construction Industry Volume (cubic meters), by Type 2025 & 2033
- Figure 5: North America Robotics in Construction Industry Revenue Share (%), by Type 2025 & 2033
- Figure 6: North America Robotics in Construction Industry Volume Share (%), by Type 2025 & 2033
- Figure 7: North America Robotics in Construction Industry Revenue (Million), by Application 2025 & 2033
- Figure 8: North America Robotics in Construction Industry Volume (cubic meters), by Application 2025 & 2033
- Figure 9: North America Robotics in Construction Industry Revenue Share (%), by Application 2025 & 2033
- Figure 10: North America Robotics in Construction Industry Volume Share (%), by Application 2025 & 2033
- Figure 11: North America Robotics in Construction Industry Revenue (Million), by Country 2025 & 2033
- Figure 12: North America Robotics in Construction Industry Volume (cubic meters), by Country 2025 & 2033
- Figure 13: North America Robotics in Construction Industry Revenue Share (%), by Country 2025 & 2033
- Figure 14: North America Robotics in Construction Industry Volume Share (%), by Country 2025 & 2033
- Figure 15: Europe Robotics in Construction Industry Revenue (Million), by Type 2025 & 2033
- Figure 16: Europe Robotics in Construction Industry Volume (cubic meters), by Type 2025 & 2033
- Figure 17: Europe Robotics in Construction Industry Revenue Share (%), by Type 2025 & 2033
- Figure 18: Europe Robotics in Construction Industry Volume Share (%), by Type 2025 & 2033
- Figure 19: Europe Robotics in Construction Industry Revenue (Million), by Application 2025 & 2033
- Figure 20: Europe Robotics in Construction Industry Volume (cubic meters), by Application 2025 & 2033
- Figure 21: Europe Robotics in Construction Industry Revenue Share (%), by Application 2025 & 2033
- Figure 22: Europe Robotics in Construction Industry Volume Share (%), by Application 2025 & 2033
- Figure 23: Europe Robotics in Construction Industry Revenue (Million), by Country 2025 & 2033
- Figure 24: Europe Robotics in Construction Industry Volume (cubic meters), by Country 2025 & 2033
- Figure 25: Europe Robotics in Construction Industry Revenue Share (%), by Country 2025 & 2033
- Figure 26: Europe Robotics in Construction Industry Volume Share (%), by Country 2025 & 2033
- Figure 27: Asia Pacific Robotics in Construction Industry Revenue (Million), by Type 2025 & 2033
- Figure 28: Asia Pacific Robotics in Construction Industry Volume (cubic meters), by Type 2025 & 2033
- Figure 29: Asia Pacific Robotics in Construction Industry Revenue Share (%), by Type 2025 & 2033
- Figure 30: Asia Pacific Robotics in Construction Industry Volume Share (%), by Type 2025 & 2033
- Figure 31: Asia Pacific Robotics in Construction Industry Revenue (Million), by Application 2025 & 2033
- Figure 32: Asia Pacific Robotics in Construction Industry Volume (cubic meters), by Application 2025 & 2033
- Figure 33: Asia Pacific Robotics in Construction Industry Revenue Share (%), by Application 2025 & 2033
- Figure 34: Asia Pacific Robotics in Construction Industry Volume Share (%), by Application 2025 & 2033
- Figure 35: Asia Pacific Robotics in Construction Industry Revenue (Million), by Country 2025 & 2033
- Figure 36: Asia Pacific Robotics in Construction Industry Volume (cubic meters), by Country 2025 & 2033
- Figure 37: Asia Pacific Robotics in Construction Industry Revenue Share (%), by Country 2025 & 2033
- Figure 38: Asia Pacific Robotics in Construction Industry Volume Share (%), by Country 2025 & 2033
- Figure 39: Rest of the World Robotics in Construction Industry Revenue (Million), by Type 2025 & 2033
- Figure 40: Rest of the World Robotics in Construction Industry Volume (cubic meters), by Type 2025 & 2033
- Figure 41: Rest of the World Robotics in Construction Industry Revenue Share (%), by Type 2025 & 2033
- Figure 42: Rest of the World Robotics in Construction Industry Volume Share (%), by Type 2025 & 2033
- Figure 43: Rest of the World Robotics in Construction Industry Revenue (Million), by Application 2025 & 2033
- Figure 44: Rest of the World Robotics in Construction Industry Volume (cubic meters), by Application 2025 & 2033
- Figure 45: Rest of the World Robotics in Construction Industry Revenue Share (%), by Application 2025 & 2033
- Figure 46: Rest of the World Robotics in Construction Industry Volume Share (%), by Application 2025 & 2033
- Figure 47: Rest of the World Robotics in Construction Industry Revenue (Million), by Country 2025 & 2033
- Figure 48: Rest of the World Robotics in Construction Industry Volume (cubic meters), by Country 2025 & 2033
- Figure 49: Rest of the World Robotics in Construction Industry Revenue Share (%), by Country 2025 & 2033
- Figure 50: Rest of the World Robotics in Construction Industry Volume Share (%), by Country 2025 & 2033
List of Tables
- Table 1: Global Robotics in Construction Industry Revenue Million Forecast, by Type 2020 & 2033
- Table 2: Global Robotics in Construction Industry Volume cubic meters Forecast, by Type 2020 & 2033
- Table 3: Global Robotics in Construction Industry Revenue Million Forecast, by Application 2020 & 2033
- Table 4: Global Robotics in Construction Industry Volume cubic meters Forecast, by Application 2020 & 2033
- Table 5: Global Robotics in Construction Industry Revenue Million Forecast, by Region 2020 & 2033
- Table 6: Global Robotics in Construction Industry Volume cubic meters Forecast, by Region 2020 & 2033
- Table 7: Global Robotics in Construction Industry Revenue Million Forecast, by Type 2020 & 2033
- Table 8: Global Robotics in Construction Industry Volume cubic meters Forecast, by Type 2020 & 2033
- Table 9: Global Robotics in Construction Industry Revenue Million Forecast, by Application 2020 & 2033
- Table 10: Global Robotics in Construction Industry Volume cubic meters Forecast, by Application 2020 & 2033
- Table 11: Global Robotics in Construction Industry Revenue Million Forecast, by Country 2020 & 2033
- Table 12: Global Robotics in Construction Industry Volume cubic meters Forecast, by Country 2020 & 2033
- Table 13: Global Robotics in Construction Industry Revenue Million Forecast, by Type 2020 & 2033
- Table 14: Global Robotics in Construction Industry Volume cubic meters Forecast, by Type 2020 & 2033
- Table 15: Global Robotics in Construction Industry Revenue Million Forecast, by Application 2020 & 2033
- Table 16: Global Robotics in Construction Industry Volume cubic meters Forecast, by Application 2020 & 2033
- Table 17: Global Robotics in Construction Industry Revenue Million Forecast, by Country 2020 & 2033
- Table 18: Global Robotics in Construction Industry Volume cubic meters Forecast, by Country 2020 & 2033
- Table 19: Global Robotics in Construction Industry Revenue Million Forecast, by Type 2020 & 2033
- Table 20: Global Robotics in Construction Industry Volume cubic meters Forecast, by Type 2020 & 2033
- Table 21: Global Robotics in Construction Industry Revenue Million Forecast, by Application 2020 & 2033
- Table 22: Global Robotics in Construction Industry Volume cubic meters Forecast, by Application 2020 & 2033
- Table 23: Global Robotics in Construction Industry Revenue Million Forecast, by Country 2020 & 2033
- Table 24: Global Robotics in Construction Industry Volume cubic meters Forecast, by Country 2020 & 2033
- Table 25: Global Robotics in Construction Industry Revenue Million Forecast, by Type 2020 & 2033
- Table 26: Global Robotics in Construction Industry Volume cubic meters Forecast, by Type 2020 & 2033
- Table 27: Global Robotics in Construction Industry Revenue Million Forecast, by Application 2020 & 2033
- Table 28: Global Robotics in Construction Industry Volume cubic meters Forecast, by Application 2020 & 2033
- Table 29: Global Robotics in Construction Industry Revenue Million Forecast, by Country 2020 & 2033
- Table 30: Global Robotics in Construction Industry Volume cubic meters Forecast, by Country 2020 & 2033
Frequently Asked Questions
1. What is the projected Compound Annual Growth Rate (CAGR) of the Robotics in Construction Industry?
The projected CAGR is approximately 15.50%.
2. Which companies are prominent players in the Robotics in Construction Industry?
Key companies in the market include Dusty Robotics, Advanced Construction Robotics Inc, Apis Cor, FBR Ltd, Husqvarna AB, Construction Robotics LLC, BROKK AB (Lifco publ AB), Ekso Bionics, COBOD International AS.
3. What are the main segments of the Robotics in Construction Industry?
The market segments include Type, Application.
4. Can you provide details about the market size?
The market size is estimated to be USD 383.11 Million as of 2022.
5. What are some drivers contributing to market growth?
Rapid Urbanization; Stringent Government Regulations for Worker's Safety.
6. What are the notable trends driving market growth?
Commercial and Residential Buildings to be the Largest Application for Construction Robots.
7. Are there any restraints impacting market growth?
High Equipment and Setup Costs.
8. Can you provide examples of recent developments in the market?
March 2023: FBR Ltd. announced a strategic agreement with M&G Investment Management, a UK-based shareholder, to fund the production and deployment of three additional next-generation Hadrian X robots for use in the United States. The three new Hadrian X robots are expected to be built on truck bases in the United States before deployment to provide 'Wall as a Service' bricklaying services through the Perth firm's FastbrickAmericas joint venture.
9. What pricing options are available for accessing the report?
Pricing options include single-user, multi-user, and enterprise licenses priced at USD 4750, USD 5250, and USD 8750 respectively.
10. Is the market size provided in terms of value or volume?
The market size is provided in terms of value, measured in Million and volume, measured in cubic meters.
11. Are there any specific market keywords associated with the report?
Yes, the market keyword associated with the report is "Robotics in Construction Industry," which aids in identifying and referencing the specific market segment covered.
12. How do I determine which pricing option suits my needs best?
The pricing options vary based on user requirements and access needs. Individual users may opt for single-user licenses, while businesses requiring broader access may choose multi-user or enterprise licenses for cost-effective access to the report.
13. Are there any additional resources or data provided in the Robotics in Construction Industry report?
While the report offers comprehensive insights, it's advisable to review the specific contents or supplementary materials provided to ascertain if additional resources or data are available.
14. How can I stay updated on further developments or reports in the Robotics in Construction Industry?
To stay informed about further developments, trends, and reports in the Robotics in Construction Industry, consider subscribing to industry newsletters, following relevant companies and organizations, or regularly checking reputable industry news sources and publications.
Methodology
Step 1 - Identification of Relevant Samples Size from Population Database


Step 2 - Approaches for Defining Global Market Size (Value, Volume* & Price*)

Note*: In applicable scenarios
Step 3 - Data Sources
Primary Research
- Web Analytics
- Survey Reports
- Research Institute
- Latest Research Reports
- Opinion Leaders
Secondary Research
- Annual Reports
- White Paper
- Latest Press Release
- Industry Association
- Paid Database
- Investor Presentations

Step 4 - Data Triangulation
Involves using different sources of information in order to increase the validity of a study
These sources are likely to be stakeholders in a program - participants, other researchers, program staff, other community members, and so on.
Then we put all data in single framework & apply various statistical tools to find out the dynamic on the market.
During the analysis stage, feedback from the stakeholder groups would be compared to determine areas of agreement as well as areas of divergence

