
Key Insights
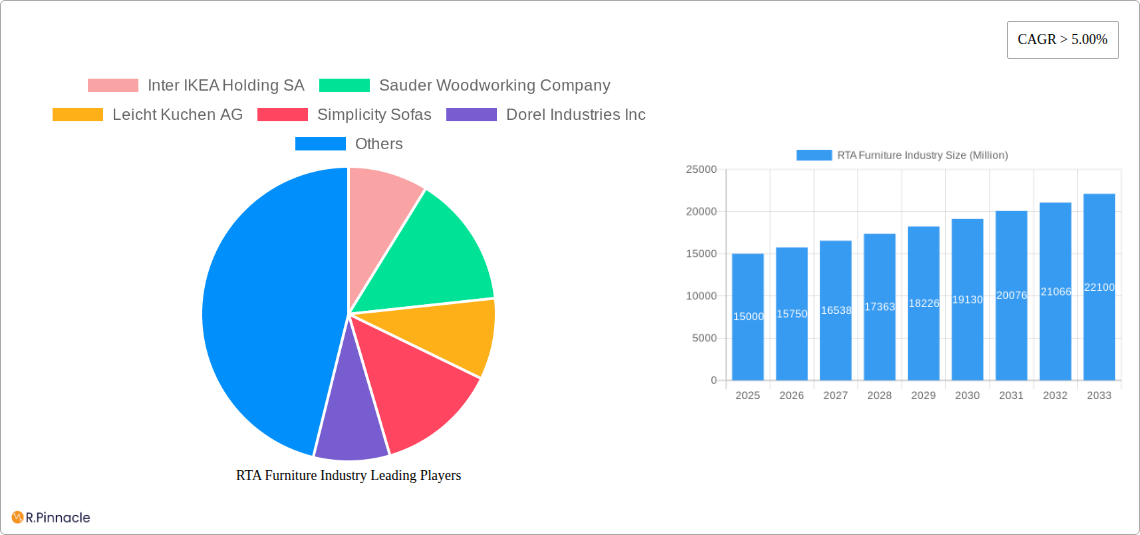
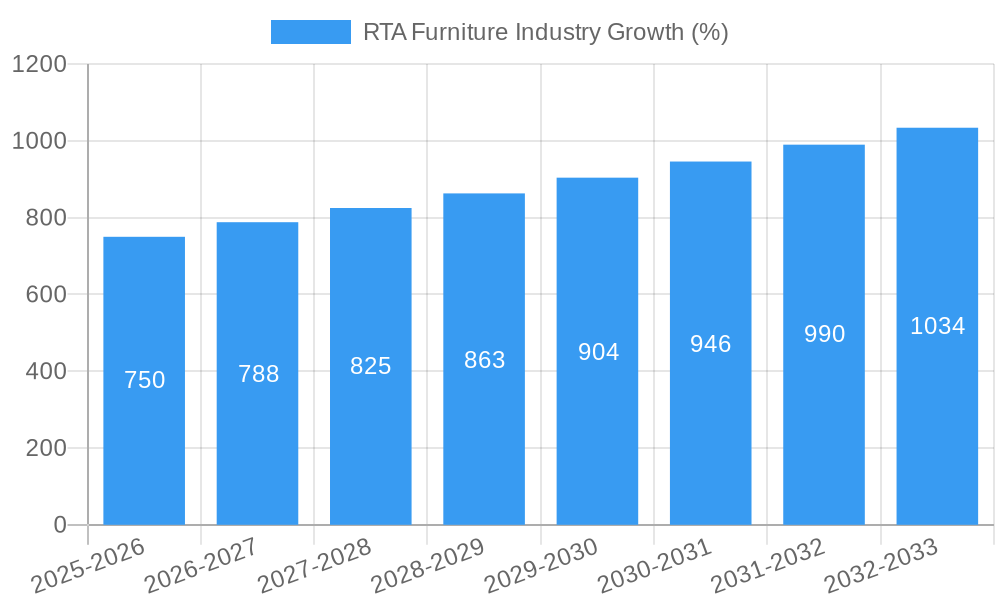
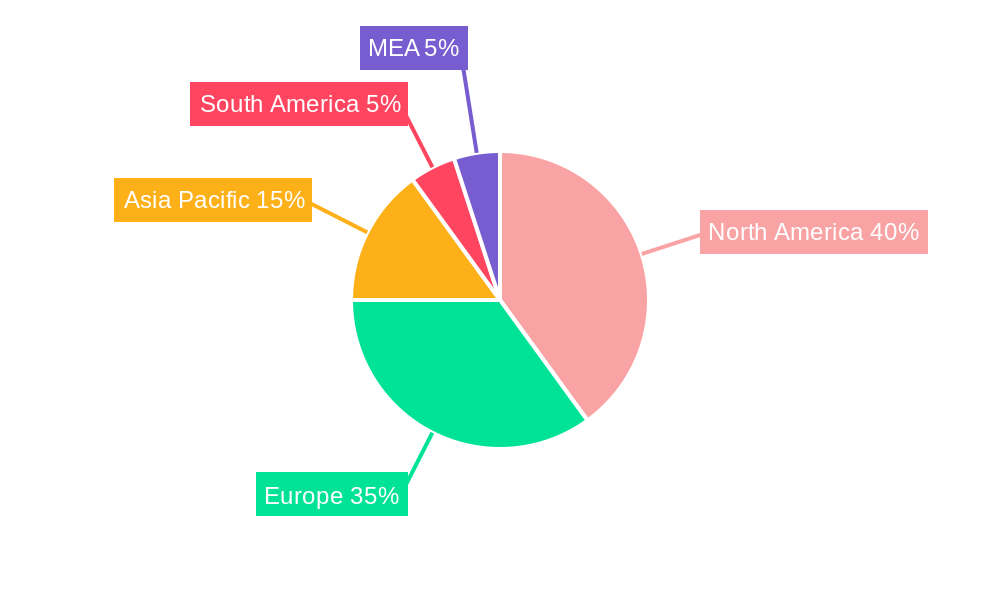
The Ready-to-Assemble (RTA) furniture market is experiencing robust growth, driven by several key factors. The increasing preference for affordability and convenience among consumers, coupled with the rising popularity of e-commerce and compact living spaces, fuels the demand for RTA furniture. The market's segmentation showcases diverse product categories, including tables, chairs, sofas, storage solutions, beds, and other accessories, catering to a wide range of needs. Distribution channels span specialty retailers, flagship stores, home centers, online platforms, and interior designers, reflecting the market's multifaceted approach to reaching consumers. The residential segment remains dominant, yet the commercial sector is showing promising growth potential as businesses seek cost-effective furnishing solutions. North America and Europe currently hold significant market shares due to established retail infrastructure and high consumer spending power; however, the Asia-Pacific region is poised for substantial expansion given its rapid urbanization and burgeoning middle class. A CAGR exceeding 5% indicates a healthy trajectory for sustained growth, with projected market value exceeding current estimates significantly by 2033. Key players like Inter IKEA Holding SA, Sauder Woodworking Company, and others are leveraging innovation and strategic partnerships to maintain their competitive edge.
The competitive landscape, while featuring established players, also presents opportunities for emerging brands. The market concentration is likely moderately consolidated, with a few large players controlling a significant portion of the market share, but many smaller players contributing to overall market diversity. Future growth will likely be influenced by factors such as evolving consumer preferences (e.g., sustainability, smart furniture), technological advancements in manufacturing and e-commerce, and macroeconomic conditions. Companies need to adapt by offering more sustainable and customizable options to stay competitive. Understanding regional variations in consumer behavior and adapting product offerings accordingly will be crucial for long-term success in this dynamic market. Successful strategies will focus on efficient supply chains, strong online presence, and effective marketing campaigns targeting specific demographics.
RTA Furniture Industry: A Comprehensive Market Report (2019-2033)
This comprehensive report provides an in-depth analysis of the Ready-To-Assemble (RTA) furniture industry, offering invaluable insights for industry professionals, investors, and strategic planners. The study period covers 2019-2033, with a base year of 2025 and a forecast period of 2025-2033. The report leverages extensive data analysis to project a market valued at xx Million by 2033, revealing crucial trends and opportunities within this dynamic sector.
RTA Furniture Industry Market Structure & Innovation Trends
This section analyzes the competitive landscape, innovation drivers, and regulatory factors shaping the RTA furniture market. We examine market concentration, revealing the market share held by key players like Inter IKEA Holding SA, Sauder Woodworking Company, and Leicht Kuchen AG, alongside a detailed assessment of smaller but significant contributors such as Simplicity Sofas, Dorel Industries Inc, Bush Industries Inc, Flexsteel (Home Styles), and others including Prepac Manufacturing Ltd, Venture Horizon Corporation, Nolte Group, Wellemobel GmbH, Tvilum, Alno Group, Walker Edison Furniture Company LLC, Steinhoff Holding, South Shore Furniture, and Whalen Furniture Manufacturing. The report quantifies the market share of these companies and analyzes the impact of mergers and acquisitions (M&A) with estimated deal values exceeding xx Million in recent years. The analysis also delves into regulatory frameworks, exploring their influence on product safety, material sourcing, and overall market dynamics. Finally, we assess the impact of substitute products and evolving end-user demographics on market growth.
- Market Concentration: Highly fragmented with a few dominant players controlling xx% of the market.
- M&A Activity: xx Million in deal value recorded over the past 5 years, impacting market consolidation.
- Innovation Drivers: Sustainability concerns, technological advancements (e.g., smart furniture), and evolving consumer preferences.
- Regulatory Frameworks: Impact on material sourcing, product safety standards, and manufacturing practices.
- End-User Demographics: Shifting preferences towards smaller living spaces and eco-friendly furniture influencing market demand.
RTA Furniture Industry Market Dynamics & Trends
This section presents a detailed overview of the key market dynamics influencing the RTA furniture industry. We explore the factors driving market growth, including increasing urbanization, changing lifestyles, and the growing popularity of e-commerce. The report analyzes technological disruptions such as the rise of 3D printing and automation in furniture manufacturing. We also assess the impact of evolving consumer preferences, such as demand for customizable and sustainable furniture options. Competitive dynamics, including pricing strategies, product differentiation, and branding, are comprehensively analyzed. The report projects a compound annual growth rate (CAGR) of xx% during the forecast period, with market penetration expected to reach xx% by 2033.
Dominant Regions & Segments in RTA Furniture Industry
This section identifies the leading regions and segments within the RTA furniture market. The analysis pinpoints the dominant region (e.g., North America, Europe, Asia-Pacific) and countries within those regions, focusing on key drivers such as economic policies, favorable infrastructure, and consumer spending patterns. We present detailed analysis of each segment:
- Product Segments: Tables, Chairs, Sofas, Storage, Beds, and Other Products. The report analyzes the growth trajectory of each product segment, highlighting the most successful and high-growth categories. For example, the demand for foldable and space-saving furniture may drive strong growth in specific segments.
- Distribution Channels: Specialty Retailers, Flagship Stores, Home Centers, Online Retailers, Designers, and Other Distribution Channels. Each channel’s contribution to market share is assessed, highlighting the growing influence of online channels and the importance of omnichannel strategies.
- End-Users: Residential and Commercial. The report analyzes the different demands and preferences of both residential and commercial users, outlining the key differences and growth potential of each segment. For example, the commercial segment may experience significant growth due to the increasing demand for cost-effective furniture solutions for businesses.
RTA Furniture Industry Product Innovations
This section provides a concise summary of the latest product developments and innovations in the RTA furniture market. We highlight technological advancements influencing the industry, such as the use of advanced materials, smart home integration, and improved assembly techniques. We examine the key competitive advantages these innovations bring and their overall market fit. For example, furniture made from recycled materials or using improved joinery techniques may lead to market differentiation.
Report Scope & Segmentation Analysis
This report provides a granular segmentation analysis across various parameters:
Product: Detailed breakdown of market size and growth projections for Tables, Chairs & Sofas, Storage, Beds, and Other Products. Competitive dynamics within each segment are analyzed, highlighting key players and their market positions.
Distribution Channel: Analysis of market size and growth projections across Specialty Retailers, Flagship Stores, Home Centers, Online, Designers, and Other Distribution Channels. The influence of online channels on overall sales is examined.
End User: Detailed market size and growth projections for the Residential and Commercial segments, highlighting distinct market characteristics and growth drivers for each.
Key Drivers of RTA Furniture Industry Growth
The RTA furniture industry's growth is propelled by several factors:
Technological advancements: Automation, 3D printing, and the use of innovative materials improve efficiency and customization options.
Economic factors: Rising disposable incomes in emerging markets stimulate demand for affordable furniture options.
Favorable regulatory environment: Government policies supporting sustainable manufacturing and industry growth contribute to the market's expansion.
Challenges in the RTA Furniture Industry Sector
Several factors pose challenges to the RTA furniture industry:
Supply chain disruptions: Global events can impact the availability of raw materials and components.
Increased competition: The market's intense competition necessitates constant innovation and cost management.
Environmental regulations: Meeting increasingly stringent environmental standards requires investment in sustainable practices. These constraints may impact profitability and require strategic adaptation.
Emerging Opportunities in RTA Furniture Industry
The RTA furniture industry presents several exciting opportunities:
Expansion into new markets: Untapped markets in developing economies present significant growth potential.
Sustainable and eco-friendly products: Demand for environmentally conscious furniture options is increasing rapidly.
Technological integration: Smart home integration and customizable furniture solutions offer significant growth opportunities.
Leading Players in the RTA Furniture Industry Market
- Inter IKEA Holding SA
- Sauder Woodworking Company
- Leicht Kuchen AG
- Simplicity Sofas
- Dorel Industries Inc
- Bush Industries Inc
- Flexsteel (Home Styles)
- Prepac Manufacturing Ltd
- Venture Horizon Corporation
- Nolte Group
- Wellemobel GmbH
- Tvilum
- Alno Group
- Walker Edison Furniture Company LLC
- Steinhoff Holding
- South Shore Furniture
- Whalen Furniture Manufacturing
Key Developments in RTA Furniture Industry
- January 2023: Launch of a new line of sustainable RTA furniture by [Company Name].
- March 2022: Acquisition of [Company A] by [Company B] for xx Million.
- June 2021: Introduction of a new smart furniture line incorporating IoT technology.
Future Outlook for RTA Furniture Industry Market
The RTA furniture market is poised for substantial growth in the coming years. Continued innovation, increased consumer demand, and strategic expansion into new markets will drive this expansion. The industry's adaptation to sustainable practices and the integration of smart technologies will further shape the market's future trajectory. The forecast projects significant growth, exceeding xx Million in revenue by 2033.
RTA Furniture Industry Segmentation
-
1. Product
- 1.1. Tables
- 1.2. Chairs and Sofas
- 1.3. Storage
- 1.4. Beds
- 1.5. Other Products
-
2. Distribution Channel
- 2.1. Specialty Retailers
- 2.2. Flagship Stores
- 2.3. Home Centers
- 2.4. Online
- 2.5. Designers
- 2.6. Other Distribution Channels
-
3. End User
- 3.1. Residential
- 3.2. Commercial
RTA Furniture Industry Segmentation By Geography
- 1. North America
- 2. Europe
- 3. Asia Pacific
- 4. Latin America
- 5. Middle East
RTA Furniture Industry REPORT HIGHLIGHTS
| Aspects | Details |
|---|---|
| Study Period | 2019-2033 |
| Base Year | 2024 |
| Estimated Year | 2025 |
| Forecast Period | 2025-2033 |
| Historical Period | 2019-2024 |
| Growth Rate | CAGR of > 5.00% from 2019-2033 |
| Segmentation |
|
Table of Contents
- 1. Introduction
- 1.1. Research Scope
- 1.2. Market Segmentation
- 1.3. Research Methodology
- 1.4. Definitions and Assumptions
- 2. Executive Summary
- 2.1. Introduction
- 3. Market Dynamics
- 3.1. Introduction
- 3.2. Market Drivers
- 3.2.1. Rise in E-commerce is Driving the Market; Rise in Construction and Real Estate Sector Drives the Furniture Market
- 3.3. Market Restrains
- 3.3.1. Economic Fluctuations; High Competition in the Furniture Market
- 3.4. Market Trends
- 3.4.1. Convenience of RTA furniture
- 4. Market Factor Analysis
- 4.1. Porters Five Forces
- 4.2. Supply/Value Chain
- 4.3. PESTEL analysis
- 4.4. Market Entropy
- 4.5. Patent/Trademark Analysis
- 5. Global RTA Furniture Industry Analysis, Insights and Forecast, 2019-2031
- 5.1. Market Analysis, Insights and Forecast - by Product
- 5.1.1. Tables
- 5.1.2. Chairs and Sofas
- 5.1.3. Storage
- 5.1.4. Beds
- 5.1.5. Other Products
- 5.2. Market Analysis, Insights and Forecast - by Distribution Channel
- 5.2.1. Specialty Retailers
- 5.2.2. Flagship Stores
- 5.2.3. Home Centers
- 5.2.4. Online
- 5.2.5. Designers
- 5.2.6. Other Distribution Channels
- 5.3. Market Analysis, Insights and Forecast - by End User
- 5.3.1. Residential
- 5.3.2. Commercial
- 5.4. Market Analysis, Insights and Forecast - by Region
- 5.4.1. North America
- 5.4.2. Europe
- 5.4.3. Asia Pacific
- 5.4.4. Latin America
- 5.4.5. Middle East
- 5.1. Market Analysis, Insights and Forecast - by Product
- 6. North America RTA Furniture Industry Analysis, Insights and Forecast, 2019-2031
- 6.1. Market Analysis, Insights and Forecast - by Product
- 6.1.1. Tables
- 6.1.2. Chairs and Sofas
- 6.1.3. Storage
- 6.1.4. Beds
- 6.1.5. Other Products
- 6.2. Market Analysis, Insights and Forecast - by Distribution Channel
- 6.2.1. Specialty Retailers
- 6.2.2. Flagship Stores
- 6.2.3. Home Centers
- 6.2.4. Online
- 6.2.5. Designers
- 6.2.6. Other Distribution Channels
- 6.3. Market Analysis, Insights and Forecast - by End User
- 6.3.1. Residential
- 6.3.2. Commercial
- 6.1. Market Analysis, Insights and Forecast - by Product
- 7. Europe RTA Furniture Industry Analysis, Insights and Forecast, 2019-2031
- 7.1. Market Analysis, Insights and Forecast - by Product
- 7.1.1. Tables
- 7.1.2. Chairs and Sofas
- 7.1.3. Storage
- 7.1.4. Beds
- 7.1.5. Other Products
- 7.2. Market Analysis, Insights and Forecast - by Distribution Channel
- 7.2.1. Specialty Retailers
- 7.2.2. Flagship Stores
- 7.2.3. Home Centers
- 7.2.4. Online
- 7.2.5. Designers
- 7.2.6. Other Distribution Channels
- 7.3. Market Analysis, Insights and Forecast - by End User
- 7.3.1. Residential
- 7.3.2. Commercial
- 7.1. Market Analysis, Insights and Forecast - by Product
- 8. Asia Pacific RTA Furniture Industry Analysis, Insights and Forecast, 2019-2031
- 8.1. Market Analysis, Insights and Forecast - by Product
- 8.1.1. Tables
- 8.1.2. Chairs and Sofas
- 8.1.3. Storage
- 8.1.4. Beds
- 8.1.5. Other Products
- 8.2. Market Analysis, Insights and Forecast - by Distribution Channel
- 8.2.1. Specialty Retailers
- 8.2.2. Flagship Stores
- 8.2.3. Home Centers
- 8.2.4. Online
- 8.2.5. Designers
- 8.2.6. Other Distribution Channels
- 8.3. Market Analysis, Insights and Forecast - by End User
- 8.3.1. Residential
- 8.3.2. Commercial
- 8.1. Market Analysis, Insights and Forecast - by Product
- 9. Latin America RTA Furniture Industry Analysis, Insights and Forecast, 2019-2031
- 9.1. Market Analysis, Insights and Forecast - by Product
- 9.1.1. Tables
- 9.1.2. Chairs and Sofas
- 9.1.3. Storage
- 9.1.4. Beds
- 9.1.5. Other Products
- 9.2. Market Analysis, Insights and Forecast - by Distribution Channel
- 9.2.1. Specialty Retailers
- 9.2.2. Flagship Stores
- 9.2.3. Home Centers
- 9.2.4. Online
- 9.2.5. Designers
- 9.2.6. Other Distribution Channels
- 9.3. Market Analysis, Insights and Forecast - by End User
- 9.3.1. Residential
- 9.3.2. Commercial
- 9.1. Market Analysis, Insights and Forecast - by Product
- 10. Middle East RTA Furniture Industry Analysis, Insights and Forecast, 2019-2031
- 10.1. Market Analysis, Insights and Forecast - by Product
- 10.1.1. Tables
- 10.1.2. Chairs and Sofas
- 10.1.3. Storage
- 10.1.4. Beds
- 10.1.5. Other Products
- 10.2. Market Analysis, Insights and Forecast - by Distribution Channel
- 10.2.1. Specialty Retailers
- 10.2.2. Flagship Stores
- 10.2.3. Home Centers
- 10.2.4. Online
- 10.2.5. Designers
- 10.2.6. Other Distribution Channels
- 10.3. Market Analysis, Insights and Forecast - by End User
- 10.3.1. Residential
- 10.3.2. Commercial
- 10.1. Market Analysis, Insights and Forecast - by Product
- 11. North America RTA Furniture Industry Analysis, Insights and Forecast, 2019-2031
- 11.1. Market Analysis, Insights and Forecast - By Country/Sub-region
- 11.1.1 United States
- 11.1.2 Canada
- 11.1.3 Mexico
- 12. Europe RTA Furniture Industry Analysis, Insights and Forecast, 2019-2031
- 12.1. Market Analysis, Insights and Forecast - By Country/Sub-region
- 12.1.1 Germany
- 12.1.2 United Kingdom
- 12.1.3 France
- 12.1.4 Spain
- 12.1.5 Italy
- 12.1.6 Spain
- 12.1.7 Belgium
- 12.1.8 Netherland
- 12.1.9 Nordics
- 12.1.10 Rest of Europe
- 13. Asia Pacific RTA Furniture Industry Analysis, Insights and Forecast, 2019-2031
- 13.1. Market Analysis, Insights and Forecast - By Country/Sub-region
- 13.1.1 China
- 13.1.2 Japan
- 13.1.3 India
- 13.1.4 South Korea
- 13.1.5 Southeast Asia
- 13.1.6 Australia
- 13.1.7 Indonesia
- 13.1.8 Phillipes
- 13.1.9 Singapore
- 13.1.10 Thailandc
- 13.1.11 Rest of Asia Pacific
- 14. South America RTA Furniture Industry Analysis, Insights and Forecast, 2019-2031
- 14.1. Market Analysis, Insights and Forecast - By Country/Sub-region
- 14.1.1 Brazil
- 14.1.2 Argentina
- 14.1.3 Peru
- 14.1.4 Chile
- 14.1.5 Colombia
- 14.1.6 Ecuador
- 14.1.7 Venezuela
- 14.1.8 Rest of South America
- 15. North America RTA Furniture Industry Analysis, Insights and Forecast, 2019-2031
- 15.1. Market Analysis, Insights and Forecast - By Country/Sub-region
- 15.1.1 United States
- 15.1.2 Canada
- 15.1.3 Mexico
- 16. MEA RTA Furniture Industry Analysis, Insights and Forecast, 2019-2031
- 16.1. Market Analysis, Insights and Forecast - By Country/Sub-region
- 16.1.1 United Arab Emirates
- 16.1.2 Saudi Arabia
- 16.1.3 South Africa
- 16.1.4 Rest of Middle East and Africa
- 17. Competitive Analysis
- 17.1. Global Market Share Analysis 2024
- 17.2. Company Profiles
- 17.2.1 Inter IKEA Holding SA
- 17.2.1.1. Overview
- 17.2.1.2. Products
- 17.2.1.3. SWOT Analysis
- 17.2.1.4. Recent Developments
- 17.2.1.5. Financials (Based on Availability)
- 17.2.2 Sauder Woodworking Company
- 17.2.2.1. Overview
- 17.2.2.2. Products
- 17.2.2.3. SWOT Analysis
- 17.2.2.4. Recent Developments
- 17.2.2.5. Financials (Based on Availability)
- 17.2.3 Leicht Kuchen AG
- 17.2.3.1. Overview
- 17.2.3.2. Products
- 17.2.3.3. SWOT Analysis
- 17.2.3.4. Recent Developments
- 17.2.3.5. Financials (Based on Availability)
- 17.2.4 Simplicity Sofas
- 17.2.4.1. Overview
- 17.2.4.2. Products
- 17.2.4.3. SWOT Analysis
- 17.2.4.4. Recent Developments
- 17.2.4.5. Financials (Based on Availability)
- 17.2.5 Dorel Industries Inc
- 17.2.5.1. Overview
- 17.2.5.2. Products
- 17.2.5.3. SWOT Analysis
- 17.2.5.4. Recent Developments
- 17.2.5.5. Financials (Based on Availability)
- 17.2.6 Bush Industries Inc
- 17.2.6.1. Overview
- 17.2.6.2. Products
- 17.2.6.3. SWOT Analysis
- 17.2.6.4. Recent Developments
- 17.2.6.5. Financials (Based on Availability)
- 17.2.7 Flexsteel (Home Styles)
- 17.2.7.1. Overview
- 17.2.7.2. Products
- 17.2.7.3. SWOT Analysis
- 17.2.7.4. Recent Developments
- 17.2.7.5. Financials (Based on Availability)
- 17.2.8 Other Key Players (Prepac Manufacturing Ltd Venture Horizon Corporation Nolte Group Wellemobel GmbH Tvilum Alno Group Walker Edison Furniture Company LLC and others)**List Not Exhaustive
- 17.2.8.1. Overview
- 17.2.8.2. Products
- 17.2.8.3. SWOT Analysis
- 17.2.8.4. Recent Developments
- 17.2.8.5. Financials (Based on Availability)
- 17.2.9 Steinhoff Holding
- 17.2.9.1. Overview
- 17.2.9.2. Products
- 17.2.9.3. SWOT Analysis
- 17.2.9.4. Recent Developments
- 17.2.9.5. Financials (Based on Availability)
- 17.2.10 South Shore Furniture
- 17.2.10.1. Overview
- 17.2.10.2. Products
- 17.2.10.3. SWOT Analysis
- 17.2.10.4. Recent Developments
- 17.2.10.5. Financials (Based on Availability)
- 17.2.11 6 COMPETITIVE LANDSCAPE 6 1 MARKET CONCENTRATION OVERVIEW 6 2 COMPANY PROFILES
- 17.2.11.1. Overview
- 17.2.11.2. Products
- 17.2.11.3. SWOT Analysis
- 17.2.11.4. Recent Developments
- 17.2.11.5. Financials (Based on Availability)
- 17.2.12 Whalen Furniture Manufacturing
- 17.2.12.1. Overview
- 17.2.12.2. Products
- 17.2.12.3. SWOT Analysis
- 17.2.12.4. Recent Developments
- 17.2.12.5. Financials (Based on Availability)
- 17.2.1 Inter IKEA Holding SA
List of Figures
- Figure 1: Global RTA Furniture Industry Revenue Breakdown (Million, %) by Region 2024 & 2032
- Figure 2: North America RTA Furniture Industry Revenue (Million), by Country 2024 & 2032
- Figure 3: North America RTA Furniture Industry Revenue Share (%), by Country 2024 & 2032
- Figure 4: Europe RTA Furniture Industry Revenue (Million), by Country 2024 & 2032
- Figure 5: Europe RTA Furniture Industry Revenue Share (%), by Country 2024 & 2032
- Figure 6: Asia Pacific RTA Furniture Industry Revenue (Million), by Country 2024 & 2032
- Figure 7: Asia Pacific RTA Furniture Industry Revenue Share (%), by Country 2024 & 2032
- Figure 8: South America RTA Furniture Industry Revenue (Million), by Country 2024 & 2032
- Figure 9: South America RTA Furniture Industry Revenue Share (%), by Country 2024 & 2032
- Figure 10: North America RTA Furniture Industry Revenue (Million), by Country 2024 & 2032
- Figure 11: North America RTA Furniture Industry Revenue Share (%), by Country 2024 & 2032
- Figure 12: MEA RTA Furniture Industry Revenue (Million), by Country 2024 & 2032
- Figure 13: MEA RTA Furniture Industry Revenue Share (%), by Country 2024 & 2032
- Figure 14: North America RTA Furniture Industry Revenue (Million), by Product 2024 & 2032
- Figure 15: North America RTA Furniture Industry Revenue Share (%), by Product 2024 & 2032
- Figure 16: North America RTA Furniture Industry Revenue (Million), by Distribution Channel 2024 & 2032
- Figure 17: North America RTA Furniture Industry Revenue Share (%), by Distribution Channel 2024 & 2032
- Figure 18: North America RTA Furniture Industry Revenue (Million), by End User 2024 & 2032
- Figure 19: North America RTA Furniture Industry Revenue Share (%), by End User 2024 & 2032
- Figure 20: North America RTA Furniture Industry Revenue (Million), by Country 2024 & 2032
- Figure 21: North America RTA Furniture Industry Revenue Share (%), by Country 2024 & 2032
- Figure 22: Europe RTA Furniture Industry Revenue (Million), by Product 2024 & 2032
- Figure 23: Europe RTA Furniture Industry Revenue Share (%), by Product 2024 & 2032
- Figure 24: Europe RTA Furniture Industry Revenue (Million), by Distribution Channel 2024 & 2032
- Figure 25: Europe RTA Furniture Industry Revenue Share (%), by Distribution Channel 2024 & 2032
- Figure 26: Europe RTA Furniture Industry Revenue (Million), by End User 2024 & 2032
- Figure 27: Europe RTA Furniture Industry Revenue Share (%), by End User 2024 & 2032
- Figure 28: Europe RTA Furniture Industry Revenue (Million), by Country 2024 & 2032
- Figure 29: Europe RTA Furniture Industry Revenue Share (%), by Country 2024 & 2032
- Figure 30: Asia Pacific RTA Furniture Industry Revenue (Million), by Product 2024 & 2032
- Figure 31: Asia Pacific RTA Furniture Industry Revenue Share (%), by Product 2024 & 2032
- Figure 32: Asia Pacific RTA Furniture Industry Revenue (Million), by Distribution Channel 2024 & 2032
- Figure 33: Asia Pacific RTA Furniture Industry Revenue Share (%), by Distribution Channel 2024 & 2032
- Figure 34: Asia Pacific RTA Furniture Industry Revenue (Million), by End User 2024 & 2032
- Figure 35: Asia Pacific RTA Furniture Industry Revenue Share (%), by End User 2024 & 2032
- Figure 36: Asia Pacific RTA Furniture Industry Revenue (Million), by Country 2024 & 2032
- Figure 37: Asia Pacific RTA Furniture Industry Revenue Share (%), by Country 2024 & 2032
- Figure 38: Latin America RTA Furniture Industry Revenue (Million), by Product 2024 & 2032
- Figure 39: Latin America RTA Furniture Industry Revenue Share (%), by Product 2024 & 2032
- Figure 40: Latin America RTA Furniture Industry Revenue (Million), by Distribution Channel 2024 & 2032
- Figure 41: Latin America RTA Furniture Industry Revenue Share (%), by Distribution Channel 2024 & 2032
- Figure 42: Latin America RTA Furniture Industry Revenue (Million), by End User 2024 & 2032
- Figure 43: Latin America RTA Furniture Industry Revenue Share (%), by End User 2024 & 2032
- Figure 44: Latin America RTA Furniture Industry Revenue (Million), by Country 2024 & 2032
- Figure 45: Latin America RTA Furniture Industry Revenue Share (%), by Country 2024 & 2032
- Figure 46: Middle East RTA Furniture Industry Revenue (Million), by Product 2024 & 2032
- Figure 47: Middle East RTA Furniture Industry Revenue Share (%), by Product 2024 & 2032
- Figure 48: Middle East RTA Furniture Industry Revenue (Million), by Distribution Channel 2024 & 2032
- Figure 49: Middle East RTA Furniture Industry Revenue Share (%), by Distribution Channel 2024 & 2032
- Figure 50: Middle East RTA Furniture Industry Revenue (Million), by End User 2024 & 2032
- Figure 51: Middle East RTA Furniture Industry Revenue Share (%), by End User 2024 & 2032
- Figure 52: Middle East RTA Furniture Industry Revenue (Million), by Country 2024 & 2032
- Figure 53: Middle East RTA Furniture Industry Revenue Share (%), by Country 2024 & 2032
List of Tables
- Table 1: Global RTA Furniture Industry Revenue Million Forecast, by Region 2019 & 2032
- Table 2: Global RTA Furniture Industry Revenue Million Forecast, by Product 2019 & 2032
- Table 3: Global RTA Furniture Industry Revenue Million Forecast, by Distribution Channel 2019 & 2032
- Table 4: Global RTA Furniture Industry Revenue Million Forecast, by End User 2019 & 2032
- Table 5: Global RTA Furniture Industry Revenue Million Forecast, by Region 2019 & 2032
- Table 6: Global RTA Furniture Industry Revenue Million Forecast, by Country 2019 & 2032
- Table 7: United States RTA Furniture Industry Revenue (Million) Forecast, by Application 2019 & 2032
- Table 8: Canada RTA Furniture Industry Revenue (Million) Forecast, by Application 2019 & 2032
- Table 9: Mexico RTA Furniture Industry Revenue (Million) Forecast, by Application 2019 & 2032
- Table 10: Global RTA Furniture Industry Revenue Million Forecast, by Country 2019 & 2032
- Table 11: Germany RTA Furniture Industry Revenue (Million) Forecast, by Application 2019 & 2032
- Table 12: United Kingdom RTA Furniture Industry Revenue (Million) Forecast, by Application 2019 & 2032
- Table 13: France RTA Furniture Industry Revenue (Million) Forecast, by Application 2019 & 2032
- Table 14: Spain RTA Furniture Industry Revenue (Million) Forecast, by Application 2019 & 2032
- Table 15: Italy RTA Furniture Industry Revenue (Million) Forecast, by Application 2019 & 2032
- Table 16: Spain RTA Furniture Industry Revenue (Million) Forecast, by Application 2019 & 2032
- Table 17: Belgium RTA Furniture Industry Revenue (Million) Forecast, by Application 2019 & 2032
- Table 18: Netherland RTA Furniture Industry Revenue (Million) Forecast, by Application 2019 & 2032
- Table 19: Nordics RTA Furniture Industry Revenue (Million) Forecast, by Application 2019 & 2032
- Table 20: Rest of Europe RTA Furniture Industry Revenue (Million) Forecast, by Application 2019 & 2032
- Table 21: Global RTA Furniture Industry Revenue Million Forecast, by Country 2019 & 2032
- Table 22: China RTA Furniture Industry Revenue (Million) Forecast, by Application 2019 & 2032
- Table 23: Japan RTA Furniture Industry Revenue (Million) Forecast, by Application 2019 & 2032
- Table 24: India RTA Furniture Industry Revenue (Million) Forecast, by Application 2019 & 2032
- Table 25: South Korea RTA Furniture Industry Revenue (Million) Forecast, by Application 2019 & 2032
- Table 26: Southeast Asia RTA Furniture Industry Revenue (Million) Forecast, by Application 2019 & 2032
- Table 27: Australia RTA Furniture Industry Revenue (Million) Forecast, by Application 2019 & 2032
- Table 28: Indonesia RTA Furniture Industry Revenue (Million) Forecast, by Application 2019 & 2032
- Table 29: Phillipes RTA Furniture Industry Revenue (Million) Forecast, by Application 2019 & 2032
- Table 30: Singapore RTA Furniture Industry Revenue (Million) Forecast, by Application 2019 & 2032
- Table 31: Thailandc RTA Furniture Industry Revenue (Million) Forecast, by Application 2019 & 2032
- Table 32: Rest of Asia Pacific RTA Furniture Industry Revenue (Million) Forecast, by Application 2019 & 2032
- Table 33: Global RTA Furniture Industry Revenue Million Forecast, by Country 2019 & 2032
- Table 34: Brazil RTA Furniture Industry Revenue (Million) Forecast, by Application 2019 & 2032
- Table 35: Argentina RTA Furniture Industry Revenue (Million) Forecast, by Application 2019 & 2032
- Table 36: Peru RTA Furniture Industry Revenue (Million) Forecast, by Application 2019 & 2032
- Table 37: Chile RTA Furniture Industry Revenue (Million) Forecast, by Application 2019 & 2032
- Table 38: Colombia RTA Furniture Industry Revenue (Million) Forecast, by Application 2019 & 2032
- Table 39: Ecuador RTA Furniture Industry Revenue (Million) Forecast, by Application 2019 & 2032
- Table 40: Venezuela RTA Furniture Industry Revenue (Million) Forecast, by Application 2019 & 2032
- Table 41: Rest of South America RTA Furniture Industry Revenue (Million) Forecast, by Application 2019 & 2032
- Table 42: Global RTA Furniture Industry Revenue Million Forecast, by Country 2019 & 2032
- Table 43: United States RTA Furniture Industry Revenue (Million) Forecast, by Application 2019 & 2032
- Table 44: Canada RTA Furniture Industry Revenue (Million) Forecast, by Application 2019 & 2032
- Table 45: Mexico RTA Furniture Industry Revenue (Million) Forecast, by Application 2019 & 2032
- Table 46: Global RTA Furniture Industry Revenue Million Forecast, by Country 2019 & 2032
- Table 47: United Arab Emirates RTA Furniture Industry Revenue (Million) Forecast, by Application 2019 & 2032
- Table 48: Saudi Arabia RTA Furniture Industry Revenue (Million) Forecast, by Application 2019 & 2032
- Table 49: South Africa RTA Furniture Industry Revenue (Million) Forecast, by Application 2019 & 2032
- Table 50: Rest of Middle East and Africa RTA Furniture Industry Revenue (Million) Forecast, by Application 2019 & 2032
- Table 51: Global RTA Furniture Industry Revenue Million Forecast, by Product 2019 & 2032
- Table 52: Global RTA Furniture Industry Revenue Million Forecast, by Distribution Channel 2019 & 2032
- Table 53: Global RTA Furniture Industry Revenue Million Forecast, by End User 2019 & 2032
- Table 54: Global RTA Furniture Industry Revenue Million Forecast, by Country 2019 & 2032
- Table 55: Global RTA Furniture Industry Revenue Million Forecast, by Product 2019 & 2032
- Table 56: Global RTA Furniture Industry Revenue Million Forecast, by Distribution Channel 2019 & 2032
- Table 57: Global RTA Furniture Industry Revenue Million Forecast, by End User 2019 & 2032
- Table 58: Global RTA Furniture Industry Revenue Million Forecast, by Country 2019 & 2032
- Table 59: Global RTA Furniture Industry Revenue Million Forecast, by Product 2019 & 2032
- Table 60: Global RTA Furniture Industry Revenue Million Forecast, by Distribution Channel 2019 & 2032
- Table 61: Global RTA Furniture Industry Revenue Million Forecast, by End User 2019 & 2032
- Table 62: Global RTA Furniture Industry Revenue Million Forecast, by Country 2019 & 2032
- Table 63: Global RTA Furniture Industry Revenue Million Forecast, by Product 2019 & 2032
- Table 64: Global RTA Furniture Industry Revenue Million Forecast, by Distribution Channel 2019 & 2032
- Table 65: Global RTA Furniture Industry Revenue Million Forecast, by End User 2019 & 2032
- Table 66: Global RTA Furniture Industry Revenue Million Forecast, by Country 2019 & 2032
- Table 67: Global RTA Furniture Industry Revenue Million Forecast, by Product 2019 & 2032
- Table 68: Global RTA Furniture Industry Revenue Million Forecast, by Distribution Channel 2019 & 2032
- Table 69: Global RTA Furniture Industry Revenue Million Forecast, by End User 2019 & 2032
- Table 70: Global RTA Furniture Industry Revenue Million Forecast, by Country 2019 & 2032
Frequently Asked Questions
1. What is the projected Compound Annual Growth Rate (CAGR) of the RTA Furniture Industry?
The projected CAGR is approximately > 5.00%.
2. Which companies are prominent players in the RTA Furniture Industry?
Key companies in the market include Inter IKEA Holding SA, Sauder Woodworking Company, Leicht Kuchen AG, Simplicity Sofas, Dorel Industries Inc, Bush Industries Inc, Flexsteel (Home Styles), Other Key Players (Prepac Manufacturing Ltd Venture Horizon Corporation Nolte Group Wellemobel GmbH Tvilum Alno Group Walker Edison Furniture Company LLC and others)**List Not Exhaustive, Steinhoff Holding, South Shore Furniture, 6 COMPETITIVE LANDSCAPE 6 1 MARKET CONCENTRATION OVERVIEW 6 2 COMPANY PROFILES, Whalen Furniture Manufacturing.
3. What are the main segments of the RTA Furniture Industry?
The market segments include Product, Distribution Channel, End User.
4. Can you provide details about the market size?
The market size is estimated to be USD XX Million as of 2022.
5. What are some drivers contributing to market growth?
Rise in E-commerce is Driving the Market; Rise in Construction and Real Estate Sector Drives the Furniture Market.
6. What are the notable trends driving market growth?
Convenience of RTA furniture.
7. Are there any restraints impacting market growth?
Economic Fluctuations; High Competition in the Furniture Market.
8. Can you provide examples of recent developments in the market?
N/A
9. What pricing options are available for accessing the report?
Pricing options include single-user, multi-user, and enterprise licenses priced at USD 4750, USD 5250, and USD 8750 respectively.
10. Is the market size provided in terms of value or volume?
The market size is provided in terms of value, measured in Million.
11. Are there any specific market keywords associated with the report?
Yes, the market keyword associated with the report is "RTA Furniture Industry," which aids in identifying and referencing the specific market segment covered.
12. How do I determine which pricing option suits my needs best?
The pricing options vary based on user requirements and access needs. Individual users may opt for single-user licenses, while businesses requiring broader access may choose multi-user or enterprise licenses for cost-effective access to the report.
13. Are there any additional resources or data provided in the RTA Furniture Industry report?
While the report offers comprehensive insights, it's advisable to review the specific contents or supplementary materials provided to ascertain if additional resources or data are available.
14. How can I stay updated on further developments or reports in the RTA Furniture Industry?
To stay informed about further developments, trends, and reports in the RTA Furniture Industry, consider subscribing to industry newsletters, following relevant companies and organizations, or regularly checking reputable industry news sources and publications.
Methodology
Step 1 - Identification of Relevant Samples Size from Population Database


Step 2 - Approaches for Defining Global Market Size (Value, Volume* & Price*)

Note*: In applicable scenarios
Step 3 - Data Sources
Primary Research
- Web Analytics
- Survey Reports
- Research Institute
- Latest Research Reports
- Opinion Leaders
Secondary Research
- Annual Reports
- White Paper
- Latest Press Release
- Industry Association
- Paid Database
- Investor Presentations

Step 4 - Data Triangulation
Involves using different sources of information in order to increase the validity of a study
These sources are likely to be stakeholders in a program - participants, other researchers, program staff, other community members, and so on.
Then we put all data in single framework & apply various statistical tools to find out the dynamic on the market.
During the analysis stage, feedback from the stakeholder groups would be compared to determine areas of agreement as well as areas of divergence


