
Key Insights
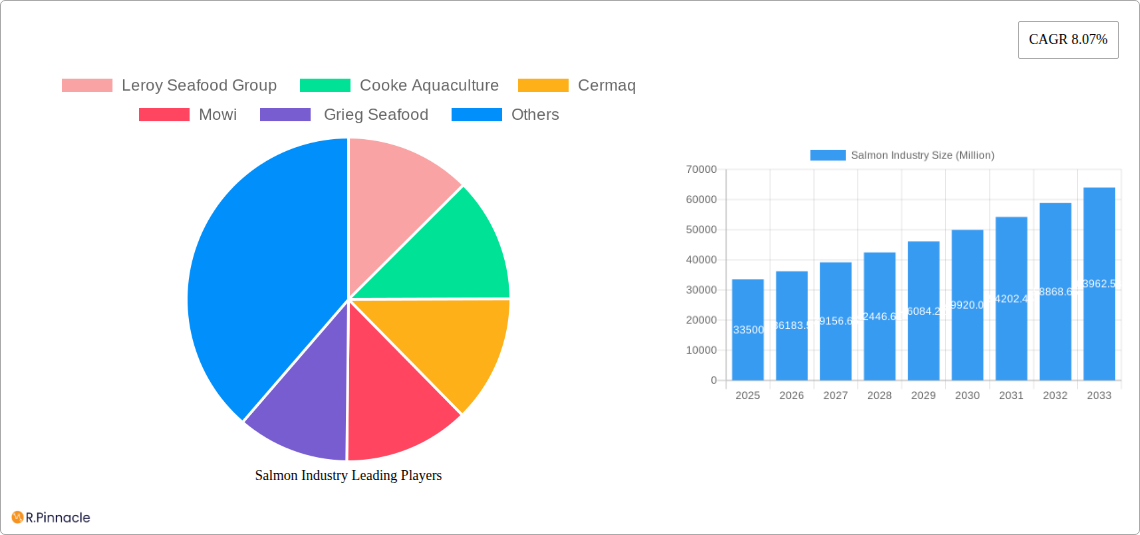
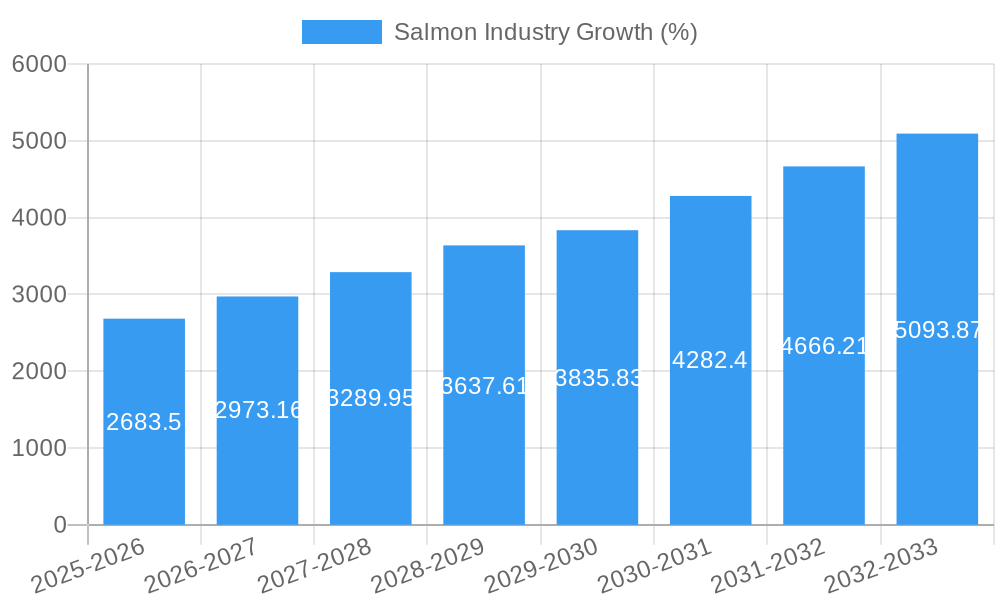
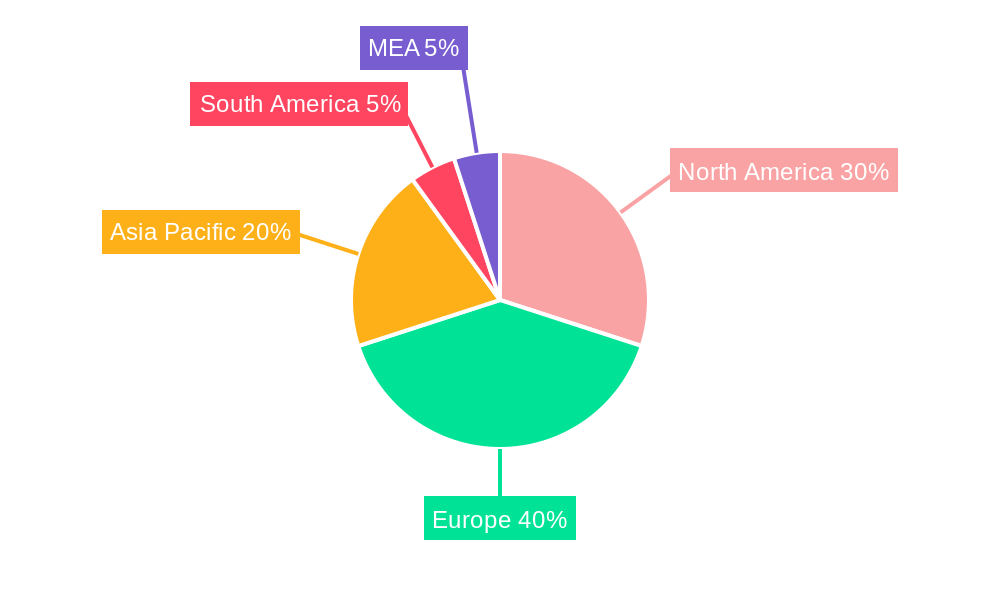
The global salmon industry, valued at $33.5 billion in 2025, is projected to experience robust growth, exhibiting a compound annual growth rate (CAGR) of 8.07% from 2025 to 2033. This expansion is fueled by several key factors. Rising consumer demand for healthy, protein-rich foods is a significant driver, with salmon increasingly recognized for its nutritional benefits and versatility in culinary applications. Growing global populations, particularly in Asia and North America, further contribute to this heightened demand. Sustainable farming practices and technological advancements in aquaculture are enhancing production efficiency and reducing environmental impact, fostering industry growth. The diversification of salmon species beyond Atlantic salmon, encompassing Coho, Masu, Chinook, and other varieties, also caters to evolving consumer preferences and expands market opportunities. However, challenges remain. Fluctuations in feed costs, disease outbreaks within salmon farms, and increasing regulatory scrutiny concerning environmental sustainability pose potential restraints to industry expansion. Geographic variations exist, with North America and Europe currently holding significant market shares, but the Asia-Pacific region is anticipated to demonstrate particularly strong growth in the coming years due to rising disposable incomes and changing dietary habits. Major players like Leroy Seafood Group, Cooke Aquaculture, Cermaq, Mowi, and Grieg Seafood are actively shaping the industry landscape through innovation and strategic expansion.
The segmentation of the salmon market into farmed and wild-caught varieties reflects distinct consumer preferences and price points. Farmed salmon accounts for the majority of the market, benefiting from economies of scale and consistent supply. However, growing awareness of sustainability issues associated with intensive aquaculture is driving increased demand for wild-caught salmon, albeit at a premium price. Within species types, Atlantic salmon maintains the largest market share due to its widespread popularity and established production infrastructure. However, other species like Coho and Chinook salmon are gaining traction as consumer demand diversifies. Regional variations reflect differences in consumer preferences, purchasing power, and access to both farmed and wild salmon. Further research into specific regional nuances would allow for more granular analysis of these market dynamics. Overall, the salmon industry is characterized by dynamic interplay between growth drivers, market segmentation, competitive landscapes, and ongoing sustainability challenges. Projections suggest a positive outlook for continued growth, but the industry's success hinges on addressing the environmental and economic factors that affect its long-term viability.
Salmon Industry Report: 2019-2033 Market Analysis & Future Outlook
This comprehensive report provides a detailed analysis of the global salmon industry, offering invaluable insights for industry professionals, investors, and stakeholders. The study period covers 2019-2033, with a base year of 2025 and a forecast period of 2025-2033. The report leverages rigorous data analysis and expert insights to provide a holistic understanding of market dynamics, competitive landscape, and future growth opportunities. The total market size is estimated at xx Million in 2025.
Salmon Industry Market Structure & Innovation Trends
This section analyzes the market concentration, innovation drivers, regulatory landscape, and competitive dynamics within the salmon industry. We examine the influence of mergers and acquisitions (M&A) activity, including deal values and market share shifts. The report also explores the impact of product substitutes and evolving end-user demographics.
- Market Concentration: The global salmon market exhibits moderate concentration, with major players like Mowi, Leroy Seafood Group, Cooke Aquaculture, Cermaq, and Grieg Seafood holding significant market share. The exact market share percentages for each company in 2025 are xx%, xx%, xx%, xx%, and xx%, respectively.
- Innovation Drivers: Technological advancements in aquaculture, selective breeding programs, and sustainable farming practices are driving innovation.
- Regulatory Frameworks: Government regulations concerning aquaculture practices, environmental sustainability, and food safety significantly impact market dynamics.
- M&A Activity: The salmon industry has witnessed notable M&A activity in recent years, with deal values totaling approximately xx Million in the period 2019-2024. These activities have reshaped the competitive landscape and market share distribution.
- Product Substitutes: The industry faces competition from alternative protein sources, influencing consumer choices and market demand.
Salmon Industry Market Dynamics & Trends
This section delves into the key factors shaping the salmon market's growth trajectory. We explore market growth drivers, technological advancements, shifting consumer preferences, and the evolving competitive landscape.
The global salmon market is projected to experience a Compound Annual Growth Rate (CAGR) of xx% during the forecast period (2025-2033). Several factors contribute to this growth, including increasing global demand for protein, rising health consciousness among consumers, and expanding aquaculture production. Technological innovations in farming techniques and processing are enhancing efficiency and sustainability. However, competitive pressures, fluctuating raw material prices, and environmental concerns present challenges to sustained growth. Market penetration of farmed salmon is expected to reach xx% by 2033.
Dominant Regions & Segments in Salmon Industry
This section identifies the leading regions, countries, and market segments within the salmon industry. We analyze the key factors driving dominance in each segment, considering economic policies, infrastructure development, and consumer demand.
- Leading Region/Country: Norway consistently ranks as the dominant producer and exporter of farmed Atlantic salmon globally.
- Dominant Segment (Type): Farmed salmon constitutes the dominant segment, owing to its higher production volume and accessibility compared to wild-caught salmon.
- Dominant Segment (Species): Atlantic salmon holds the largest market share among all species types due to its popularity, widespread availability, and established farming practices.
- Key Drivers: Norway's dominance stems from robust aquaculture infrastructure, supportive government policies, technological advancements, and a skilled workforce. The high demand for Atlantic salmon globally fuels its market dominance within the species type segment. The continued focus on sustainable farming practices within the farmed segment is further enhancing its appeal to environmentally conscious consumers.
Salmon Industry Product Innovations
The salmon industry is witnessing continuous product innovation, focusing on enhancing product quality, extending shelf life, and catering to diverse consumer preferences. This includes advancements in processing techniques, the development of value-added products (e.g., smoked salmon, pre-packaged meals), and sustainable packaging solutions. These innovations aim to increase market competitiveness and appeal to a wider range of consumers.
Report Scope & Segmentation Analysis
This report segments the salmon market by type (farmed, wild-caught) and species (Atlantic Salmon, Coho Salmon, Masu Salmon, Chinook Salmon, Other Species). Each segment's market size, growth projections, and competitive dynamics are analyzed in detail. Market sizes for each segment are projected to reach xx Million, xx Million, xx Million, xx Million, xx Million, and xx Million, respectively, by 2033.
Key Drivers of Salmon Industry Growth
Several factors drive the growth of the salmon industry. Increasing global demand for protein, rising health awareness promoting fish consumption, and advancements in aquaculture technology leading to higher production efficiency and sustainable practices all contribute significantly. Favorable government policies and increased investments in aquaculture infrastructure further fuel market expansion.
Challenges in the Salmon Industry Sector
The salmon industry faces several challenges including regulatory hurdles related to aquaculture practices and environmental concerns, supply chain disruptions impacting production and distribution, and intense competition from other protein sources and within the industry itself. These factors can impact production costs, market prices, and overall profitability.
Emerging Opportunities in Salmon Industry
Emerging opportunities include expanding into new markets with increasing demand for high-quality protein, leveraging technological advancements in aquaculture to enhance sustainability and efficiency, and catering to evolving consumer preferences with value-added products and innovative packaging solutions.
Leading Players in the Salmon Industry Market
Key Developments in Salmon Industry
- January 2023: Mowi announced a significant investment in a new salmon processing facility.
- June 2022: Cooke Aquaculture completed the acquisition of a smaller competitor.
- September 2021: Leroy Seafood Group launched a new sustainable packaging initiative. (Further developments will be detailed in the full report)
Future Outlook for Salmon Industry Market
The salmon industry is poised for continued growth, driven by strong global demand, technological advancements, and sustainable farming practices. Strategic investments in research and development, expansion into new markets, and a focus on product diversification will further enhance the sector's potential and resilience. The market is expected to reach xx Million by 2033, presenting significant opportunities for established players and new entrants.
Salmon Industry Segmentation
-
1. Species Type
- 1.1. Atlantic Salmon
- 1.2. Coho Salmon
- 1.3. Masu Salmon
- 1.4. Chinook Salmon
- 1.5. Other Species Types
-
2. Type
- 2.1. Farmed
- 2.2. Wild Captured
-
3. Species Type
- 3.1. Atlantic Salmon
- 3.2. Coho Salmon
- 3.3. Masu Salmon
- 3.4. Chinook Salmon
- 3.5. Other Species Types
-
4. Type
- 4.1. Farmed
- 4.2. Wild Captured
Salmon Industry Segmentation By Geography
-
1. North America
- 1.1. United States
- 1.2. Canada
-
2. Europe
- 2.1. Norway
- 2.2. Spain
- 2.3. Netherlands
- 2.4. France
- 2.5. Italy
- 2.6. Greece
- 2.7. United Kingdom
- 2.8. Scotland
-
3. Asia Pacific
- 3.1. China
- 3.2. Japan
- 3.3. Australia
-
4. South America
- 4.1. Chile
Salmon Industry REPORT HIGHLIGHTS
| Aspects | Details |
|---|---|
| Study Period | 2019-2033 |
| Base Year | 2024 |
| Estimated Year | 2025 |
| Forecast Period | 2025-2033 |
| Historical Period | 2019-2024 |
| Growth Rate | CAGR of 8.07% from 2019-2033 |
| Segmentation |
|
Table of Contents
- 1. Introduction
- 1.1. Research Scope
- 1.2. Market Segmentation
- 1.3. Research Methodology
- 1.4. Definitions and Assumptions
- 2. Executive Summary
- 2.1. Introduction
- 3. Market Dynamics
- 3.1. Introduction
- 3.2. Market Drivers
- 3.2.1. ; Awareness About Health Benefits Associated With Pecan Consumption; Wide Application of Pecan
- 3.3. Market Restrains
- 3.3.1. ; Volatility in the Prices; Adverse Weather Conditions Affecting Yield
- 3.4. Market Trends
- 3.4.1. Healthy Boost in the Salmon Production
- 4. Market Factor Analysis
- 4.1. Porters Five Forces
- 4.2. Supply/Value Chain
- 4.3. PESTEL analysis
- 4.4. Market Entropy
- 4.5. Patent/Trademark Analysis
- 5. Global Salmon Industry Analysis, Insights and Forecast, 2019-2031
- 5.1. Market Analysis, Insights and Forecast - by Species Type
- 5.1.1. Atlantic Salmon
- 5.1.2. Coho Salmon
- 5.1.3. Masu Salmon
- 5.1.4. Chinook Salmon
- 5.1.5. Other Species Types
- 5.2. Market Analysis, Insights and Forecast - by Type
- 5.2.1. Farmed
- 5.2.2. Wild Captured
- 5.3. Market Analysis, Insights and Forecast - by Species Type
- 5.3.1. Atlantic Salmon
- 5.3.2. Coho Salmon
- 5.3.3. Masu Salmon
- 5.3.4. Chinook Salmon
- 5.3.5. Other Species Types
- 5.4. Market Analysis, Insights and Forecast - by Type
- 5.4.1. Farmed
- 5.4.2. Wild Captured
- 5.5. Market Analysis, Insights and Forecast - by Region
- 5.5.1. North America
- 5.5.2. Europe
- 5.5.3. Asia Pacific
- 5.5.4. South America
- 5.1. Market Analysis, Insights and Forecast - by Species Type
- 6. North America Salmon Industry Analysis, Insights and Forecast, 2019-2031
- 6.1. Market Analysis, Insights and Forecast - by Species Type
- 6.1.1. Atlantic Salmon
- 6.1.2. Coho Salmon
- 6.1.3. Masu Salmon
- 6.1.4. Chinook Salmon
- 6.1.5. Other Species Types
- 6.2. Market Analysis, Insights and Forecast - by Type
- 6.2.1. Farmed
- 6.2.2. Wild Captured
- 6.3. Market Analysis, Insights and Forecast - by Species Type
- 6.3.1. Atlantic Salmon
- 6.3.2. Coho Salmon
- 6.3.3. Masu Salmon
- 6.3.4. Chinook Salmon
- 6.3.5. Other Species Types
- 6.4. Market Analysis, Insights and Forecast - by Type
- 6.4.1. Farmed
- 6.4.2. Wild Captured
- 6.1. Market Analysis, Insights and Forecast - by Species Type
- 7. Europe Salmon Industry Analysis, Insights and Forecast, 2019-2031
- 7.1. Market Analysis, Insights and Forecast - by Species Type
- 7.1.1. Atlantic Salmon
- 7.1.2. Coho Salmon
- 7.1.3. Masu Salmon
- 7.1.4. Chinook Salmon
- 7.1.5. Other Species Types
- 7.2. Market Analysis, Insights and Forecast - by Type
- 7.2.1. Farmed
- 7.2.2. Wild Captured
- 7.3. Market Analysis, Insights and Forecast - by Species Type
- 7.3.1. Atlantic Salmon
- 7.3.2. Coho Salmon
- 7.3.3. Masu Salmon
- 7.3.4. Chinook Salmon
- 7.3.5. Other Species Types
- 7.4. Market Analysis, Insights and Forecast - by Type
- 7.4.1. Farmed
- 7.4.2. Wild Captured
- 7.1. Market Analysis, Insights and Forecast - by Species Type
- 8. Asia Pacific Salmon Industry Analysis, Insights and Forecast, 2019-2031
- 8.1. Market Analysis, Insights and Forecast - by Species Type
- 8.1.1. Atlantic Salmon
- 8.1.2. Coho Salmon
- 8.1.3. Masu Salmon
- 8.1.4. Chinook Salmon
- 8.1.5. Other Species Types
- 8.2. Market Analysis, Insights and Forecast - by Type
- 8.2.1. Farmed
- 8.2.2. Wild Captured
- 8.3. Market Analysis, Insights and Forecast - by Species Type
- 8.3.1. Atlantic Salmon
- 8.3.2. Coho Salmon
- 8.3.3. Masu Salmon
- 8.3.4. Chinook Salmon
- 8.3.5. Other Species Types
- 8.4. Market Analysis, Insights and Forecast - by Type
- 8.4.1. Farmed
- 8.4.2. Wild Captured
- 8.1. Market Analysis, Insights and Forecast - by Species Type
- 9. South America Salmon Industry Analysis, Insights and Forecast, 2019-2031
- 9.1. Market Analysis, Insights and Forecast - by Species Type
- 9.1.1. Atlantic Salmon
- 9.1.2. Coho Salmon
- 9.1.3. Masu Salmon
- 9.1.4. Chinook Salmon
- 9.1.5. Other Species Types
- 9.2. Market Analysis, Insights and Forecast - by Type
- 9.2.1. Farmed
- 9.2.2. Wild Captured
- 9.3. Market Analysis, Insights and Forecast - by Species Type
- 9.3.1. Atlantic Salmon
- 9.3.2. Coho Salmon
- 9.3.3. Masu Salmon
- 9.3.4. Chinook Salmon
- 9.3.5. Other Species Types
- 9.4. Market Analysis, Insights and Forecast - by Type
- 9.4.1. Farmed
- 9.4.2. Wild Captured
- 9.1. Market Analysis, Insights and Forecast - by Species Type
- 10. North America Salmon Industry Analysis, Insights and Forecast, 2019-2031
- 10.1. Market Analysis, Insights and Forecast - By Country/Sub-region
- 10.1.1 United States
- 10.1.2 Canada
- 11. Europe Salmon Industry Analysis, Insights and Forecast, 2019-2031
- 11.1. Market Analysis, Insights and Forecast - By Country/Sub-region
- 11.1.1 Norway
- 11.1.2 Spain
- 11.1.3 Netherlands
- 11.1.4 France
- 11.1.5 Italy
- 11.1.6 Greece
- 11.1.7 United Kingdom
- 11.1.8 Scotland
- 12. Asia Pacific Salmon Industry Analysis, Insights and Forecast, 2019-2031
- 12.1. Market Analysis, Insights and Forecast - By Country/Sub-region
- 12.1.1 China
- 12.1.2 Japan
- 12.1.3 Australia
- 13. South America Salmon Industry Analysis, Insights and Forecast, 2019-2031
- 13.1. Market Analysis, Insights and Forecast - By Country/Sub-region
- 13.1.1. Chile
- 14. MEA Salmon Industry Analysis, Insights and Forecast, 2019-2031
- 14.1. Market Analysis, Insights and Forecast - By Country/Sub-region
- 14.1.1 Middle East
- 14.1.2 Africa
- 15. Competitive Analysis
- 15.1. Global Market Share Analysis 2024
- 15.2. Company Profiles
- 15.2.1 Leroy Seafood Group
- 15.2.1.1. Overview
- 15.2.1.2. Products
- 15.2.1.3. SWOT Analysis
- 15.2.1.4. Recent Developments
- 15.2.1.5. Financials (Based on Availability)
- 15.2.2 Cooke Aquaculture
- 15.2.2.1. Overview
- 15.2.2.2. Products
- 15.2.2.3. SWOT Analysis
- 15.2.2.4. Recent Developments
- 15.2.2.5. Financials (Based on Availability)
- 15.2.3 Cermaq
- 15.2.3.1. Overview
- 15.2.3.2. Products
- 15.2.3.3. SWOT Analysis
- 15.2.3.4. Recent Developments
- 15.2.3.5. Financials (Based on Availability)
- 15.2.4 Mowi
- 15.2.4.1. Overview
- 15.2.4.2. Products
- 15.2.4.3. SWOT Analysis
- 15.2.4.4. Recent Developments
- 15.2.4.5. Financials (Based on Availability)
- 15.2.5 Grieg Seafood
- 15.2.5.1. Overview
- 15.2.5.2. Products
- 15.2.5.3. SWOT Analysis
- 15.2.5.4. Recent Developments
- 15.2.5.5. Financials (Based on Availability)
- 15.2.1 Leroy Seafood Group
List of Figures
- Figure 1: Global Salmon Industry Revenue Breakdown (Million, %) by Region 2024 & 2032
- Figure 2: North America Salmon Industry Revenue (Million), by Country 2024 & 2032
- Figure 3: North America Salmon Industry Revenue Share (%), by Country 2024 & 2032
- Figure 4: Europe Salmon Industry Revenue (Million), by Country 2024 & 2032
- Figure 5: Europe Salmon Industry Revenue Share (%), by Country 2024 & 2032
- Figure 6: Asia Pacific Salmon Industry Revenue (Million), by Country 2024 & 2032
- Figure 7: Asia Pacific Salmon Industry Revenue Share (%), by Country 2024 & 2032
- Figure 8: South America Salmon Industry Revenue (Million), by Country 2024 & 2032
- Figure 9: South America Salmon Industry Revenue Share (%), by Country 2024 & 2032
- Figure 10: MEA Salmon Industry Revenue (Million), by Country 2024 & 2032
- Figure 11: MEA Salmon Industry Revenue Share (%), by Country 2024 & 2032
- Figure 12: North America Salmon Industry Revenue (Million), by Species Type 2024 & 2032
- Figure 13: North America Salmon Industry Revenue Share (%), by Species Type 2024 & 2032
- Figure 14: North America Salmon Industry Revenue (Million), by Type 2024 & 2032
- Figure 15: North America Salmon Industry Revenue Share (%), by Type 2024 & 2032
- Figure 16: North America Salmon Industry Revenue (Million), by Species Type 2024 & 2032
- Figure 17: North America Salmon Industry Revenue Share (%), by Species Type 2024 & 2032
- Figure 18: North America Salmon Industry Revenue (Million), by Type 2024 & 2032
- Figure 19: North America Salmon Industry Revenue Share (%), by Type 2024 & 2032
- Figure 20: North America Salmon Industry Revenue (Million), by Country 2024 & 2032
- Figure 21: North America Salmon Industry Revenue Share (%), by Country 2024 & 2032
- Figure 22: Europe Salmon Industry Revenue (Million), by Species Type 2024 & 2032
- Figure 23: Europe Salmon Industry Revenue Share (%), by Species Type 2024 & 2032
- Figure 24: Europe Salmon Industry Revenue (Million), by Type 2024 & 2032
- Figure 25: Europe Salmon Industry Revenue Share (%), by Type 2024 & 2032
- Figure 26: Europe Salmon Industry Revenue (Million), by Species Type 2024 & 2032
- Figure 27: Europe Salmon Industry Revenue Share (%), by Species Type 2024 & 2032
- Figure 28: Europe Salmon Industry Revenue (Million), by Type 2024 & 2032
- Figure 29: Europe Salmon Industry Revenue Share (%), by Type 2024 & 2032
- Figure 30: Europe Salmon Industry Revenue (Million), by Country 2024 & 2032
- Figure 31: Europe Salmon Industry Revenue Share (%), by Country 2024 & 2032
- Figure 32: Asia Pacific Salmon Industry Revenue (Million), by Species Type 2024 & 2032
- Figure 33: Asia Pacific Salmon Industry Revenue Share (%), by Species Type 2024 & 2032
- Figure 34: Asia Pacific Salmon Industry Revenue (Million), by Type 2024 & 2032
- Figure 35: Asia Pacific Salmon Industry Revenue Share (%), by Type 2024 & 2032
- Figure 36: Asia Pacific Salmon Industry Revenue (Million), by Species Type 2024 & 2032
- Figure 37: Asia Pacific Salmon Industry Revenue Share (%), by Species Type 2024 & 2032
- Figure 38: Asia Pacific Salmon Industry Revenue (Million), by Type 2024 & 2032
- Figure 39: Asia Pacific Salmon Industry Revenue Share (%), by Type 2024 & 2032
- Figure 40: Asia Pacific Salmon Industry Revenue (Million), by Country 2024 & 2032
- Figure 41: Asia Pacific Salmon Industry Revenue Share (%), by Country 2024 & 2032
- Figure 42: South America Salmon Industry Revenue (Million), by Species Type 2024 & 2032
- Figure 43: South America Salmon Industry Revenue Share (%), by Species Type 2024 & 2032
- Figure 44: South America Salmon Industry Revenue (Million), by Type 2024 & 2032
- Figure 45: South America Salmon Industry Revenue Share (%), by Type 2024 & 2032
- Figure 46: South America Salmon Industry Revenue (Million), by Species Type 2024 & 2032
- Figure 47: South America Salmon Industry Revenue Share (%), by Species Type 2024 & 2032
- Figure 48: South America Salmon Industry Revenue (Million), by Type 2024 & 2032
- Figure 49: South America Salmon Industry Revenue Share (%), by Type 2024 & 2032
- Figure 50: South America Salmon Industry Revenue (Million), by Country 2024 & 2032
- Figure 51: South America Salmon Industry Revenue Share (%), by Country 2024 & 2032
List of Tables
- Table 1: Global Salmon Industry Revenue Million Forecast, by Region 2019 & 2032
- Table 2: Global Salmon Industry Revenue Million Forecast, by Species Type 2019 & 2032
- Table 3: Global Salmon Industry Revenue Million Forecast, by Type 2019 & 2032
- Table 4: Global Salmon Industry Revenue Million Forecast, by Species Type 2019 & 2032
- Table 5: Global Salmon Industry Revenue Million Forecast, by Type 2019 & 2032
- Table 6: Global Salmon Industry Revenue Million Forecast, by Region 2019 & 2032
- Table 7: Global Salmon Industry Revenue Million Forecast, by Country 2019 & 2032
- Table 8: United States Salmon Industry Revenue (Million) Forecast, by Application 2019 & 2032
- Table 9: Canada Salmon Industry Revenue (Million) Forecast, by Application 2019 & 2032
- Table 10: Global Salmon Industry Revenue Million Forecast, by Country 2019 & 2032
- Table 11: Norway Salmon Industry Revenue (Million) Forecast, by Application 2019 & 2032
- Table 12: Spain Salmon Industry Revenue (Million) Forecast, by Application 2019 & 2032
- Table 13: Netherlands Salmon Industry Revenue (Million) Forecast, by Application 2019 & 2032
- Table 14: France Salmon Industry Revenue (Million) Forecast, by Application 2019 & 2032
- Table 15: Italy Salmon Industry Revenue (Million) Forecast, by Application 2019 & 2032
- Table 16: Greece Salmon Industry Revenue (Million) Forecast, by Application 2019 & 2032
- Table 17: United Kingdom Salmon Industry Revenue (Million) Forecast, by Application 2019 & 2032
- Table 18: Scotland Salmon Industry Revenue (Million) Forecast, by Application 2019 & 2032
- Table 19: Global Salmon Industry Revenue Million Forecast, by Country 2019 & 2032
- Table 20: China Salmon Industry Revenue (Million) Forecast, by Application 2019 & 2032
- Table 21: Japan Salmon Industry Revenue (Million) Forecast, by Application 2019 & 2032
- Table 22: Australia Salmon Industry Revenue (Million) Forecast, by Application 2019 & 2032
- Table 23: Global Salmon Industry Revenue Million Forecast, by Country 2019 & 2032
- Table 24: Chile Salmon Industry Revenue (Million) Forecast, by Application 2019 & 2032
- Table 25: Global Salmon Industry Revenue Million Forecast, by Country 2019 & 2032
- Table 26: Middle East Salmon Industry Revenue (Million) Forecast, by Application 2019 & 2032
- Table 27: Africa Salmon Industry Revenue (Million) Forecast, by Application 2019 & 2032
- Table 28: Global Salmon Industry Revenue Million Forecast, by Species Type 2019 & 2032
- Table 29: Global Salmon Industry Revenue Million Forecast, by Type 2019 & 2032
- Table 30: Global Salmon Industry Revenue Million Forecast, by Species Type 2019 & 2032
- Table 31: Global Salmon Industry Revenue Million Forecast, by Type 2019 & 2032
- Table 32: Global Salmon Industry Revenue Million Forecast, by Country 2019 & 2032
- Table 33: United States Salmon Industry Revenue (Million) Forecast, by Application 2019 & 2032
- Table 34: Canada Salmon Industry Revenue (Million) Forecast, by Application 2019 & 2032
- Table 35: Global Salmon Industry Revenue Million Forecast, by Species Type 2019 & 2032
- Table 36: Global Salmon Industry Revenue Million Forecast, by Type 2019 & 2032
- Table 37: Global Salmon Industry Revenue Million Forecast, by Species Type 2019 & 2032
- Table 38: Global Salmon Industry Revenue Million Forecast, by Type 2019 & 2032
- Table 39: Global Salmon Industry Revenue Million Forecast, by Country 2019 & 2032
- Table 40: Norway Salmon Industry Revenue (Million) Forecast, by Application 2019 & 2032
- Table 41: Spain Salmon Industry Revenue (Million) Forecast, by Application 2019 & 2032
- Table 42: Netherlands Salmon Industry Revenue (Million) Forecast, by Application 2019 & 2032
- Table 43: France Salmon Industry Revenue (Million) Forecast, by Application 2019 & 2032
- Table 44: Italy Salmon Industry Revenue (Million) Forecast, by Application 2019 & 2032
- Table 45: Greece Salmon Industry Revenue (Million) Forecast, by Application 2019 & 2032
- Table 46: United Kingdom Salmon Industry Revenue (Million) Forecast, by Application 2019 & 2032
- Table 47: Scotland Salmon Industry Revenue (Million) Forecast, by Application 2019 & 2032
- Table 48: Global Salmon Industry Revenue Million Forecast, by Species Type 2019 & 2032
- Table 49: Global Salmon Industry Revenue Million Forecast, by Type 2019 & 2032
- Table 50: Global Salmon Industry Revenue Million Forecast, by Species Type 2019 & 2032
- Table 51: Global Salmon Industry Revenue Million Forecast, by Type 2019 & 2032
- Table 52: Global Salmon Industry Revenue Million Forecast, by Country 2019 & 2032
- Table 53: China Salmon Industry Revenue (Million) Forecast, by Application 2019 & 2032
- Table 54: Japan Salmon Industry Revenue (Million) Forecast, by Application 2019 & 2032
- Table 55: Australia Salmon Industry Revenue (Million) Forecast, by Application 2019 & 2032
- Table 56: Global Salmon Industry Revenue Million Forecast, by Species Type 2019 & 2032
- Table 57: Global Salmon Industry Revenue Million Forecast, by Type 2019 & 2032
- Table 58: Global Salmon Industry Revenue Million Forecast, by Species Type 2019 & 2032
- Table 59: Global Salmon Industry Revenue Million Forecast, by Type 2019 & 2032
- Table 60: Global Salmon Industry Revenue Million Forecast, by Country 2019 & 2032
- Table 61: Chile Salmon Industry Revenue (Million) Forecast, by Application 2019 & 2032
Frequently Asked Questions
1. What is the projected Compound Annual Growth Rate (CAGR) of the Salmon Industry?
The projected CAGR is approximately 8.07%.
2. Which companies are prominent players in the Salmon Industry?
Key companies in the market include Leroy Seafood Group , Cooke Aquaculture , Cermaq, Mowi , Grieg Seafood .
3. What are the main segments of the Salmon Industry?
The market segments include Species Type, Type, Species Type, Type.
4. Can you provide details about the market size?
The market size is estimated to be USD 33.50 Million as of 2022.
5. What are some drivers contributing to market growth?
; Awareness About Health Benefits Associated With Pecan Consumption; Wide Application of Pecan.
6. What are the notable trends driving market growth?
Healthy Boost in the Salmon Production.
7. Are there any restraints impacting market growth?
; Volatility in the Prices; Adverse Weather Conditions Affecting Yield.
8. Can you provide examples of recent developments in the market?
N/A
9. What pricing options are available for accessing the report?
Pricing options include single-user, multi-user, and enterprise licenses priced at USD 4750, USD 5250, and USD 8750 respectively.
10. Is the market size provided in terms of value or volume?
The market size is provided in terms of value, measured in Million.
11. Are there any specific market keywords associated with the report?
Yes, the market keyword associated with the report is "Salmon Industry," which aids in identifying and referencing the specific market segment covered.
12. How do I determine which pricing option suits my needs best?
The pricing options vary based on user requirements and access needs. Individual users may opt for single-user licenses, while businesses requiring broader access may choose multi-user or enterprise licenses for cost-effective access to the report.
13. Are there any additional resources or data provided in the Salmon Industry report?
While the report offers comprehensive insights, it's advisable to review the specific contents or supplementary materials provided to ascertain if additional resources or data are available.
14. How can I stay updated on further developments or reports in the Salmon Industry?
To stay informed about further developments, trends, and reports in the Salmon Industry, consider subscribing to industry newsletters, following relevant companies and organizations, or regularly checking reputable industry news sources and publications.
Methodology
Step 1 - Identification of Relevant Samples Size from Population Database


Step 2 - Approaches for Defining Global Market Size (Value, Volume* & Price*)

Note*: In applicable scenarios
Step 3 - Data Sources
Primary Research
- Web Analytics
- Survey Reports
- Research Institute
- Latest Research Reports
- Opinion Leaders
Secondary Research
- Annual Reports
- White Paper
- Latest Press Release
- Industry Association
- Paid Database
- Investor Presentations

Step 4 - Data Triangulation
Involves using different sources of information in order to increase the validity of a study
These sources are likely to be stakeholders in a program - participants, other researchers, program staff, other community members, and so on.
Then we put all data in single framework & apply various statistical tools to find out the dynamic on the market.
During the analysis stage, feedback from the stakeholder groups would be compared to determine areas of agreement as well as areas of divergence


