

Key Insights
The global Semiconductor Wet Process Pumps market is projected to reach a substantial USD 6.9 billion in 2025, demonstrating a robust CAGR of 4.8% over the forecast period of 2025-2033. This significant market valuation is driven by the escalating demand for advanced semiconductor devices across various sectors, including consumer electronics, automotive, and telecommunications. The continuous innovation in semiconductor manufacturing processes, necessitating highly precise and reliable wet processing equipment, is a primary growth catalyst. Advancements in wafer cleaning, wafer CMP (Chemical Mechanical Planarization), wafer electroplating, wafer wet etching, and wafer stripping technologies all rely heavily on sophisticated pump systems to ensure efficiency, purity, and yield. The increasing complexity of integrated circuits and the miniaturization trend further amplify the need for high-performance pumps capable of handling aggressive chemicals and maintaining ultra-high purity environments.
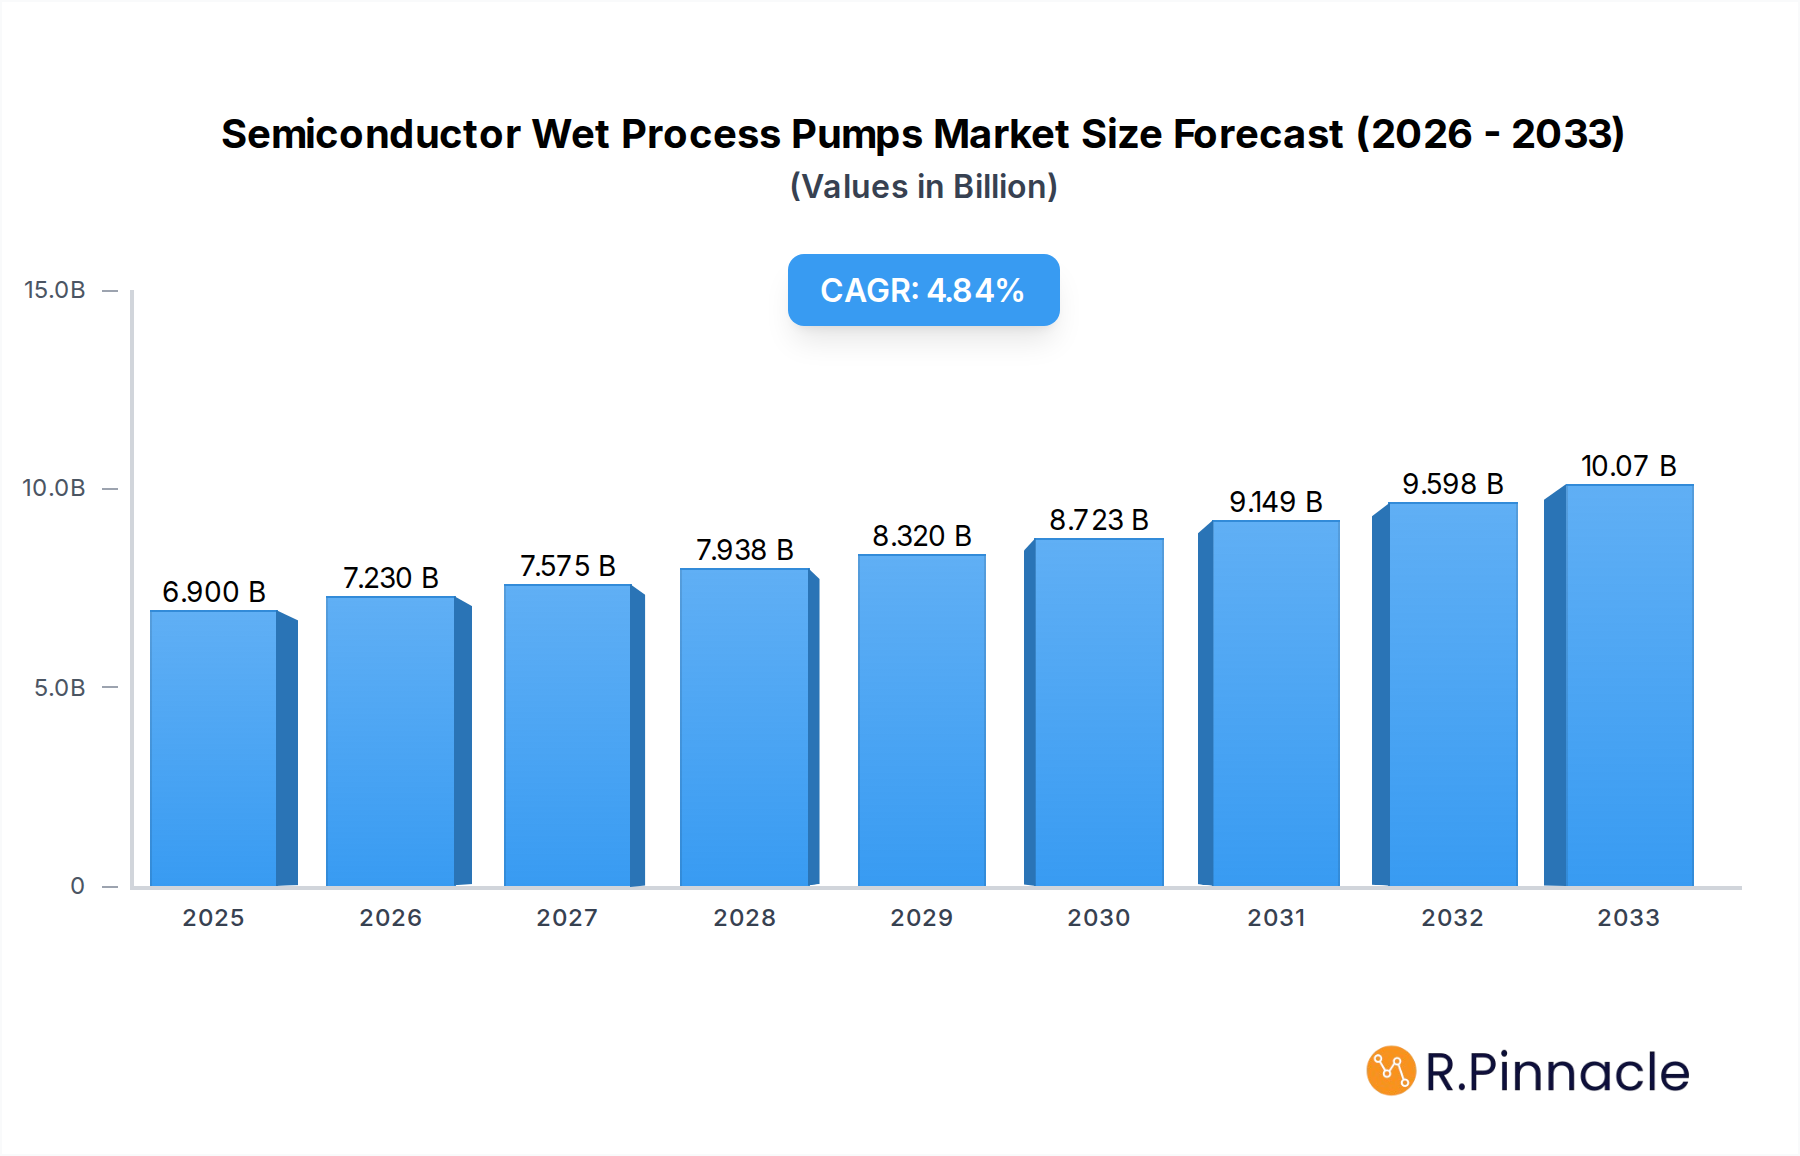
Semiconductor Wet Process Pumps Market Size (In Billion)
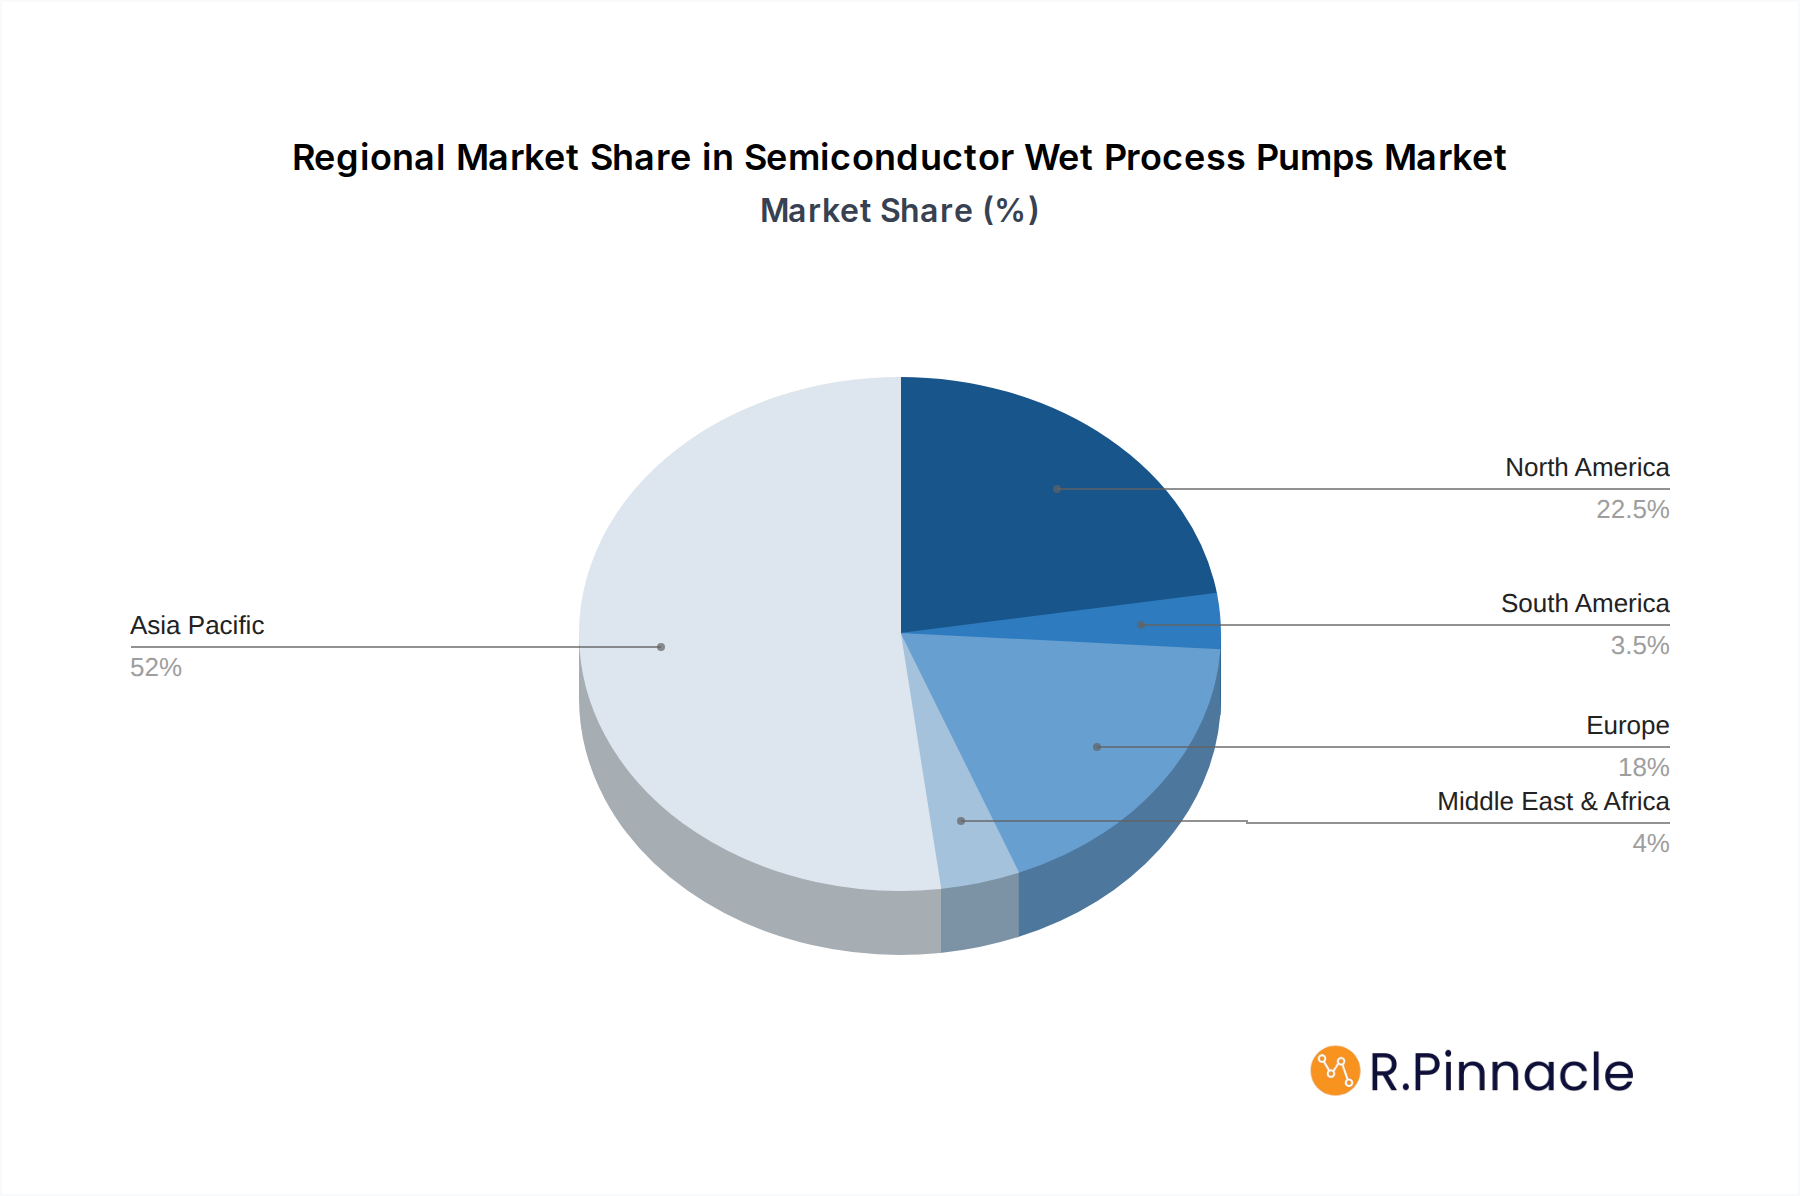
Key trends shaping the Semiconductor Wet Process Pumps market include the adoption of Maglev pumps, known for their contactless operation, reduced wear, and enhanced chemical resistance, which are becoming increasingly favored for critical applications. Diaphragm and Bellows pumps also continue to hold significant market share due to their proven reliability and cost-effectiveness in various wet process stages. Geographically, the Asia Pacific region, particularly China, Japan, and South Korea, is expected to dominate the market due to the concentration of semiconductor manufacturing facilities and significant investments in expanding production capacity. North America and Europe also represent substantial markets, driven by technological advancements and the presence of leading semiconductor manufacturers. While the market exhibits strong growth potential, challenges such as stringent environmental regulations regarding chemical waste disposal and the high initial investment cost for advanced pump technologies could pose moderate restraints. However, the overarching demand for semiconductors and the continuous push for higher manufacturing yields are expected to outweigh these challenges, ensuring sustained market expansion.

Semiconductor Wet Process Pumps Company Market Share
This comprehensive report delves into the intricate landscape of the Semiconductor Wet Process Pumps market, offering an in-depth analysis from 2019 to 2033. With a base year of 2025 and an extended forecast period, this study provides invaluable insights into market structure, dynamics, dominant regions, product innovations, and strategic opportunities. We meticulously examine the role of key players, industry developments, and growth drivers to equip stakeholders with actionable intelligence for navigating this rapidly evolving sector. This report is tailored for industry professionals seeking to understand market concentration, innovation trends, regulatory frameworks, competitive landscapes, and the impact of technological advancements on wafer processing.
Semiconductor Wet Process Pumps Market Structure & Innovation Trends
The Semiconductor Wet Process Pumps market is characterized by a moderate to high level of concentration, with a significant portion of the market share held by established global manufacturers. Innovation remains a primary driver, fueled by the relentless demand for higher wafer yields, increased process precision, and reduced contamination in semiconductor fabrication. Key innovation areas include the development of magnetic levitation (maglev) pumps for superior fluid control and reduced wear, alongside advancements in diaphragm and bellows pump technologies offering enhanced chemical resistance and reliability. Regulatory frameworks, particularly those concerning environmental safety and chemical handling in manufacturing facilities, also influence product development and market entry. While direct product substitutes are limited due to the specialized nature of wet processing, the adoption of advanced automation and alternative processing techniques in broader semiconductor manufacturing can indirectly impact demand. End-user demographics are primarily concentrated among semiconductor fabrication plants (fabs) and contract manufacturing organizations (CMOs) globally, with a growing emphasis on high-volume manufacturing in emerging economies. Merger and acquisition (M&A) activities, while sporadic, are indicative of strategic consolidation efforts by larger players aiming to expand their product portfolios and market reach. For instance, recent M&A deals in the semiconductor equipment sector have often focused on acquiring specialized technology providers, suggesting a trend towards integration of critical process components like wet process pumps. The total value of M&A deals in this segment is estimated to reach over xx billion by 2025, underscoring strategic interest.
Semiconductor Wet Process Pumps Market Dynamics & Trends
The Semiconductor Wet Process Pumps market is poised for robust growth, driven by an escalating global demand for semiconductors across diverse end-use industries such as consumer electronics, automotive, and telecommunications. The continuous push for miniaturization and enhanced performance in integrated circuits necessitates increasingly sophisticated and precise wet processing techniques, directly boosting the demand for advanced pumps. Technological disruptions are primarily centered around material science innovations, leading to the development of pumps with superior chemical compatibility, corrosion resistance, and extended operational lifespans. The increasing adoption of ultra-pure water (UPW) and aggressive chemical formulations in wafer cleaning, etching, and stripping processes necessitates pumps capable of handling highly corrosive fluids without compromising purity or integrity. Consumer preferences, as reflected in the booming demand for 5G devices, artificial intelligence-powered applications, and the Internet of Things (IoT), directly translate into increased semiconductor production volumes, thus fueling the market for essential processing equipment. Competitive dynamics are intensifying, with key players focusing on differentiating through product innovation, service offerings, and localized support. The CAGR for the Semiconductor Wet Process Pumps market is projected to be around xx% during the forecast period (2025–2033). Market penetration is increasing steadily as new fabs come online and existing ones upgrade their equipment to meet the evolving demands of advanced semiconductor manufacturing. The global market size is estimated to reach over xx billion by 2025.
Dominant Regions & Segments in Semiconductor Wet Process Pumps
The Asia-Pacific region stands as the dominant force in the Semiconductor Wet Process Pumps market, with China, South Korea, Taiwan, and Japan leading the charge in semiconductor manufacturing capacity. This dominance is fueled by substantial government investments in the semiconductor industry, the presence of major global foundries, and a rapidly expanding domestic demand for electronic devices. Economic policies geared towards self-sufficiency in semiconductor production, coupled with significant infrastructure development in manufacturing hubs, further solidify Asia-Pacific's leadership.
Within applications, Wafer Cleaning consistently represents the largest segment, owing to its critical role in removing contaminants at various stages of the semiconductor manufacturing process. This segment's growth is directly correlated with the overall increase in wafer production.
- Key Drivers for Wafer Cleaning Dominance:
- Increasing demand for ultra-pure water (UPW) and advanced cleaning chemistries.
- The need for extremely low particulate contamination for advanced node fabrication.
- Expansion of global semiconductor manufacturing capacity, particularly in Asia.
In terms of pump types, Maglev Pumps are experiencing significant traction and are projected to gain substantial market share. Their ability to offer frictionless operation, precise flow control, and exceptional purity makes them ideal for advanced semiconductor processes where even minute vibrations or contamination can be detrimental.
- Key Drivers for Maglev Pump Growth:
- Demand for high-purity fluid transfer in advanced lithography and etching.
- Reduced maintenance requirements and longer lifespan compared to traditional pumps.
- Superior performance in handling aggressive chemicals and slurries.
Other critical segments like Wafer CMP (Chemical Mechanical Planarization), Wafer Wet Etching, and Wafer Stripping are also experiencing healthy growth as semiconductor complexity increases, demanding specialized pump solutions for precise chemical delivery and waste management. The market penetration of these advanced pump types is directly tied to the technological advancements in chip manufacturing.
Semiconductor Wet Process Pumps Product Innovations
Product innovations in Semiconductor Wet Process Pumps are primarily focused on enhancing fluid handling precision, chemical compatibility, and contamination control. Advancements in magnetic levitation technology are leading to frictionless operation, significantly reducing wear and tear, and thus extending pump lifespan while ensuring ultra-high purity. Diaphragm and bellows pumps are seeing improvements in material science, leading to enhanced resistance against aggressive chemicals and higher operating temperatures. These innovations translate into improved wafer yields, reduced process variability, and lower operational costs for semiconductor manufacturers. The competitive advantage lies in achieving greater flow rate accuracy, minimizing particle generation, and providing robust sealing solutions for hazardous fluids.
Report Scope & Segmentation Analysis
This report segments the Semiconductor Wet Process Pumps market across key applications and pump types.
The Application segment includes Wafer Cleaning, Wafer CMP, Wafer Electroplating, Wafer Wet Etching, Wafer Stripping, and Others. Wafer Cleaning and Wafer Wet Etching are expected to witness the highest growth rates due to their fundamental importance in chip fabrication and the increasing complexity of etching processes for advanced nodes. Market sizes within these segments are projected to grow from billions in 2025 to over xx billion by 2033, driven by technological advancements and capacity expansions.
The Types segment comprises Maglev Pumps, Diaphragm Pumps, and Bellows Pumps. Maglev pumps are anticipated to experience the most rapid expansion, driven by their superior performance in high-purity applications and advanced semiconductor manufacturing. Diaphragm and bellows pumps will continue to hold significant market share due to their established reliability and cost-effectiveness in various applications, with growth projected to reach over xx billion by 2033.
Key Drivers of Semiconductor Wet Process Pumps Growth
The growth of the Semiconductor Wet Process Pumps market is propelled by several interconnected factors. Technological advancements in semiconductor manufacturing, such as the transition to smaller process nodes (e.g., 3nm and below), necessitate highly precise and contaminant-free wet processing, driving demand for advanced pump technologies like maglev. The burgeoning global demand for semiconductors across an array of sectors, including 5G infrastructure, artificial intelligence, automotive electronics, and IoT devices, is leading to significant capacity expansions and increased wafer output, directly boosting the need for efficient and reliable wet process pumps. Supportive government initiatives and substantial investments in the semiconductor industry across various regions, particularly in Asia-Pacific, are creating a fertile ground for market expansion. Furthermore, the increasing stringency of environmental and safety regulations in chemical handling and waste management is pushing manufacturers towards pumps that offer better containment and reduced environmental impact.
Challenges in the Semiconductor Wet Process Pumps Sector
The Semiconductor Wet Process Pumps sector faces several challenges that can impede market growth. The highly specialized nature of the technology and stringent purity requirements lead to high research and development costs, impacting profitability and market entry for new players. The global supply chain disruptions, exacerbated by geopolitical tensions and unforeseen events, can affect the availability of critical raw materials and components, leading to production delays and increased costs. Intense competition among established players and emerging manufacturers, particularly from Asia, can lead to price pressures and reduced profit margins. Evolving regulatory landscapes concerning chemical usage, waste disposal, and environmental compliance in different regions require continuous adaptation and investment from manufacturers. The cyclical nature of the semiconductor industry itself, with its inherent boom-and-bust cycles, can also create demand volatility for wet process pumps.
Emerging Opportunities in Semiconductor Wet Process Pumps
Emerging opportunities in the Semiconductor Wet Process Pumps market are abundant, driven by ongoing technological evolution and expanding application frontiers. The increasing adoption of advanced packaging technologies, such as fan-out wafer-level packaging, requires specialized wet processing steps, creating new avenues for pump manufacturers. The growing demand for power semiconductors and advanced display technologies (e.g., OLEDs) also involves intricate wet processing, presenting untapped market potential. The development of novel, environmentally friendly chemistries and slurries for wafer processing opens doors for pumps designed to handle these new formulations efficiently and safely. Furthermore, the increasing trend towards Industry 4.0 and smart manufacturing is creating opportunities for pumps equipped with advanced sensor technology and connectivity for real-time performance monitoring and predictive maintenance, offering enhanced operational efficiency to end-users.
Leading Players in the Semiconductor Wet Process Pumps Market
- Trebor International
- White Knight (Graco)
- Saint-Gobain
- SAT Group
- Levitronix
- IWAKI
- Yamada Pump
- Nippon Pillar
- Dino Technology
- Shenzhen Sicarrier Technologies
- Shengyi Semiconductor Technology
- Panther Tech
- Zhejiang Cheer Technology
- Suzhou Supermag Intelligent Technology
- Ningbo Zhongjie Laitong Technology
- FUXUELAI
- Changzhou Ruize Microelectronics
- Nantong CSE Semiconductor Equipment
- FURAC
- Besilan
- Yanmu Technology
- Jiangsu Minglisi Semiconductor
Key Developments in Semiconductor Wet Process Pumps Industry
- 2023 March: Levitronix launched a new generation of maglev pumps designed for enhanced flow stability and chemical resistance, targeting advanced lithography applications.
- 2023 May: White Knight (Graco) announced the expansion of its diaphragm pump product line with new materials capable of handling aggressive media for wafer cleaning.
- 2023 August: SAT Group reported significant investments in R&D for next-generation bellows pumps to meet the demands of high-volume manufacturing for smart device components.
- 2023 November: Shenzhen Sicarrier Technologies showcased innovative pump solutions with integrated sensing capabilities for real-time process monitoring at a major industry expo.
- 2024 January: Furac announced a strategic partnership with a leading semiconductor equipment manufacturer to integrate their specialized wet process pumps into new fab solutions.
- 2024 April: Saint-Gobain unveiled new pump components utilizing advanced polymer technologies to offer superior chemical inertness and longer service life.
- 2024 June: IWAKI introduced a compact and energy-efficient bellows pump designed for space-constrained cleanroom environments.
- 2024 September: Zhejiang Cheer Technology announced advancements in their maglev pump technology, focusing on reduced particle generation for advanced node wafer processing.
Future Outlook for Semiconductor Wet Process Pumps Market
The future outlook for the Semiconductor Wet Process Pumps market is exceptionally positive, driven by the sustained global demand for semiconductors and the continuous innovation within the industry. The relentless pursuit of higher performance, greater efficiency, and reduced environmental impact in semiconductor manufacturing will continue to fuel the development and adoption of advanced pump technologies. Opportunities in emerging markets and evolving applications like advanced packaging and power electronics will provide significant growth accelerators. Strategic collaborations, technological partnerships, and a focus on product differentiation through enhanced purity, reliability, and smart functionalities will be crucial for market players. The market is expected to witness steady growth, with a significant shift towards higher-performance and specialized pump solutions to meet the increasingly demanding requirements of future semiconductor fabrication processes.
Semiconductor Wet Process Pumps Segmentation
-
1. Application
- 1.1. Wafer Cleaning
- 1.2. Wafer CMP
- 1.3. Wafer Electroplating
- 1.4. Wafer Wet Etching
- 1.5. Wafer Stripping
- 1.6. Others
-
2. Types
- 2.1. Maglev Pumps
- 2.2. Diaphragm Pumps
- 2.3. Bellows Pumps
Semiconductor Wet Process Pumps Segmentation By Geography
-
1. North America
- 1.1. United States
- 1.2. Canada
- 1.3. Mexico
-
2. South America
- 2.1. Brazil
- 2.2. Argentina
- 2.3. Rest of South America
-
3. Europe
- 3.1. United Kingdom
- 3.2. Germany
- 3.3. France
- 3.4. Italy
- 3.5. Spain
- 3.6. Russia
- 3.7. Benelux
- 3.8. Nordics
- 3.9. Rest of Europe
-
4. Middle East & Africa
- 4.1. Turkey
- 4.2. Israel
- 4.3. GCC
- 4.4. North Africa
- 4.5. South Africa
- 4.6. Rest of Middle East & Africa
-
5. Asia Pacific
- 5.1. China
- 5.2. India
- 5.3. Japan
- 5.4. South Korea
- 5.5. ASEAN
- 5.6. Oceania
- 5.7. Rest of Asia Pacific
Semiconductor Wet Process Pumps Regional Market Share
Geographic Coverage of Semiconductor Wet Process Pumps
Semiconductor Wet Process Pumps REPORT HIGHLIGHTS
| Aspects | Details |
|---|---|
| Study Period | 2020-2034 |
| Base Year | 2025 |
| Estimated Year | 2026 |
| Forecast Period | 2026-2034 |
| Historical Period | 2020-2025 |
| Growth Rate | CAGR of 8% from 2020-2034 |
| Segmentation |
|
Table of Contents
- 1. Introduction
- 1.1. Research Scope
- 1.2. Market Segmentation
- 1.3. Research Methodology
- 1.4. Definitions and Assumptions
- 2. Executive Summary
- 2.1. Introduction
- 3. Market Dynamics
- 3.1. Introduction
- 3.2. Market Drivers
- 3.3. Market Restrains
- 3.4. Market Trends
- 4. Market Factor Analysis
- 4.1. Porters Five Forces
- 4.2. Supply/Value Chain
- 4.3. PESTEL analysis
- 4.4. Market Entropy
- 4.5. Patent/Trademark Analysis
- 5. Global Semiconductor Wet Process Pumps Analysis, Insights and Forecast, 2020-2032
- 5.1. Market Analysis, Insights and Forecast - by Application
- 5.1.1. Wafer Cleaning
- 5.1.2. Wafer CMP
- 5.1.3. Wafer Electroplating
- 5.1.4. Wafer Wet Etching
- 5.1.5. Wafer Stripping
- 5.1.6. Others
- 5.2. Market Analysis, Insights and Forecast - by Types
- 5.2.1. Maglev Pumps
- 5.2.2. Diaphragm Pumps
- 5.2.3. Bellows Pumps
- 5.3. Market Analysis, Insights and Forecast - by Region
- 5.3.1. North America
- 5.3.2. South America
- 5.3.3. Europe
- 5.3.4. Middle East & Africa
- 5.3.5. Asia Pacific
- 5.1. Market Analysis, Insights and Forecast - by Application
- 6. North America Semiconductor Wet Process Pumps Analysis, Insights and Forecast, 2020-2032
- 6.1. Market Analysis, Insights and Forecast - by Application
- 6.1.1. Wafer Cleaning
- 6.1.2. Wafer CMP
- 6.1.3. Wafer Electroplating
- 6.1.4. Wafer Wet Etching
- 6.1.5. Wafer Stripping
- 6.1.6. Others
- 6.2. Market Analysis, Insights and Forecast - by Types
- 6.2.1. Maglev Pumps
- 6.2.2. Diaphragm Pumps
- 6.2.3. Bellows Pumps
- 6.1. Market Analysis, Insights and Forecast - by Application
- 7. South America Semiconductor Wet Process Pumps Analysis, Insights and Forecast, 2020-2032
- 7.1. Market Analysis, Insights and Forecast - by Application
- 7.1.1. Wafer Cleaning
- 7.1.2. Wafer CMP
- 7.1.3. Wafer Electroplating
- 7.1.4. Wafer Wet Etching
- 7.1.5. Wafer Stripping
- 7.1.6. Others
- 7.2. Market Analysis, Insights and Forecast - by Types
- 7.2.1. Maglev Pumps
- 7.2.2. Diaphragm Pumps
- 7.2.3. Bellows Pumps
- 7.1. Market Analysis, Insights and Forecast - by Application
- 8. Europe Semiconductor Wet Process Pumps Analysis, Insights and Forecast, 2020-2032
- 8.1. Market Analysis, Insights and Forecast - by Application
- 8.1.1. Wafer Cleaning
- 8.1.2. Wafer CMP
- 8.1.3. Wafer Electroplating
- 8.1.4. Wafer Wet Etching
- 8.1.5. Wafer Stripping
- 8.1.6. Others
- 8.2. Market Analysis, Insights and Forecast - by Types
- 8.2.1. Maglev Pumps
- 8.2.2. Diaphragm Pumps
- 8.2.3. Bellows Pumps
- 8.1. Market Analysis, Insights and Forecast - by Application
- 9. Middle East & Africa Semiconductor Wet Process Pumps Analysis, Insights and Forecast, 2020-2032
- 9.1. Market Analysis, Insights and Forecast - by Application
- 9.1.1. Wafer Cleaning
- 9.1.2. Wafer CMP
- 9.1.3. Wafer Electroplating
- 9.1.4. Wafer Wet Etching
- 9.1.5. Wafer Stripping
- 9.1.6. Others
- 9.2. Market Analysis, Insights and Forecast - by Types
- 9.2.1. Maglev Pumps
- 9.2.2. Diaphragm Pumps
- 9.2.3. Bellows Pumps
- 9.1. Market Analysis, Insights and Forecast - by Application
- 10. Asia Pacific Semiconductor Wet Process Pumps Analysis, Insights and Forecast, 2020-2032
- 10.1. Market Analysis, Insights and Forecast - by Application
- 10.1.1. Wafer Cleaning
- 10.1.2. Wafer CMP
- 10.1.3. Wafer Electroplating
- 10.1.4. Wafer Wet Etching
- 10.1.5. Wafer Stripping
- 10.1.6. Others
- 10.2. Market Analysis, Insights and Forecast - by Types
- 10.2.1. Maglev Pumps
- 10.2.2. Diaphragm Pumps
- 10.2.3. Bellows Pumps
- 10.1. Market Analysis, Insights and Forecast - by Application
- 11. Competitive Analysis
- 11.1. Global Market Share Analysis 2025
- 11.2. Company Profiles
- 11.2.1 Trebor International
- 11.2.1.1. Overview
- 11.2.1.2. Products
- 11.2.1.3. SWOT Analysis
- 11.2.1.4. Recent Developments
- 11.2.1.5. Financials (Based on Availability)
- 11.2.2 White Knight (Graco)
- 11.2.2.1. Overview
- 11.2.2.2. Products
- 11.2.2.3. SWOT Analysis
- 11.2.2.4. Recent Developments
- 11.2.2.5. Financials (Based on Availability)
- 11.2.3 Saint-Gobain
- 11.2.3.1. Overview
- 11.2.3.2. Products
- 11.2.3.3. SWOT Analysis
- 11.2.3.4. Recent Developments
- 11.2.3.5. Financials (Based on Availability)
- 11.2.4 SAT Group
- 11.2.4.1. Overview
- 11.2.4.2. Products
- 11.2.4.3. SWOT Analysis
- 11.2.4.4. Recent Developments
- 11.2.4.5. Financials (Based on Availability)
- 11.2.5 Levitronix
- 11.2.5.1. Overview
- 11.2.5.2. Products
- 11.2.5.3. SWOT Analysis
- 11.2.5.4. Recent Developments
- 11.2.5.5. Financials (Based on Availability)
- 11.2.6 IWAKI
- 11.2.6.1. Overview
- 11.2.6.2. Products
- 11.2.6.3. SWOT Analysis
- 11.2.6.4. Recent Developments
- 11.2.6.5. Financials (Based on Availability)
- 11.2.7 Yamada Pump
- 11.2.7.1. Overview
- 11.2.7.2. Products
- 11.2.7.3. SWOT Analysis
- 11.2.7.4. Recent Developments
- 11.2.7.5. Financials (Based on Availability)
- 11.2.8 Nippon Pillar
- 11.2.8.1. Overview
- 11.2.8.2. Products
- 11.2.8.3. SWOT Analysis
- 11.2.8.4. Recent Developments
- 11.2.8.5. Financials (Based on Availability)
- 11.2.9 Dino Technology
- 11.2.9.1. Overview
- 11.2.9.2. Products
- 11.2.9.3. SWOT Analysis
- 11.2.9.4. Recent Developments
- 11.2.9.5. Financials (Based on Availability)
- 11.2.10 Shenzhen Sicarrier Technologies
- 11.2.10.1. Overview
- 11.2.10.2. Products
- 11.2.10.3. SWOT Analysis
- 11.2.10.4. Recent Developments
- 11.2.10.5. Financials (Based on Availability)
- 11.2.11 Shengyi Semiconductor Technology
- 11.2.11.1. Overview
- 11.2.11.2. Products
- 11.2.11.3. SWOT Analysis
- 11.2.11.4. Recent Developments
- 11.2.11.5. Financials (Based on Availability)
- 11.2.12 Panther Tech
- 11.2.12.1. Overview
- 11.2.12.2. Products
- 11.2.12.3. SWOT Analysis
- 11.2.12.4. Recent Developments
- 11.2.12.5. Financials (Based on Availability)
- 11.2.13 Zhejiang Cheer Technology
- 11.2.13.1. Overview
- 11.2.13.2. Products
- 11.2.13.3. SWOT Analysis
- 11.2.13.4. Recent Developments
- 11.2.13.5. Financials (Based on Availability)
- 11.2.14 Suzhou Supermag Intelligent Technology
- 11.2.14.1. Overview
- 11.2.14.2. Products
- 11.2.14.3. SWOT Analysis
- 11.2.14.4. Recent Developments
- 11.2.14.5. Financials (Based on Availability)
- 11.2.15 Ningbo Zhongjie Laitong Technology
- 11.2.15.1. Overview
- 11.2.15.2. Products
- 11.2.15.3. SWOT Analysis
- 11.2.15.4. Recent Developments
- 11.2.15.5. Financials (Based on Availability)
- 11.2.16 FUXUELAI
- 11.2.16.1. Overview
- 11.2.16.2. Products
- 11.2.16.3. SWOT Analysis
- 11.2.16.4. Recent Developments
- 11.2.16.5. Financials (Based on Availability)
- 11.2.17 Changzhou Ruize Microelectronics
- 11.2.17.1. Overview
- 11.2.17.2. Products
- 11.2.17.3. SWOT Analysis
- 11.2.17.4. Recent Developments
- 11.2.17.5. Financials (Based on Availability)
- 11.2.18 Nantong CSE Semiconductor Equipment
- 11.2.18.1. Overview
- 11.2.18.2. Products
- 11.2.18.3. SWOT Analysis
- 11.2.18.4. Recent Developments
- 11.2.18.5. Financials (Based on Availability)
- 11.2.19 FURAC
- 11.2.19.1. Overview
- 11.2.19.2. Products
- 11.2.19.3. SWOT Analysis
- 11.2.19.4. Recent Developments
- 11.2.19.5. Financials (Based on Availability)
- 11.2.20 Besilan
- 11.2.20.1. Overview
- 11.2.20.2. Products
- 11.2.20.3. SWOT Analysis
- 11.2.20.4. Recent Developments
- 11.2.20.5. Financials (Based on Availability)
- 11.2.21 Yanmu Technology
- 11.2.21.1. Overview
- 11.2.21.2. Products
- 11.2.21.3. SWOT Analysis
- 11.2.21.4. Recent Developments
- 11.2.21.5. Financials (Based on Availability)
- 11.2.22 Jiangsu Minglisi Semiconductor
- 11.2.22.1. Overview
- 11.2.22.2. Products
- 11.2.22.3. SWOT Analysis
- 11.2.22.4. Recent Developments
- 11.2.22.5. Financials (Based on Availability)
- 11.2.1 Trebor International
List of Figures
- Figure 1: Global Semiconductor Wet Process Pumps Revenue Breakdown (undefined, %) by Region 2025 & 2033
- Figure 2: Global Semiconductor Wet Process Pumps Volume Breakdown (K, %) by Region 2025 & 2033
- Figure 3: North America Semiconductor Wet Process Pumps Revenue (undefined), by Application 2025 & 2033
- Figure 4: North America Semiconductor Wet Process Pumps Volume (K), by Application 2025 & 2033
- Figure 5: North America Semiconductor Wet Process Pumps Revenue Share (%), by Application 2025 & 2033
- Figure 6: North America Semiconductor Wet Process Pumps Volume Share (%), by Application 2025 & 2033
- Figure 7: North America Semiconductor Wet Process Pumps Revenue (undefined), by Types 2025 & 2033
- Figure 8: North America Semiconductor Wet Process Pumps Volume (K), by Types 2025 & 2033
- Figure 9: North America Semiconductor Wet Process Pumps Revenue Share (%), by Types 2025 & 2033
- Figure 10: North America Semiconductor Wet Process Pumps Volume Share (%), by Types 2025 & 2033
- Figure 11: North America Semiconductor Wet Process Pumps Revenue (undefined), by Country 2025 & 2033
- Figure 12: North America Semiconductor Wet Process Pumps Volume (K), by Country 2025 & 2033
- Figure 13: North America Semiconductor Wet Process Pumps Revenue Share (%), by Country 2025 & 2033
- Figure 14: North America Semiconductor Wet Process Pumps Volume Share (%), by Country 2025 & 2033
- Figure 15: South America Semiconductor Wet Process Pumps Revenue (undefined), by Application 2025 & 2033
- Figure 16: South America Semiconductor Wet Process Pumps Volume (K), by Application 2025 & 2033
- Figure 17: South America Semiconductor Wet Process Pumps Revenue Share (%), by Application 2025 & 2033
- Figure 18: South America Semiconductor Wet Process Pumps Volume Share (%), by Application 2025 & 2033
- Figure 19: South America Semiconductor Wet Process Pumps Revenue (undefined), by Types 2025 & 2033
- Figure 20: South America Semiconductor Wet Process Pumps Volume (K), by Types 2025 & 2033
- Figure 21: South America Semiconductor Wet Process Pumps Revenue Share (%), by Types 2025 & 2033
- Figure 22: South America Semiconductor Wet Process Pumps Volume Share (%), by Types 2025 & 2033
- Figure 23: South America Semiconductor Wet Process Pumps Revenue (undefined), by Country 2025 & 2033
- Figure 24: South America Semiconductor Wet Process Pumps Volume (K), by Country 2025 & 2033
- Figure 25: South America Semiconductor Wet Process Pumps Revenue Share (%), by Country 2025 & 2033
- Figure 26: South America Semiconductor Wet Process Pumps Volume Share (%), by Country 2025 & 2033
- Figure 27: Europe Semiconductor Wet Process Pumps Revenue (undefined), by Application 2025 & 2033
- Figure 28: Europe Semiconductor Wet Process Pumps Volume (K), by Application 2025 & 2033
- Figure 29: Europe Semiconductor Wet Process Pumps Revenue Share (%), by Application 2025 & 2033
- Figure 30: Europe Semiconductor Wet Process Pumps Volume Share (%), by Application 2025 & 2033
- Figure 31: Europe Semiconductor Wet Process Pumps Revenue (undefined), by Types 2025 & 2033
- Figure 32: Europe Semiconductor Wet Process Pumps Volume (K), by Types 2025 & 2033
- Figure 33: Europe Semiconductor Wet Process Pumps Revenue Share (%), by Types 2025 & 2033
- Figure 34: Europe Semiconductor Wet Process Pumps Volume Share (%), by Types 2025 & 2033
- Figure 35: Europe Semiconductor Wet Process Pumps Revenue (undefined), by Country 2025 & 2033
- Figure 36: Europe Semiconductor Wet Process Pumps Volume (K), by Country 2025 & 2033
- Figure 37: Europe Semiconductor Wet Process Pumps Revenue Share (%), by Country 2025 & 2033
- Figure 38: Europe Semiconductor Wet Process Pumps Volume Share (%), by Country 2025 & 2033
- Figure 39: Middle East & Africa Semiconductor Wet Process Pumps Revenue (undefined), by Application 2025 & 2033
- Figure 40: Middle East & Africa Semiconductor Wet Process Pumps Volume (K), by Application 2025 & 2033
- Figure 41: Middle East & Africa Semiconductor Wet Process Pumps Revenue Share (%), by Application 2025 & 2033
- Figure 42: Middle East & Africa Semiconductor Wet Process Pumps Volume Share (%), by Application 2025 & 2033
- Figure 43: Middle East & Africa Semiconductor Wet Process Pumps Revenue (undefined), by Types 2025 & 2033
- Figure 44: Middle East & Africa Semiconductor Wet Process Pumps Volume (K), by Types 2025 & 2033
- Figure 45: Middle East & Africa Semiconductor Wet Process Pumps Revenue Share (%), by Types 2025 & 2033
- Figure 46: Middle East & Africa Semiconductor Wet Process Pumps Volume Share (%), by Types 2025 & 2033
- Figure 47: Middle East & Africa Semiconductor Wet Process Pumps Revenue (undefined), by Country 2025 & 2033
- Figure 48: Middle East & Africa Semiconductor Wet Process Pumps Volume (K), by Country 2025 & 2033
- Figure 49: Middle East & Africa Semiconductor Wet Process Pumps Revenue Share (%), by Country 2025 & 2033
- Figure 50: Middle East & Africa Semiconductor Wet Process Pumps Volume Share (%), by Country 2025 & 2033
- Figure 51: Asia Pacific Semiconductor Wet Process Pumps Revenue (undefined), by Application 2025 & 2033
- Figure 52: Asia Pacific Semiconductor Wet Process Pumps Volume (K), by Application 2025 & 2033
- Figure 53: Asia Pacific Semiconductor Wet Process Pumps Revenue Share (%), by Application 2025 & 2033
- Figure 54: Asia Pacific Semiconductor Wet Process Pumps Volume Share (%), by Application 2025 & 2033
- Figure 55: Asia Pacific Semiconductor Wet Process Pumps Revenue (undefined), by Types 2025 & 2033
- Figure 56: Asia Pacific Semiconductor Wet Process Pumps Volume (K), by Types 2025 & 2033
- Figure 57: Asia Pacific Semiconductor Wet Process Pumps Revenue Share (%), by Types 2025 & 2033
- Figure 58: Asia Pacific Semiconductor Wet Process Pumps Volume Share (%), by Types 2025 & 2033
- Figure 59: Asia Pacific Semiconductor Wet Process Pumps Revenue (undefined), by Country 2025 & 2033
- Figure 60: Asia Pacific Semiconductor Wet Process Pumps Volume (K), by Country 2025 & 2033
- Figure 61: Asia Pacific Semiconductor Wet Process Pumps Revenue Share (%), by Country 2025 & 2033
- Figure 62: Asia Pacific Semiconductor Wet Process Pumps Volume Share (%), by Country 2025 & 2033
List of Tables
- Table 1: Global Semiconductor Wet Process Pumps Revenue undefined Forecast, by Application 2020 & 2033
- Table 2: Global Semiconductor Wet Process Pumps Volume K Forecast, by Application 2020 & 2033
- Table 3: Global Semiconductor Wet Process Pumps Revenue undefined Forecast, by Types 2020 & 2033
- Table 4: Global Semiconductor Wet Process Pumps Volume K Forecast, by Types 2020 & 2033
- Table 5: Global Semiconductor Wet Process Pumps Revenue undefined Forecast, by Region 2020 & 2033
- Table 6: Global Semiconductor Wet Process Pumps Volume K Forecast, by Region 2020 & 2033
- Table 7: Global Semiconductor Wet Process Pumps Revenue undefined Forecast, by Application 2020 & 2033
- Table 8: Global Semiconductor Wet Process Pumps Volume K Forecast, by Application 2020 & 2033
- Table 9: Global Semiconductor Wet Process Pumps Revenue undefined Forecast, by Types 2020 & 2033
- Table 10: Global Semiconductor Wet Process Pumps Volume K Forecast, by Types 2020 & 2033
- Table 11: Global Semiconductor Wet Process Pumps Revenue undefined Forecast, by Country 2020 & 2033
- Table 12: Global Semiconductor Wet Process Pumps Volume K Forecast, by Country 2020 & 2033
- Table 13: United States Semiconductor Wet Process Pumps Revenue (undefined) Forecast, by Application 2020 & 2033
- Table 14: United States Semiconductor Wet Process Pumps Volume (K) Forecast, by Application 2020 & 2033
- Table 15: Canada Semiconductor Wet Process Pumps Revenue (undefined) Forecast, by Application 2020 & 2033
- Table 16: Canada Semiconductor Wet Process Pumps Volume (K) Forecast, by Application 2020 & 2033
- Table 17: Mexico Semiconductor Wet Process Pumps Revenue (undefined) Forecast, by Application 2020 & 2033
- Table 18: Mexico Semiconductor Wet Process Pumps Volume (K) Forecast, by Application 2020 & 2033
- Table 19: Global Semiconductor Wet Process Pumps Revenue undefined Forecast, by Application 2020 & 2033
- Table 20: Global Semiconductor Wet Process Pumps Volume K Forecast, by Application 2020 & 2033
- Table 21: Global Semiconductor Wet Process Pumps Revenue undefined Forecast, by Types 2020 & 2033
- Table 22: Global Semiconductor Wet Process Pumps Volume K Forecast, by Types 2020 & 2033
- Table 23: Global Semiconductor Wet Process Pumps Revenue undefined Forecast, by Country 2020 & 2033
- Table 24: Global Semiconductor Wet Process Pumps Volume K Forecast, by Country 2020 & 2033
- Table 25: Brazil Semiconductor Wet Process Pumps Revenue (undefined) Forecast, by Application 2020 & 2033
- Table 26: Brazil Semiconductor Wet Process Pumps Volume (K) Forecast, by Application 2020 & 2033
- Table 27: Argentina Semiconductor Wet Process Pumps Revenue (undefined) Forecast, by Application 2020 & 2033
- Table 28: Argentina Semiconductor Wet Process Pumps Volume (K) Forecast, by Application 2020 & 2033
- Table 29: Rest of South America Semiconductor Wet Process Pumps Revenue (undefined) Forecast, by Application 2020 & 2033
- Table 30: Rest of South America Semiconductor Wet Process Pumps Volume (K) Forecast, by Application 2020 & 2033
- Table 31: Global Semiconductor Wet Process Pumps Revenue undefined Forecast, by Application 2020 & 2033
- Table 32: Global Semiconductor Wet Process Pumps Volume K Forecast, by Application 2020 & 2033
- Table 33: Global Semiconductor Wet Process Pumps Revenue undefined Forecast, by Types 2020 & 2033
- Table 34: Global Semiconductor Wet Process Pumps Volume K Forecast, by Types 2020 & 2033
- Table 35: Global Semiconductor Wet Process Pumps Revenue undefined Forecast, by Country 2020 & 2033
- Table 36: Global Semiconductor Wet Process Pumps Volume K Forecast, by Country 2020 & 2033
- Table 37: United Kingdom Semiconductor Wet Process Pumps Revenue (undefined) Forecast, by Application 2020 & 2033
- Table 38: United Kingdom Semiconductor Wet Process Pumps Volume (K) Forecast, by Application 2020 & 2033
- Table 39: Germany Semiconductor Wet Process Pumps Revenue (undefined) Forecast, by Application 2020 & 2033
- Table 40: Germany Semiconductor Wet Process Pumps Volume (K) Forecast, by Application 2020 & 2033
- Table 41: France Semiconductor Wet Process Pumps Revenue (undefined) Forecast, by Application 2020 & 2033
- Table 42: France Semiconductor Wet Process Pumps Volume (K) Forecast, by Application 2020 & 2033
- Table 43: Italy Semiconductor Wet Process Pumps Revenue (undefined) Forecast, by Application 2020 & 2033
- Table 44: Italy Semiconductor Wet Process Pumps Volume (K) Forecast, by Application 2020 & 2033
- Table 45: Spain Semiconductor Wet Process Pumps Revenue (undefined) Forecast, by Application 2020 & 2033
- Table 46: Spain Semiconductor Wet Process Pumps Volume (K) Forecast, by Application 2020 & 2033
- Table 47: Russia Semiconductor Wet Process Pumps Revenue (undefined) Forecast, by Application 2020 & 2033
- Table 48: Russia Semiconductor Wet Process Pumps Volume (K) Forecast, by Application 2020 & 2033
- Table 49: Benelux Semiconductor Wet Process Pumps Revenue (undefined) Forecast, by Application 2020 & 2033
- Table 50: Benelux Semiconductor Wet Process Pumps Volume (K) Forecast, by Application 2020 & 2033
- Table 51: Nordics Semiconductor Wet Process Pumps Revenue (undefined) Forecast, by Application 2020 & 2033
- Table 52: Nordics Semiconductor Wet Process Pumps Volume (K) Forecast, by Application 2020 & 2033
- Table 53: Rest of Europe Semiconductor Wet Process Pumps Revenue (undefined) Forecast, by Application 2020 & 2033
- Table 54: Rest of Europe Semiconductor Wet Process Pumps Volume (K) Forecast, by Application 2020 & 2033
- Table 55: Global Semiconductor Wet Process Pumps Revenue undefined Forecast, by Application 2020 & 2033
- Table 56: Global Semiconductor Wet Process Pumps Volume K Forecast, by Application 2020 & 2033
- Table 57: Global Semiconductor Wet Process Pumps Revenue undefined Forecast, by Types 2020 & 2033
- Table 58: Global Semiconductor Wet Process Pumps Volume K Forecast, by Types 2020 & 2033
- Table 59: Global Semiconductor Wet Process Pumps Revenue undefined Forecast, by Country 2020 & 2033
- Table 60: Global Semiconductor Wet Process Pumps Volume K Forecast, by Country 2020 & 2033
- Table 61: Turkey Semiconductor Wet Process Pumps Revenue (undefined) Forecast, by Application 2020 & 2033
- Table 62: Turkey Semiconductor Wet Process Pumps Volume (K) Forecast, by Application 2020 & 2033
- Table 63: Israel Semiconductor Wet Process Pumps Revenue (undefined) Forecast, by Application 2020 & 2033
- Table 64: Israel Semiconductor Wet Process Pumps Volume (K) Forecast, by Application 2020 & 2033
- Table 65: GCC Semiconductor Wet Process Pumps Revenue (undefined) Forecast, by Application 2020 & 2033
- Table 66: GCC Semiconductor Wet Process Pumps Volume (K) Forecast, by Application 2020 & 2033
- Table 67: North Africa Semiconductor Wet Process Pumps Revenue (undefined) Forecast, by Application 2020 & 2033
- Table 68: North Africa Semiconductor Wet Process Pumps Volume (K) Forecast, by Application 2020 & 2033
- Table 69: South Africa Semiconductor Wet Process Pumps Revenue (undefined) Forecast, by Application 2020 & 2033
- Table 70: South Africa Semiconductor Wet Process Pumps Volume (K) Forecast, by Application 2020 & 2033
- Table 71: Rest of Middle East & Africa Semiconductor Wet Process Pumps Revenue (undefined) Forecast, by Application 2020 & 2033
- Table 72: Rest of Middle East & Africa Semiconductor Wet Process Pumps Volume (K) Forecast, by Application 2020 & 2033
- Table 73: Global Semiconductor Wet Process Pumps Revenue undefined Forecast, by Application 2020 & 2033
- Table 74: Global Semiconductor Wet Process Pumps Volume K Forecast, by Application 2020 & 2033
- Table 75: Global Semiconductor Wet Process Pumps Revenue undefined Forecast, by Types 2020 & 2033
- Table 76: Global Semiconductor Wet Process Pumps Volume K Forecast, by Types 2020 & 2033
- Table 77: Global Semiconductor Wet Process Pumps Revenue undefined Forecast, by Country 2020 & 2033
- Table 78: Global Semiconductor Wet Process Pumps Volume K Forecast, by Country 2020 & 2033
- Table 79: China Semiconductor Wet Process Pumps Revenue (undefined) Forecast, by Application 2020 & 2033
- Table 80: China Semiconductor Wet Process Pumps Volume (K) Forecast, by Application 2020 & 2033
- Table 81: India Semiconductor Wet Process Pumps Revenue (undefined) Forecast, by Application 2020 & 2033
- Table 82: India Semiconductor Wet Process Pumps Volume (K) Forecast, by Application 2020 & 2033
- Table 83: Japan Semiconductor Wet Process Pumps Revenue (undefined) Forecast, by Application 2020 & 2033
- Table 84: Japan Semiconductor Wet Process Pumps Volume (K) Forecast, by Application 2020 & 2033
- Table 85: South Korea Semiconductor Wet Process Pumps Revenue (undefined) Forecast, by Application 2020 & 2033
- Table 86: South Korea Semiconductor Wet Process Pumps Volume (K) Forecast, by Application 2020 & 2033
- Table 87: ASEAN Semiconductor Wet Process Pumps Revenue (undefined) Forecast, by Application 2020 & 2033
- Table 88: ASEAN Semiconductor Wet Process Pumps Volume (K) Forecast, by Application 2020 & 2033
- Table 89: Oceania Semiconductor Wet Process Pumps Revenue (undefined) Forecast, by Application 2020 & 2033
- Table 90: Oceania Semiconductor Wet Process Pumps Volume (K) Forecast, by Application 2020 & 2033
- Table 91: Rest of Asia Pacific Semiconductor Wet Process Pumps Revenue (undefined) Forecast, by Application 2020 & 2033
- Table 92: Rest of Asia Pacific Semiconductor Wet Process Pumps Volume (K) Forecast, by Application 2020 & 2033
Frequently Asked Questions
1. What is the projected Compound Annual Growth Rate (CAGR) of the Semiconductor Wet Process Pumps?
The projected CAGR is approximately 8%.
2. Which companies are prominent players in the Semiconductor Wet Process Pumps?
Key companies in the market include Trebor International, White Knight (Graco), Saint-Gobain, SAT Group, Levitronix, IWAKI, Yamada Pump, Nippon Pillar, Dino Technology, Shenzhen Sicarrier Technologies, Shengyi Semiconductor Technology, Panther Tech, Zhejiang Cheer Technology, Suzhou Supermag Intelligent Technology, Ningbo Zhongjie Laitong Technology, FUXUELAI, Changzhou Ruize Microelectronics, Nantong CSE Semiconductor Equipment, FURAC, Besilan, Yanmu Technology, Jiangsu Minglisi Semiconductor.
3. What are the main segments of the Semiconductor Wet Process Pumps?
The market segments include Application, Types.
4. Can you provide details about the market size?
The market size is estimated to be USD XXX N/A as of 2022.
5. What are some drivers contributing to market growth?
N/A
6. What are the notable trends driving market growth?
N/A
7. Are there any restraints impacting market growth?
N/A
8. Can you provide examples of recent developments in the market?
N/A
9. What pricing options are available for accessing the report?
Pricing options include single-user, multi-user, and enterprise licenses priced at USD 3950.00, USD 5925.00, and USD 7900.00 respectively.
10. Is the market size provided in terms of value or volume?
The market size is provided in terms of value, measured in N/A and volume, measured in K.
11. Are there any specific market keywords associated with the report?
Yes, the market keyword associated with the report is "Semiconductor Wet Process Pumps," which aids in identifying and referencing the specific market segment covered.
12. How do I determine which pricing option suits my needs best?
The pricing options vary based on user requirements and access needs. Individual users may opt for single-user licenses, while businesses requiring broader access may choose multi-user or enterprise licenses for cost-effective access to the report.
13. Are there any additional resources or data provided in the Semiconductor Wet Process Pumps report?
While the report offers comprehensive insights, it's advisable to review the specific contents or supplementary materials provided to ascertain if additional resources or data are available.
14. How can I stay updated on further developments or reports in the Semiconductor Wet Process Pumps?
To stay informed about further developments, trends, and reports in the Semiconductor Wet Process Pumps, consider subscribing to industry newsletters, following relevant companies and organizations, or regularly checking reputable industry news sources and publications.
Methodology
Step 1 - Identification of Relevant Samples Size from Population Database


Step 2 - Approaches for Defining Global Market Size (Value, Volume* & Price*)

Note*: In applicable scenarios
Step 3 - Data Sources
Primary Research
- Web Analytics
- Survey Reports
- Research Institute
- Latest Research Reports
- Opinion Leaders
Secondary Research
- Annual Reports
- White Paper
- Latest Press Release
- Industry Association
- Paid Database
- Investor Presentations

Step 4 - Data Triangulation
Involves using different sources of information in order to increase the validity of a study
These sources are likely to be stakeholders in a program - participants, other researchers, program staff, other community members, and so on.
Then we put all data in single framework & apply various statistical tools to find out the dynamic on the market.
During the analysis stage, feedback from the stakeholder groups would be compared to determine areas of agreement as well as areas of divergence