

Key Insights
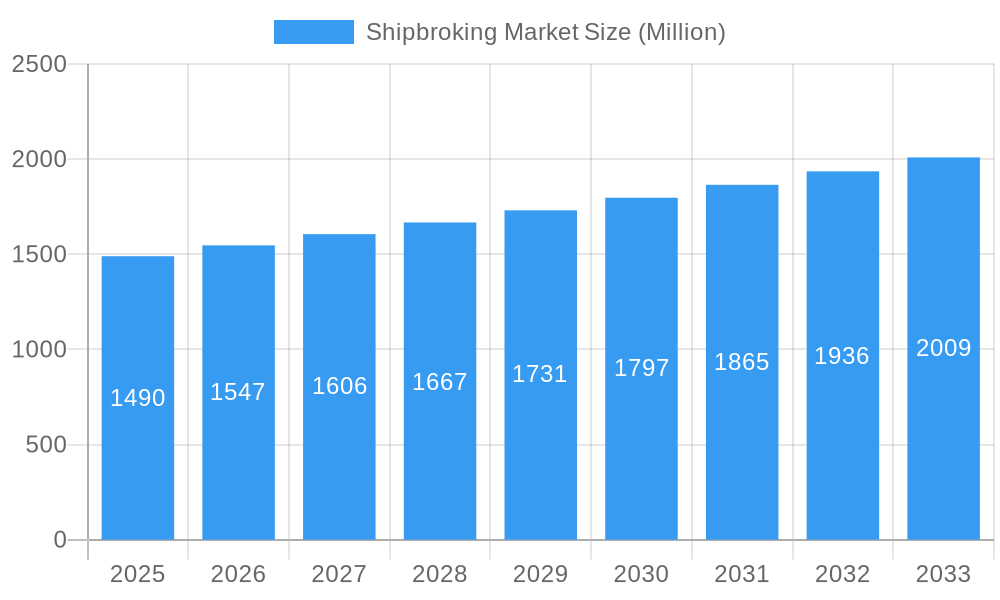
The global shipbroking market, valued at $1.49 billion in 2025, is projected to experience steady growth, driven by increasing global trade volumes and the need for efficient vessel management. A Compound Annual Growth Rate (CAGR) of 3.65% is anticipated from 2025 to 2033, indicating a consistent demand for brokerage services across various shipping segments. Key drivers include the expansion of global supply chains, the rise of e-commerce and its associated demand for maritime transportation, and the increasing complexity of shipping regulations requiring specialized brokerage expertise. Furthermore, technological advancements, such as digital platforms and data analytics, are streamlining operations and enhancing the efficiency of shipbroking services, contributing to market growth. However, market fluctuations stemming from global economic uncertainties and geopolitical events can pose challenges, requiring brokers to adopt agile strategies and diversified service offerings to maintain profitability. The competitive landscape is characterized by both large multinational firms like Clarkson PLC and Braemar Shipping Services PLC and smaller, specialized brokers, highlighting the diverse operational models present in the market.
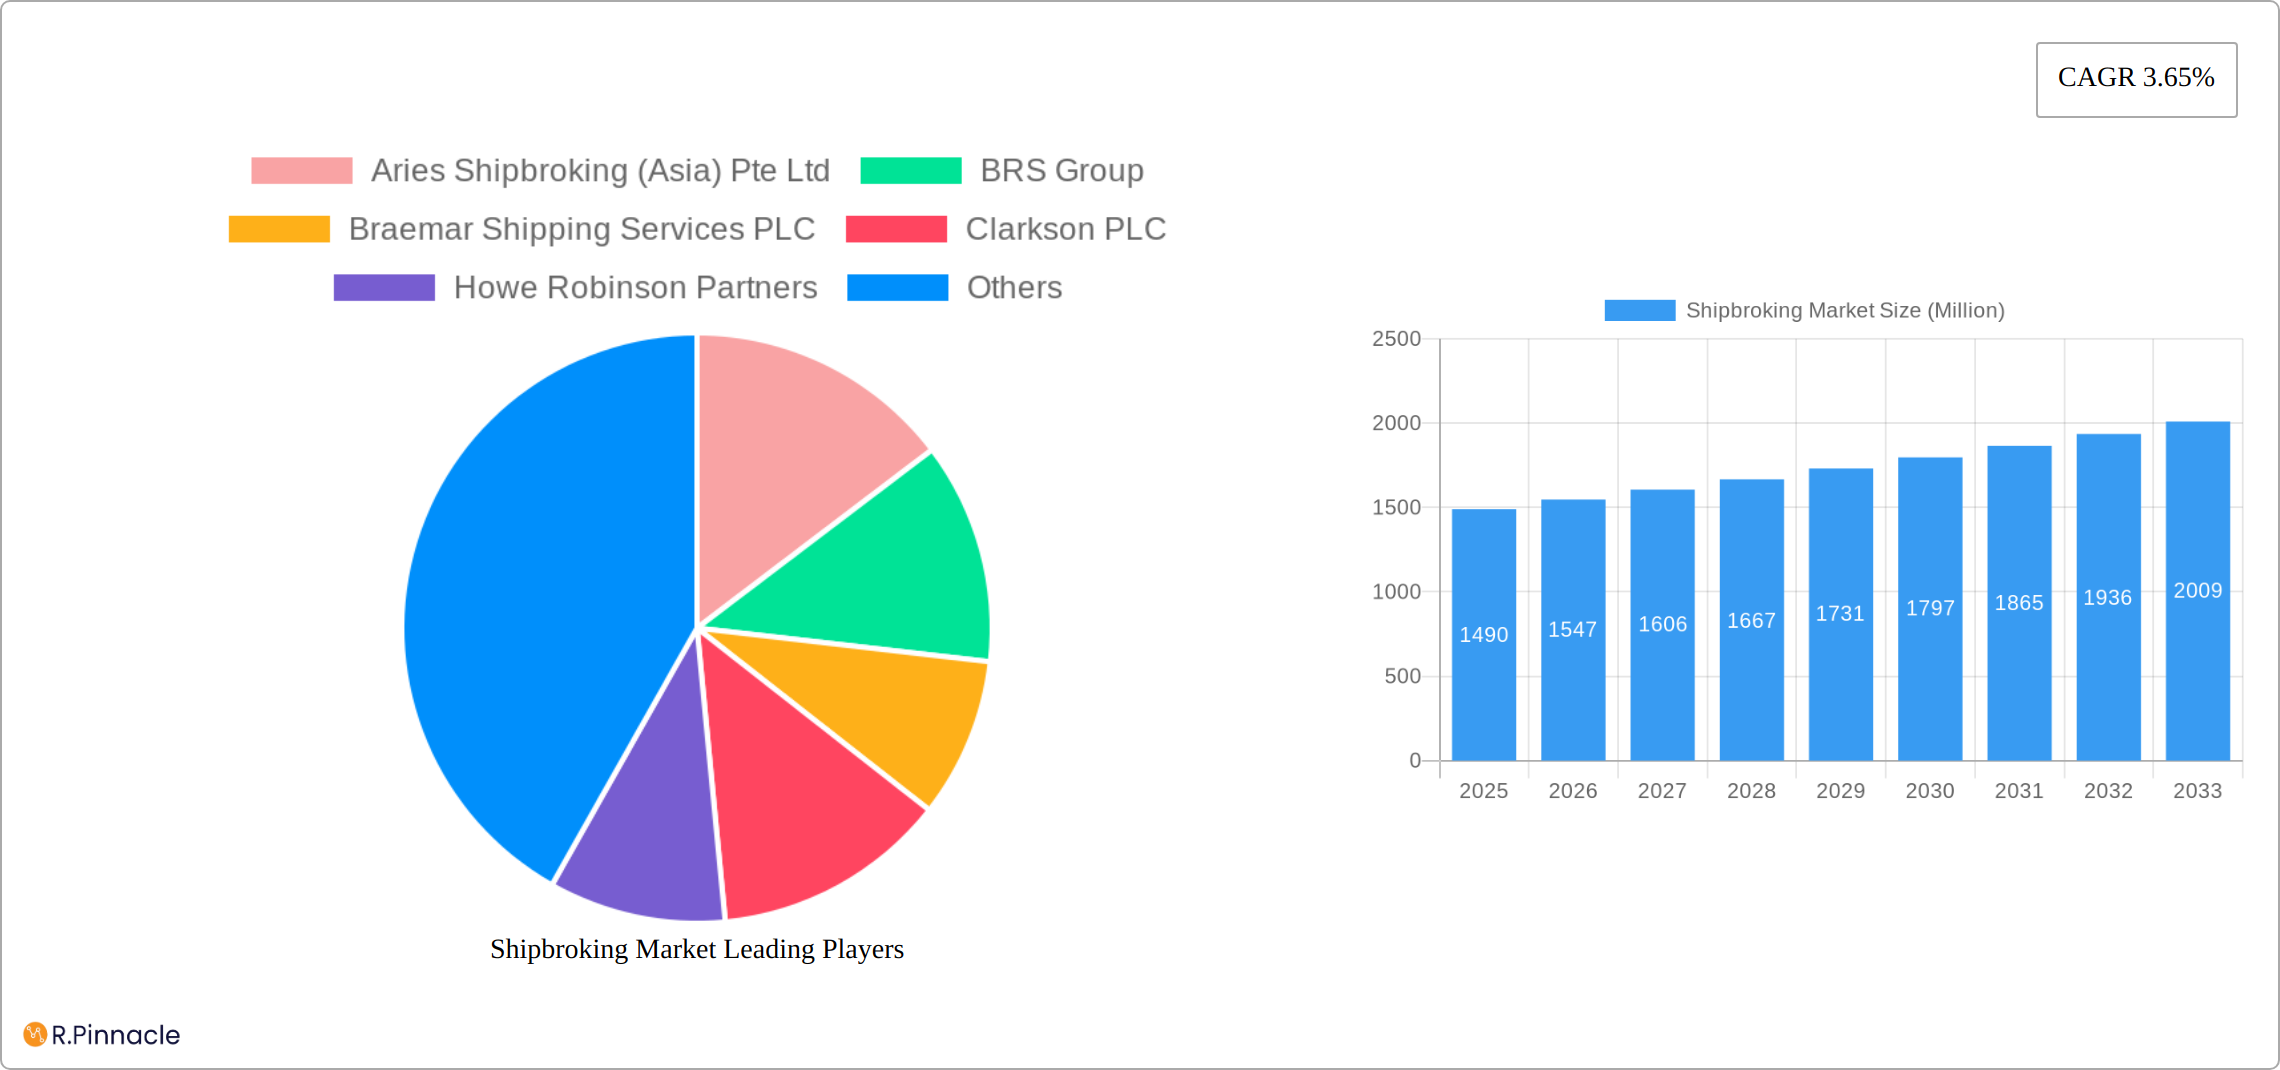
Shipbroking Market Market Size (In Billion)
The segmentation of the shipbroking market – while not explicitly detailed – likely includes categories based on vessel type (e.g., dry bulk, tankers, containerships), cargo type, and geographical region. Growth will likely be influenced by the relative performance of these segments, with sectors experiencing robust trade growth showing more dynamic expansion. The competitive landscape necessitates a focus on delivering value-added services beyond traditional brokerage, such as market intelligence, risk management consulting, and charter party negotiation expertise. Companies are actively exploring innovative approaches to enhance operational efficiencies and expand their service portfolio to meet the evolving needs of clients in a constantly changing global shipping environment. Strategic mergers and acquisitions could be anticipated as major players look to consolidate their market share and enhance their range of services and expertise.
Shipbroking Market Company Market Share
Shipbroking Market Report: 2019-2033 Forecast
This comprehensive report provides an in-depth analysis of the global Shipbroking Market, offering invaluable insights for industry professionals, investors, and strategic decision-makers. With a study period spanning 2019-2033, a base year of 2025, and a forecast period of 2025-2033, this report delivers actionable intelligence on market dynamics, competitive landscape, and future growth potential. The report covers key players such as Aries Shipbroking (Asia) Pte Ltd, BRS Group, Braemar Shipping Services PLC, Clarkson PLC, Howe Robinson Partners, Simpson Spense Young, Fearnleys A/S, ACM Shipping Group PLC, Chowgule Brothers Pvt Ltd, and Affinity (Shipping) LLP (List Not Exhaustive).
Shipbroking Market Market Structure & Innovation Trends
The global shipbroking market is characterized by a moderately concentrated structure, featuring a mix of established, large-scale brokerage firms and a considerable number of smaller, specialized players. While definitive, company-specific market share data for 2025 is not publicly available, industry estimates suggest that the leading five entities collectively command a significant portion of the market. Innovation within the shipbroking sector is rapidly evolving, largely propelled by the pervasive adoption of digital technologies. This includes the deployment of sophisticated AI-powered platforms for optimizing chartering processes, advanced data analytics for more accurate market forecasting and risk assessment, and blockchain solutions for enhanced transparency and security in transactions. The market's dynamics are also heavily influenced by evolving regulatory frameworks, particularly those pertaining to environmental compliance (e.g., IMO 2020, decarbonization initiatives) and maritime safety standards. Emerging alternative trading platforms, alongside the burgeoning growth of fintech solutions, represent key product and service substitutes that are reshaping traditional brokerage models. The primary end-user demographic comprises a broad spectrum of industry participants, including shipping companies (owners and operators), charterers (shippers of goods), and commodity traders. Mergers and acquisitions (M&A) activity has been a notable, albeit moderate, trend in recent years. During the historical period, deal values have averaged approximately [Insert Estimated Average Deal Value Here] Million annually. A more detailed examination of specific M&A transactions and their impact on market consolidation will be provided in the full report.
Shipbroking Market Market Dynamics & Trends
The shipbroking market is characterized by several key dynamics. The compound annual growth rate (CAGR) during the forecast period (2025-2033) is projected to be xx%, driven by factors such as the increasing global trade volume, expansion of the shipping fleet, and the growing need for efficient vessel chartering services. Technological disruptions, such as the adoption of blockchain technology for secure transactions and the use of big data analytics for improved market insights, are reshaping the competitive landscape. Consumer preferences increasingly favor transparency, efficiency, and digital solutions. Competitive dynamics are intensifying, with companies focusing on technology adoption, service diversification, and strategic partnerships to gain a market edge. Market penetration of digital platforms is rapidly increasing with an estimated xx% penetration by 2033.
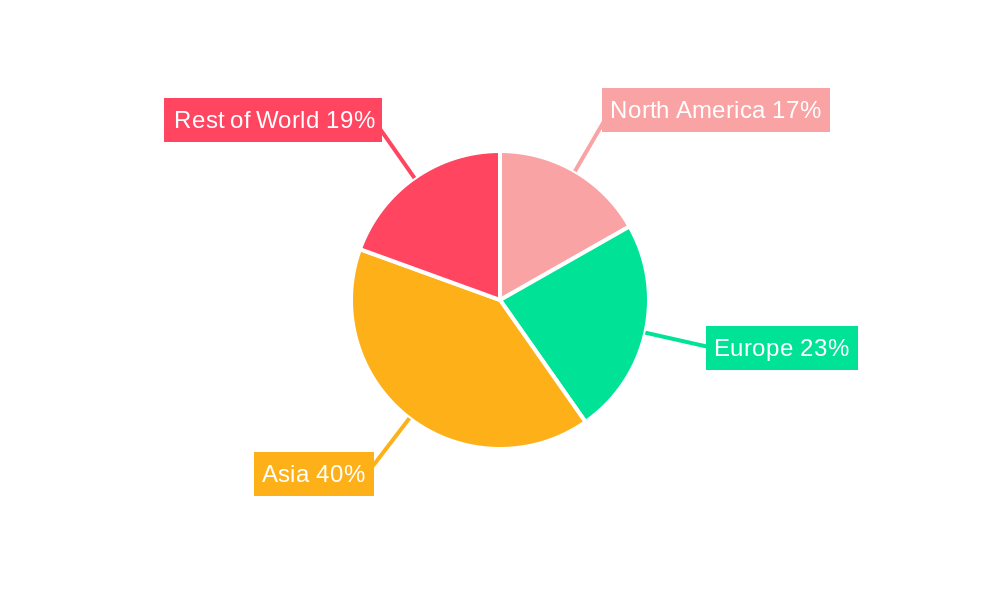
Dominant Regions & Segments in Shipbroking Market
The Asia-Pacific region is projected to assert its dominance in the global shipbroking market throughout the forecast period. This leadership position is underpinned by a confluence of robust economic and logistical factors:
- Accelerated Economic Growth: The region's sustained and often rapid economic expansion directly translates into amplified demand for shipping services, as it underpins increased manufacturing, consumption, and trade activities.
- Extensive Infrastructure Development: Significant and ongoing investments in port modernization, expansion of logistics networks, and the development of intermodal transportation systems are creating a highly efficient ecosystem that favors increased maritime trade.
- Escalating Trade Volumes: The surge in both intra-regional and international trade flows within and emanating from Asia-Pacific is a direct driver for higher demand for shipbroking expertise to facilitate these movements.
A comprehensive dominance analysis, detailed within the full report, will provide a comparative perspective of the Asia-Pacific region against other significant global markets, including Europe and North America. This will involve in-depth regional insights and an examination of their respective growth drivers. Furthermore, the report will offer a granular segmentation of the market based on critical parameters such as vessel type (e.g., dry bulk carriers, tankers, container ships), cargo type (e.g., crude oil, refined products, grains, ores), and the diverse range of service offerings provided by shipbrokers. A thorough analysis of the specific growth drivers influencing each of these segments will be presented.
Shipbroking Market Product Innovations
Recent product innovations in the shipbroking market focus on enhancing efficiency, transparency, and security through technology integration. This includes the development of advanced data analytics platforms that provide real-time market insights, facilitating more informed decision-making. Blockchain technology is gaining traction for secure and transparent transaction processing. The market fit of these innovations is high, addressing the industry's increasing demand for streamlined operations and risk mitigation.
Report Scope & Segmentation Analysis
This report provides a comprehensive analysis of the shipbroking market, meticulously segmenting it by key parameters to offer deep insights into each sub-sector. The segmentation includes:
- Vessel Type: Dry Bulk Carriers, Tankers (Crude, Product, Chemical), Container Ships, Gas Carriers, and Others.
- Cargo Type: Crude Oil and Petroleum Products, Dry Bulk Commodities (Iron Ore, Coal, Grains), Manufactured Goods, Chemicals, and Liquefied Natural Gas (LNG)/Liquefied Petroleum Gas (LPG).
- Service Offering: Chartering (Dry Cargo, Tanker, Offshore), Sale and Purchase (S&P) of Vessels, Newbuilding Broking, and Specialized Services (e.g., Demolition, Consultancy).
For each of these segments, the full report will present detailed growth projections, current and projected market sizes (valued in Millions of USD), and a thorough examination of the competitive dynamics at play. This granular approach ensures a holistic understanding of the market landscape and its future trajectory.
Key Drivers of Shipbroking Market Growth
Several key factors are propelling the growth of the shipbroking market. These include the increasing global trade volume, driven by globalization and economic growth; technological advancements, such as AI and blockchain, improving efficiency and transparency; and favorable regulatory frameworks supporting maritime trade and investment. Furthermore, the rising demand for efficient and cost-effective shipping solutions is significantly contributing to market expansion.
Challenges in the Shipbroking Market Sector
The shipbroking market faces several challenges, including intense competition, requiring companies to constantly adapt and innovate to maintain their market share. Fluctuations in freight rates and fuel prices also create significant market uncertainty, impacting profitability. Regulatory compliance adds another layer of complexity, and supply chain disruptions cause intermittent operational issues. The quantifiable impact of these challenges on market growth is estimated at xx% during the forecast period.
Emerging Opportunities in Shipbroking Market
Emerging opportunities in the shipbroking market include the growth of e-commerce and its impact on container shipping, leading to an increase in demand for efficient logistics solutions and, consequently, for shipbroking services. The adoption of digital technologies and expansion into new markets, particularly in developing economies with rapidly growing trade volumes, offer significant potential for growth.
Leading Players in the Shipbroking Market Market
- Aries Shipbroking (Asia) Pte Ltd
- BRS Group
- Braemar Shipping Services PLC
- Clarkson PLC
- Howe Robinson Partners
- Simpson Spense Young
- Fearnleys A/S
- ACM Shipping Group PLC
- Chowgule Brothers Pvt Ltd
- Affinity (Shipping) LLP
Key Developments in Shipbroking Market Industry
- September 2023: ZIM Integrated Shipping Services Ltd. and MSC, two major players in the container shipping industry, formalized a new operational collaboration agreement. This strategic alliance is designed to enhance service standards, optimize operational efficiencies, and improve overall customer experience. The impact of this partnership is significant, as it contributes to greater service offerings and intensifies the competitive landscape within the liner segment.
- January 2024: Maersk and Hapag-Lloyd, global leaders in container shipping, announced a long-term collaboration initiative, which involves the consolidation of hundreds of vessels across their fleets. This landmark partnership is poised to fundamentally reshape the competitive dynamics of the container shipping market, potentially influencing market share distribution, freight rate strategies, and the overall supply-demand balance across key trade lanes.
Future Outlook for Shipbroking Market Market
The future outlook for the shipbroking market remains decidedly positive, driven by the sustained and projected growth of global trade, the continuous advancement of technological solutions that enhance operational efficiency, and the increasing complexity inherent in modern shipping logistics. Key catalysts for growth during the forecast period will include the strategic formation of partnerships, significant investments in cutting-edge digital solutions, and proactive expansion into emerging markets. The shipbroking market is anticipated to reach a substantial market value of [Insert Projected Market Value by 2033 Here] Million by 2033, reflecting the sector's resilience and its integral role in the global economy.
Shipbroking Market Segmentation
-
1. Type
- 1.1. Dry Cargo Broking
- 1.2. Tanker Broking
- 1.3. Container Vessel Broking
- 1.4. Other Types
-
2. Service
- 2.1. Charting
- 2.2. Sales and Purchases
- 2.3. Offshore Services
- 2.4. Newbuilding Services
- 2.5. Salvage &Towage Services
-
3. Industry
- 3.1. Oil and Gas
- 3.2. Manufacturing
- 3.3. Aerospace and Defense
- 3.4. Government
- 3.5. Other Industries
Shipbroking Market Segmentation By Geography
-
1. North America
- 1.1. United States
- 1.2. Canada
- 1.3. Rest of North America
-
2. Europe
- 2.1. Germany
- 2.2. United Kingdom
- 2.3. France
- 2.4. Russia
- 2.5. Spain
- 2.6. Rest of Europe
-
3. Asia Pacific
- 3.1. India
- 3.2. China
- 3.3. Japan
- 3.4. Rest of Asia Pacific
-
4. South America
- 4.1. Brazil
- 4.2. Argentina
- 4.3. Rest of South America
-
5. Middle East and Africa
- 5.1. United Arab Emirates
- 5.2. Saudi Arabia
- 5.3. Rest of Middle East and Africa
Shipbroking Market Regional Market Share
Geographic Coverage of Shipbroking Market
Shipbroking Market REPORT HIGHLIGHTS
| Aspects | Details |
|---|---|
| Study Period | 2020-2034 |
| Base Year | 2025 |
| Estimated Year | 2026 |
| Forecast Period | 2026-2034 |
| Historical Period | 2020-2025 |
| Growth Rate | CAGR of 3.65% from 2020-2034 |
| Segmentation |
|
Table of Contents
- 1. Introduction
- 1.1. Research Scope
- 1.2. Market Segmentation
- 1.3. Research Objective
- 1.4. Definitions and Assumptions
- 2. Executive Summary
- 2.1. Market Snapshot
- 3. Market Dynamics
- 3.1. Market Drivers
- 3.2. Market Restrains
- 3.3. Market Trends
- 3.4. Market Opportunities
- 4. Market Factor Analysis
- 4.1. Porters Five Forces
- 4.1.1. Bargaining Power of Suppliers
- 4.1.2. Bargaining Power of Buyers
- 4.1.3. Threat of New Entrants
- 4.1.4. Threat of Substitutes
- 4.1.5. Competitive Rivalry
- 4.2. PESTEL analysis
- 4.3. BCG Analysis
- 4.3.1. Stars (High Growth, High Market Share)
- 4.3.2. Cash Cows (Low Growth, High Market Share)
- 4.3.3. Question Mark (High Growth, Low Market Share)
- 4.3.4. Dogs (Low Growth, Low Market Share)
- 4.4. Ansoff Matrix Analysis
- 4.5. Supply Chain Analysis
- 4.6. Regulatory Landscape
- 4.7. Current Market Potential and Opportunity Assessment (TAM–SAM–SOM Framework)
- 4.8. PRI Analyst Note
- 4.1. Porters Five Forces
- 5. Market Analysis, Insights and Forecast 2021-2033
- 5.1. Market Analysis, Insights and Forecast - by Type
- 5.1.1. Dry Cargo Broking
- 5.1.2. Tanker Broking
- 5.1.3. Container Vessel Broking
- 5.1.4. Other Types
- 5.2. Market Analysis, Insights and Forecast - by Service
- 5.2.1. Charting
- 5.2.2. Sales and Purchases
- 5.2.3. Offshore Services
- 5.2.4. Newbuilding Services
- 5.2.5. Salvage &Towage Services
- 5.3. Market Analysis, Insights and Forecast - by Industry
- 5.3.1. Oil and Gas
- 5.3.2. Manufacturing
- 5.3.3. Aerospace and Defense
- 5.3.4. Government
- 5.3.5. Other Industries
- 5.4. Market Analysis, Insights and Forecast - by Region
- 5.4.1. North America
- 5.4.2. Europe
- 5.4.3. Asia Pacific
- 5.4.4. South America
- 5.4.5. Middle East and Africa
- 5.1. Market Analysis, Insights and Forecast - by Type
- 6. Global Shipbroking Market Analysis, Insights and Forecast, 2021-2033
- 6.1. Market Analysis, Insights and Forecast - by Type
- 6.1.1. Dry Cargo Broking
- 6.1.2. Tanker Broking
- 6.1.3. Container Vessel Broking
- 6.1.4. Other Types
- 6.2. Market Analysis, Insights and Forecast - by Service
- 6.2.1. Charting
- 6.2.2. Sales and Purchases
- 6.2.3. Offshore Services
- 6.2.4. Newbuilding Services
- 6.2.5. Salvage &Towage Services
- 6.3. Market Analysis, Insights and Forecast - by Industry
- 6.3.1. Oil and Gas
- 6.3.2. Manufacturing
- 6.3.3. Aerospace and Defense
- 6.3.4. Government
- 6.3.5. Other Industries
- 6.1. Market Analysis, Insights and Forecast - by Type
- 7. North America Shipbroking Market Analysis, Insights and Forecast, 2020-2032
- 7.1. Market Analysis, Insights and Forecast - by Type
- 7.1.1. Dry Cargo Broking
- 7.1.2. Tanker Broking
- 7.1.3. Container Vessel Broking
- 7.1.4. Other Types
- 7.2. Market Analysis, Insights and Forecast - by Service
- 7.2.1. Charting
- 7.2.2. Sales and Purchases
- 7.2.3. Offshore Services
- 7.2.4. Newbuilding Services
- 7.2.5. Salvage &Towage Services
- 7.3. Market Analysis, Insights and Forecast - by Industry
- 7.3.1. Oil and Gas
- 7.3.2. Manufacturing
- 7.3.3. Aerospace and Defense
- 7.3.4. Government
- 7.3.5. Other Industries
- 7.1. Market Analysis, Insights and Forecast - by Type
- 8. Europe Shipbroking Market Analysis, Insights and Forecast, 2020-2032
- 8.1. Market Analysis, Insights and Forecast - by Type
- 8.1.1. Dry Cargo Broking
- 8.1.2. Tanker Broking
- 8.1.3. Container Vessel Broking
- 8.1.4. Other Types
- 8.2. Market Analysis, Insights and Forecast - by Service
- 8.2.1. Charting
- 8.2.2. Sales and Purchases
- 8.2.3. Offshore Services
- 8.2.4. Newbuilding Services
- 8.2.5. Salvage &Towage Services
- 8.3. Market Analysis, Insights and Forecast - by Industry
- 8.3.1. Oil and Gas
- 8.3.2. Manufacturing
- 8.3.3. Aerospace and Defense
- 8.3.4. Government
- 8.3.5. Other Industries
- 8.1. Market Analysis, Insights and Forecast - by Type
- 9. Asia Pacific Shipbroking Market Analysis, Insights and Forecast, 2020-2032
- 9.1. Market Analysis, Insights and Forecast - by Type
- 9.1.1. Dry Cargo Broking
- 9.1.2. Tanker Broking
- 9.1.3. Container Vessel Broking
- 9.1.4. Other Types
- 9.2. Market Analysis, Insights and Forecast - by Service
- 9.2.1. Charting
- 9.2.2. Sales and Purchases
- 9.2.3. Offshore Services
- 9.2.4. Newbuilding Services
- 9.2.5. Salvage &Towage Services
- 9.3. Market Analysis, Insights and Forecast - by Industry
- 9.3.1. Oil and Gas
- 9.3.2. Manufacturing
- 9.3.3. Aerospace and Defense
- 9.3.4. Government
- 9.3.5. Other Industries
- 9.1. Market Analysis, Insights and Forecast - by Type
- 10. South America Shipbroking Market Analysis, Insights and Forecast, 2020-2032
- 10.1. Market Analysis, Insights and Forecast - by Type
- 10.1.1. Dry Cargo Broking
- 10.1.2. Tanker Broking
- 10.1.3. Container Vessel Broking
- 10.1.4. Other Types
- 10.2. Market Analysis, Insights and Forecast - by Service
- 10.2.1. Charting
- 10.2.2. Sales and Purchases
- 10.2.3. Offshore Services
- 10.2.4. Newbuilding Services
- 10.2.5. Salvage &Towage Services
- 10.3. Market Analysis, Insights and Forecast - by Industry
- 10.3.1. Oil and Gas
- 10.3.2. Manufacturing
- 10.3.3. Aerospace and Defense
- 10.3.4. Government
- 10.3.5. Other Industries
- 10.1. Market Analysis, Insights and Forecast - by Type
- 11. Middle East and Africa Shipbroking Market Analysis, Insights and Forecast, 2020-2032
- 11.1. Market Analysis, Insights and Forecast - by Type
- 11.1.1. Dry Cargo Broking
- 11.1.2. Tanker Broking
- 11.1.3. Container Vessel Broking
- 11.1.4. Other Types
- 11.2. Market Analysis, Insights and Forecast - by Service
- 11.2.1. Charting
- 11.2.2. Sales and Purchases
- 11.2.3. Offshore Services
- 11.2.4. Newbuilding Services
- 11.2.5. Salvage &Towage Services
- 11.3. Market Analysis, Insights and Forecast - by Industry
- 11.3.1. Oil and Gas
- 11.3.2. Manufacturing
- 11.3.3. Aerospace and Defense
- 11.3.4. Government
- 11.3.5. Other Industries
- 11.1. Market Analysis, Insights and Forecast - by Type
- 12. Competitive Analysis
- 12.1. Company Profiles
- 12.1.1 Aries Shipbroking (Asia) Pte Ltd
- 12.1.1.1. Company Overview
- 12.1.1.2. Products
- 12.1.1.3. Company Financials
- 12.1.1.4. SWOT Analysis
- 12.1.2 BRS Group
- 12.1.2.1. Company Overview
- 12.1.2.2. Products
- 12.1.2.3. Company Financials
- 12.1.2.4. SWOT Analysis
- 12.1.3 Braemar Shipping Services PLC
- 12.1.3.1. Company Overview
- 12.1.3.2. Products
- 12.1.3.3. Company Financials
- 12.1.3.4. SWOT Analysis
- 12.1.4 Clarkson PLC
- 12.1.4.1. Company Overview
- 12.1.4.2. Products
- 12.1.4.3. Company Financials
- 12.1.4.4. SWOT Analysis
- 12.1.5 Howe Robinson Partners
- 12.1.5.1. Company Overview
- 12.1.5.2. Products
- 12.1.5.3. Company Financials
- 12.1.5.4. SWOT Analysis
- 12.1.6 Simpson Spense Young
- 12.1.6.1. Company Overview
- 12.1.6.2. Products
- 12.1.6.3. Company Financials
- 12.1.6.4. SWOT Analysis
- 12.1.7 Fearnleys A/S
- 12.1.7.1. Company Overview
- 12.1.7.2. Products
- 12.1.7.3. Company Financials
- 12.1.7.4. SWOT Analysis
- 12.1.8 ACM Shipping Group PLC
- 12.1.8.1. Company Overview
- 12.1.8.2. Products
- 12.1.8.3. Company Financials
- 12.1.8.4. SWOT Analysis
- 12.1.9 Chowgule Brothers Pvt Ltd
- 12.1.9.1. Company Overview
- 12.1.9.2. Products
- 12.1.9.3. Company Financials
- 12.1.9.4. SWOT Analysis
- 12.1.10 Affinity (Shipping) LLP**List Not Exhaustive
- 12.1.10.1. Company Overview
- 12.1.10.2. Products
- 12.1.10.3. Company Financials
- 12.1.10.4. SWOT Analysis
- 12.1.1 Aries Shipbroking (Asia) Pte Ltd
- 12.2. Market Entropy
- 12.2.1 Company's Key Areas Served
- 12.2.2 Recent Developments
- 12.3. Company Market Share Analysis 2025
- 12.3.1 Top 5 Companies Market Share Analysis
- 12.3.2 Top 3 Companies Market Share Analysis
- 12.4. List of Potential Customers
- 13. Research Methodology
List of Figures
- Figure 1: Global Shipbroking Market Revenue Breakdown (Million, %) by Region 2025 & 2033
- Figure 2: Global Shipbroking Market Volume Breakdown (Billion, %) by Region 2025 & 2033
- Figure 3: North America Shipbroking Market Revenue (Million), by Type 2025 & 2033
- Figure 4: North America Shipbroking Market Volume (Billion), by Type 2025 & 2033
- Figure 5: North America Shipbroking Market Revenue Share (%), by Type 2025 & 2033
- Figure 6: North America Shipbroking Market Volume Share (%), by Type 2025 & 2033
- Figure 7: North America Shipbroking Market Revenue (Million), by Service 2025 & 2033
- Figure 8: North America Shipbroking Market Volume (Billion), by Service 2025 & 2033
- Figure 9: North America Shipbroking Market Revenue Share (%), by Service 2025 & 2033
- Figure 10: North America Shipbroking Market Volume Share (%), by Service 2025 & 2033
- Figure 11: North America Shipbroking Market Revenue (Million), by Industry 2025 & 2033
- Figure 12: North America Shipbroking Market Volume (Billion), by Industry 2025 & 2033
- Figure 13: North America Shipbroking Market Revenue Share (%), by Industry 2025 & 2033
- Figure 14: North America Shipbroking Market Volume Share (%), by Industry 2025 & 2033
- Figure 15: North America Shipbroking Market Revenue (Million), by Country 2025 & 2033
- Figure 16: North America Shipbroking Market Volume (Billion), by Country 2025 & 2033
- Figure 17: North America Shipbroking Market Revenue Share (%), by Country 2025 & 2033
- Figure 18: North America Shipbroking Market Volume Share (%), by Country 2025 & 2033
- Figure 19: Europe Shipbroking Market Revenue (Million), by Type 2025 & 2033
- Figure 20: Europe Shipbroking Market Volume (Billion), by Type 2025 & 2033
- Figure 21: Europe Shipbroking Market Revenue Share (%), by Type 2025 & 2033
- Figure 22: Europe Shipbroking Market Volume Share (%), by Type 2025 & 2033
- Figure 23: Europe Shipbroking Market Revenue (Million), by Service 2025 & 2033
- Figure 24: Europe Shipbroking Market Volume (Billion), by Service 2025 & 2033
- Figure 25: Europe Shipbroking Market Revenue Share (%), by Service 2025 & 2033
- Figure 26: Europe Shipbroking Market Volume Share (%), by Service 2025 & 2033
- Figure 27: Europe Shipbroking Market Revenue (Million), by Industry 2025 & 2033
- Figure 28: Europe Shipbroking Market Volume (Billion), by Industry 2025 & 2033
- Figure 29: Europe Shipbroking Market Revenue Share (%), by Industry 2025 & 2033
- Figure 30: Europe Shipbroking Market Volume Share (%), by Industry 2025 & 2033
- Figure 31: Europe Shipbroking Market Revenue (Million), by Country 2025 & 2033
- Figure 32: Europe Shipbroking Market Volume (Billion), by Country 2025 & 2033
- Figure 33: Europe Shipbroking Market Revenue Share (%), by Country 2025 & 2033
- Figure 34: Europe Shipbroking Market Volume Share (%), by Country 2025 & 2033
- Figure 35: Asia Pacific Shipbroking Market Revenue (Million), by Type 2025 & 2033
- Figure 36: Asia Pacific Shipbroking Market Volume (Billion), by Type 2025 & 2033
- Figure 37: Asia Pacific Shipbroking Market Revenue Share (%), by Type 2025 & 2033
- Figure 38: Asia Pacific Shipbroking Market Volume Share (%), by Type 2025 & 2033
- Figure 39: Asia Pacific Shipbroking Market Revenue (Million), by Service 2025 & 2033
- Figure 40: Asia Pacific Shipbroking Market Volume (Billion), by Service 2025 & 2033
- Figure 41: Asia Pacific Shipbroking Market Revenue Share (%), by Service 2025 & 2033
- Figure 42: Asia Pacific Shipbroking Market Volume Share (%), by Service 2025 & 2033
- Figure 43: Asia Pacific Shipbroking Market Revenue (Million), by Industry 2025 & 2033
- Figure 44: Asia Pacific Shipbroking Market Volume (Billion), by Industry 2025 & 2033
- Figure 45: Asia Pacific Shipbroking Market Revenue Share (%), by Industry 2025 & 2033
- Figure 46: Asia Pacific Shipbroking Market Volume Share (%), by Industry 2025 & 2033
- Figure 47: Asia Pacific Shipbroking Market Revenue (Million), by Country 2025 & 2033
- Figure 48: Asia Pacific Shipbroking Market Volume (Billion), by Country 2025 & 2033
- Figure 49: Asia Pacific Shipbroking Market Revenue Share (%), by Country 2025 & 2033
- Figure 50: Asia Pacific Shipbroking Market Volume Share (%), by Country 2025 & 2033
- Figure 51: South America Shipbroking Market Revenue (Million), by Type 2025 & 2033
- Figure 52: South America Shipbroking Market Volume (Billion), by Type 2025 & 2033
- Figure 53: South America Shipbroking Market Revenue Share (%), by Type 2025 & 2033
- Figure 54: South America Shipbroking Market Volume Share (%), by Type 2025 & 2033
- Figure 55: South America Shipbroking Market Revenue (Million), by Service 2025 & 2033
- Figure 56: South America Shipbroking Market Volume (Billion), by Service 2025 & 2033
- Figure 57: South America Shipbroking Market Revenue Share (%), by Service 2025 & 2033
- Figure 58: South America Shipbroking Market Volume Share (%), by Service 2025 & 2033
- Figure 59: South America Shipbroking Market Revenue (Million), by Industry 2025 & 2033
- Figure 60: South America Shipbroking Market Volume (Billion), by Industry 2025 & 2033
- Figure 61: South America Shipbroking Market Revenue Share (%), by Industry 2025 & 2033
- Figure 62: South America Shipbroking Market Volume Share (%), by Industry 2025 & 2033
- Figure 63: South America Shipbroking Market Revenue (Million), by Country 2025 & 2033
- Figure 64: South America Shipbroking Market Volume (Billion), by Country 2025 & 2033
- Figure 65: South America Shipbroking Market Revenue Share (%), by Country 2025 & 2033
- Figure 66: South America Shipbroking Market Volume Share (%), by Country 2025 & 2033
- Figure 67: Middle East and Africa Shipbroking Market Revenue (Million), by Type 2025 & 2033
- Figure 68: Middle East and Africa Shipbroking Market Volume (Billion), by Type 2025 & 2033
- Figure 69: Middle East and Africa Shipbroking Market Revenue Share (%), by Type 2025 & 2033
- Figure 70: Middle East and Africa Shipbroking Market Volume Share (%), by Type 2025 & 2033
- Figure 71: Middle East and Africa Shipbroking Market Revenue (Million), by Service 2025 & 2033
- Figure 72: Middle East and Africa Shipbroking Market Volume (Billion), by Service 2025 & 2033
- Figure 73: Middle East and Africa Shipbroking Market Revenue Share (%), by Service 2025 & 2033
- Figure 74: Middle East and Africa Shipbroking Market Volume Share (%), by Service 2025 & 2033
- Figure 75: Middle East and Africa Shipbroking Market Revenue (Million), by Industry 2025 & 2033
- Figure 76: Middle East and Africa Shipbroking Market Volume (Billion), by Industry 2025 & 2033
- Figure 77: Middle East and Africa Shipbroking Market Revenue Share (%), by Industry 2025 & 2033
- Figure 78: Middle East and Africa Shipbroking Market Volume Share (%), by Industry 2025 & 2033
- Figure 79: Middle East and Africa Shipbroking Market Revenue (Million), by Country 2025 & 2033
- Figure 80: Middle East and Africa Shipbroking Market Volume (Billion), by Country 2025 & 2033
- Figure 81: Middle East and Africa Shipbroking Market Revenue Share (%), by Country 2025 & 2033
- Figure 82: Middle East and Africa Shipbroking Market Volume Share (%), by Country 2025 & 2033
List of Tables
- Table 1: Global Shipbroking Market Revenue Million Forecast, by Type 2020 & 2033
- Table 2: Global Shipbroking Market Volume Billion Forecast, by Type 2020 & 2033
- Table 3: Global Shipbroking Market Revenue Million Forecast, by Service 2020 & 2033
- Table 4: Global Shipbroking Market Volume Billion Forecast, by Service 2020 & 2033
- Table 5: Global Shipbroking Market Revenue Million Forecast, by Industry 2020 & 2033
- Table 6: Global Shipbroking Market Volume Billion Forecast, by Industry 2020 & 2033
- Table 7: Global Shipbroking Market Revenue Million Forecast, by Region 2020 & 2033
- Table 8: Global Shipbroking Market Volume Billion Forecast, by Region 2020 & 2033
- Table 9: Global Shipbroking Market Revenue Million Forecast, by Type 2020 & 2033
- Table 10: Global Shipbroking Market Volume Billion Forecast, by Type 2020 & 2033
- Table 11: Global Shipbroking Market Revenue Million Forecast, by Service 2020 & 2033
- Table 12: Global Shipbroking Market Volume Billion Forecast, by Service 2020 & 2033
- Table 13: Global Shipbroking Market Revenue Million Forecast, by Industry 2020 & 2033
- Table 14: Global Shipbroking Market Volume Billion Forecast, by Industry 2020 & 2033
- Table 15: Global Shipbroking Market Revenue Million Forecast, by Country 2020 & 2033
- Table 16: Global Shipbroking Market Volume Billion Forecast, by Country 2020 & 2033
- Table 17: United States Shipbroking Market Revenue (Million) Forecast, by Application 2020 & 2033
- Table 18: United States Shipbroking Market Volume (Billion) Forecast, by Application 2020 & 2033
- Table 19: Canada Shipbroking Market Revenue (Million) Forecast, by Application 2020 & 2033
- Table 20: Canada Shipbroking Market Volume (Billion) Forecast, by Application 2020 & 2033
- Table 21: Rest of North America Shipbroking Market Revenue (Million) Forecast, by Application 2020 & 2033
- Table 22: Rest of North America Shipbroking Market Volume (Billion) Forecast, by Application 2020 & 2033
- Table 23: Global Shipbroking Market Revenue Million Forecast, by Type 2020 & 2033
- Table 24: Global Shipbroking Market Volume Billion Forecast, by Type 2020 & 2033
- Table 25: Global Shipbroking Market Revenue Million Forecast, by Service 2020 & 2033
- Table 26: Global Shipbroking Market Volume Billion Forecast, by Service 2020 & 2033
- Table 27: Global Shipbroking Market Revenue Million Forecast, by Industry 2020 & 2033
- Table 28: Global Shipbroking Market Volume Billion Forecast, by Industry 2020 & 2033
- Table 29: Global Shipbroking Market Revenue Million Forecast, by Country 2020 & 2033
- Table 30: Global Shipbroking Market Volume Billion Forecast, by Country 2020 & 2033
- Table 31: Germany Shipbroking Market Revenue (Million) Forecast, by Application 2020 & 2033
- Table 32: Germany Shipbroking Market Volume (Billion) Forecast, by Application 2020 & 2033
- Table 33: United Kingdom Shipbroking Market Revenue (Million) Forecast, by Application 2020 & 2033
- Table 34: United Kingdom Shipbroking Market Volume (Billion) Forecast, by Application 2020 & 2033
- Table 35: France Shipbroking Market Revenue (Million) Forecast, by Application 2020 & 2033
- Table 36: France Shipbroking Market Volume (Billion) Forecast, by Application 2020 & 2033
- Table 37: Russia Shipbroking Market Revenue (Million) Forecast, by Application 2020 & 2033
- Table 38: Russia Shipbroking Market Volume (Billion) Forecast, by Application 2020 & 2033
- Table 39: Spain Shipbroking Market Revenue (Million) Forecast, by Application 2020 & 2033
- Table 40: Spain Shipbroking Market Volume (Billion) Forecast, by Application 2020 & 2033
- Table 41: Rest of Europe Shipbroking Market Revenue (Million) Forecast, by Application 2020 & 2033
- Table 42: Rest of Europe Shipbroking Market Volume (Billion) Forecast, by Application 2020 & 2033
- Table 43: Global Shipbroking Market Revenue Million Forecast, by Type 2020 & 2033
- Table 44: Global Shipbroking Market Volume Billion Forecast, by Type 2020 & 2033
- Table 45: Global Shipbroking Market Revenue Million Forecast, by Service 2020 & 2033
- Table 46: Global Shipbroking Market Volume Billion Forecast, by Service 2020 & 2033
- Table 47: Global Shipbroking Market Revenue Million Forecast, by Industry 2020 & 2033
- Table 48: Global Shipbroking Market Volume Billion Forecast, by Industry 2020 & 2033
- Table 49: Global Shipbroking Market Revenue Million Forecast, by Country 2020 & 2033
- Table 50: Global Shipbroking Market Volume Billion Forecast, by Country 2020 & 2033
- Table 51: India Shipbroking Market Revenue (Million) Forecast, by Application 2020 & 2033
- Table 52: India Shipbroking Market Volume (Billion) Forecast, by Application 2020 & 2033
- Table 53: China Shipbroking Market Revenue (Million) Forecast, by Application 2020 & 2033
- Table 54: China Shipbroking Market Volume (Billion) Forecast, by Application 2020 & 2033
- Table 55: Japan Shipbroking Market Revenue (Million) Forecast, by Application 2020 & 2033
- Table 56: Japan Shipbroking Market Volume (Billion) Forecast, by Application 2020 & 2033
- Table 57: Rest of Asia Pacific Shipbroking Market Revenue (Million) Forecast, by Application 2020 & 2033
- Table 58: Rest of Asia Pacific Shipbroking Market Volume (Billion) Forecast, by Application 2020 & 2033
- Table 59: Global Shipbroking Market Revenue Million Forecast, by Type 2020 & 2033
- Table 60: Global Shipbroking Market Volume Billion Forecast, by Type 2020 & 2033
- Table 61: Global Shipbroking Market Revenue Million Forecast, by Service 2020 & 2033
- Table 62: Global Shipbroking Market Volume Billion Forecast, by Service 2020 & 2033
- Table 63: Global Shipbroking Market Revenue Million Forecast, by Industry 2020 & 2033
- Table 64: Global Shipbroking Market Volume Billion Forecast, by Industry 2020 & 2033
- Table 65: Global Shipbroking Market Revenue Million Forecast, by Country 2020 & 2033
- Table 66: Global Shipbroking Market Volume Billion Forecast, by Country 2020 & 2033
- Table 67: Brazil Shipbroking Market Revenue (Million) Forecast, by Application 2020 & 2033
- Table 68: Brazil Shipbroking Market Volume (Billion) Forecast, by Application 2020 & 2033
- Table 69: Argentina Shipbroking Market Revenue (Million) Forecast, by Application 2020 & 2033
- Table 70: Argentina Shipbroking Market Volume (Billion) Forecast, by Application 2020 & 2033
- Table 71: Rest of South America Shipbroking Market Revenue (Million) Forecast, by Application 2020 & 2033
- Table 72: Rest of South America Shipbroking Market Volume (Billion) Forecast, by Application 2020 & 2033
- Table 73: Global Shipbroking Market Revenue Million Forecast, by Type 2020 & 2033
- Table 74: Global Shipbroking Market Volume Billion Forecast, by Type 2020 & 2033
- Table 75: Global Shipbroking Market Revenue Million Forecast, by Service 2020 & 2033
- Table 76: Global Shipbroking Market Volume Billion Forecast, by Service 2020 & 2033
- Table 77: Global Shipbroking Market Revenue Million Forecast, by Industry 2020 & 2033
- Table 78: Global Shipbroking Market Volume Billion Forecast, by Industry 2020 & 2033
- Table 79: Global Shipbroking Market Revenue Million Forecast, by Country 2020 & 2033
- Table 80: Global Shipbroking Market Volume Billion Forecast, by Country 2020 & 2033
- Table 81: United Arab Emirates Shipbroking Market Revenue (Million) Forecast, by Application 2020 & 2033
- Table 82: United Arab Emirates Shipbroking Market Volume (Billion) Forecast, by Application 2020 & 2033
- Table 83: Saudi Arabia Shipbroking Market Revenue (Million) Forecast, by Application 2020 & 2033
- Table 84: Saudi Arabia Shipbroking Market Volume (Billion) Forecast, by Application 2020 & 2033
- Table 85: Rest of Middle East and Africa Shipbroking Market Revenue (Million) Forecast, by Application 2020 & 2033
- Table 86: Rest of Middle East and Africa Shipbroking Market Volume (Billion) Forecast, by Application 2020 & 2033
Frequently Asked Questions
1. What is the projected Compound Annual Growth Rate (CAGR) of the Shipbroking Market?
The projected CAGR is approximately 3.65%.
2. Which companies are prominent players in the Shipbroking Market?
Key companies in the market include Aries Shipbroking (Asia) Pte Ltd, BRS Group, Braemar Shipping Services PLC, Clarkson PLC, Howe Robinson Partners, Simpson Spense Young, Fearnleys A/S, ACM Shipping Group PLC, Chowgule Brothers Pvt Ltd, Affinity (Shipping) LLP**List Not Exhaustive.
3. What are the main segments of the Shipbroking Market?
The market segments include Type, Service, Industry.
4. Can you provide details about the market size?
The market size is estimated to be USD 1.49 Million as of 2022.
5. What are some drivers contributing to market growth?
Rise in Maritime Transport is Driving the Market; The Increasing Interconnectedness of Global Markets.
6. What are the notable trends driving market growth?
Rise in Oil and Gas Industry is Driving the Shipbroking Market.
7. Are there any restraints impacting market growth?
Rise in Maritime Transport is Driving the Market; The Increasing Interconnectedness of Global Markets.
8. Can you provide examples of recent developments in the market?
January 2024: The Danish shipping giant Maersk announced a significant long-term collaboration with its German counterpart, Hapag-Lloyd, consolidating hundreds of vessels under this partnership.September 2023: Global container liner shipping business ZIM Integrated Shipping Services Ltd signed a new operational collaboration agreement spanning many trades with MSC, the industry leader. This partnership is intended to improve service standards for ZIM's esteemed clientele and greatly increase operating efficiencies.
9. What pricing options are available for accessing the report?
Pricing options include single-user, multi-user, and enterprise licenses priced at USD 4750, USD 5250, and USD 8750 respectively.
10. Is the market size provided in terms of value or volume?
The market size is provided in terms of value, measured in Million and volume, measured in Billion.
11. Are there any specific market keywords associated with the report?
Yes, the market keyword associated with the report is "Shipbroking Market," which aids in identifying and referencing the specific market segment covered.
12. How do I determine which pricing option suits my needs best?
The pricing options vary based on user requirements and access needs. Individual users may opt for single-user licenses, while businesses requiring broader access may choose multi-user or enterprise licenses for cost-effective access to the report.
13. Are there any additional resources or data provided in the Shipbroking Market report?
While the report offers comprehensive insights, it's advisable to review the specific contents or supplementary materials provided to ascertain if additional resources or data are available.
14. How can I stay updated on further developments or reports in the Shipbroking Market?
To stay informed about further developments, trends, and reports in the Shipbroking Market, consider subscribing to industry newsletters, following relevant companies and organizations, or regularly checking reputable industry news sources and publications.
Methodology
Step 1 - Identification of Relevant Samples Size from Population Database


Step 2 - Approaches for Defining Global Market Size (Value, Volume* & Price*)

Note*: In applicable scenarios
Step 3 - Data Sources
Primary Research
- Web Analytics
- Survey Reports
- Research Institute
- Latest Research Reports
- Opinion Leaders
Secondary Research
- Annual Reports
- White Paper
- Latest Press Release
- Industry Association
- Paid Database
- Investor Presentations

Step 4 - Data Triangulation
Involves using different sources of information in order to increase the validity of a study
These sources are likely to be stakeholders in a program - participants, other researchers, program staff, other community members, and so on.
Then we put all data in single framework & apply various statistical tools to find out the dynamic on the market.
During the analysis stage, feedback from the stakeholder groups would be compared to determine areas of agreement as well as areas of divergence